Climate for Station: Tripoli Airport, Tripoli District, Libya
Loading live weather...
Climate Analysis & Overview
Tripoli Airport has experienced a complex climate evolution, with a notable divergence in temperature trends over the past decade compared to all-time records. While high temperatures have cooled slightly over the long term, recent years have seen a significant warming of lows, indicating shifting climatic dynamics in the region. Meanwhile, precipitation patterns have become more evenly distributed, suggesting changes in local weather systems.
Shifting Thermal Dynamics
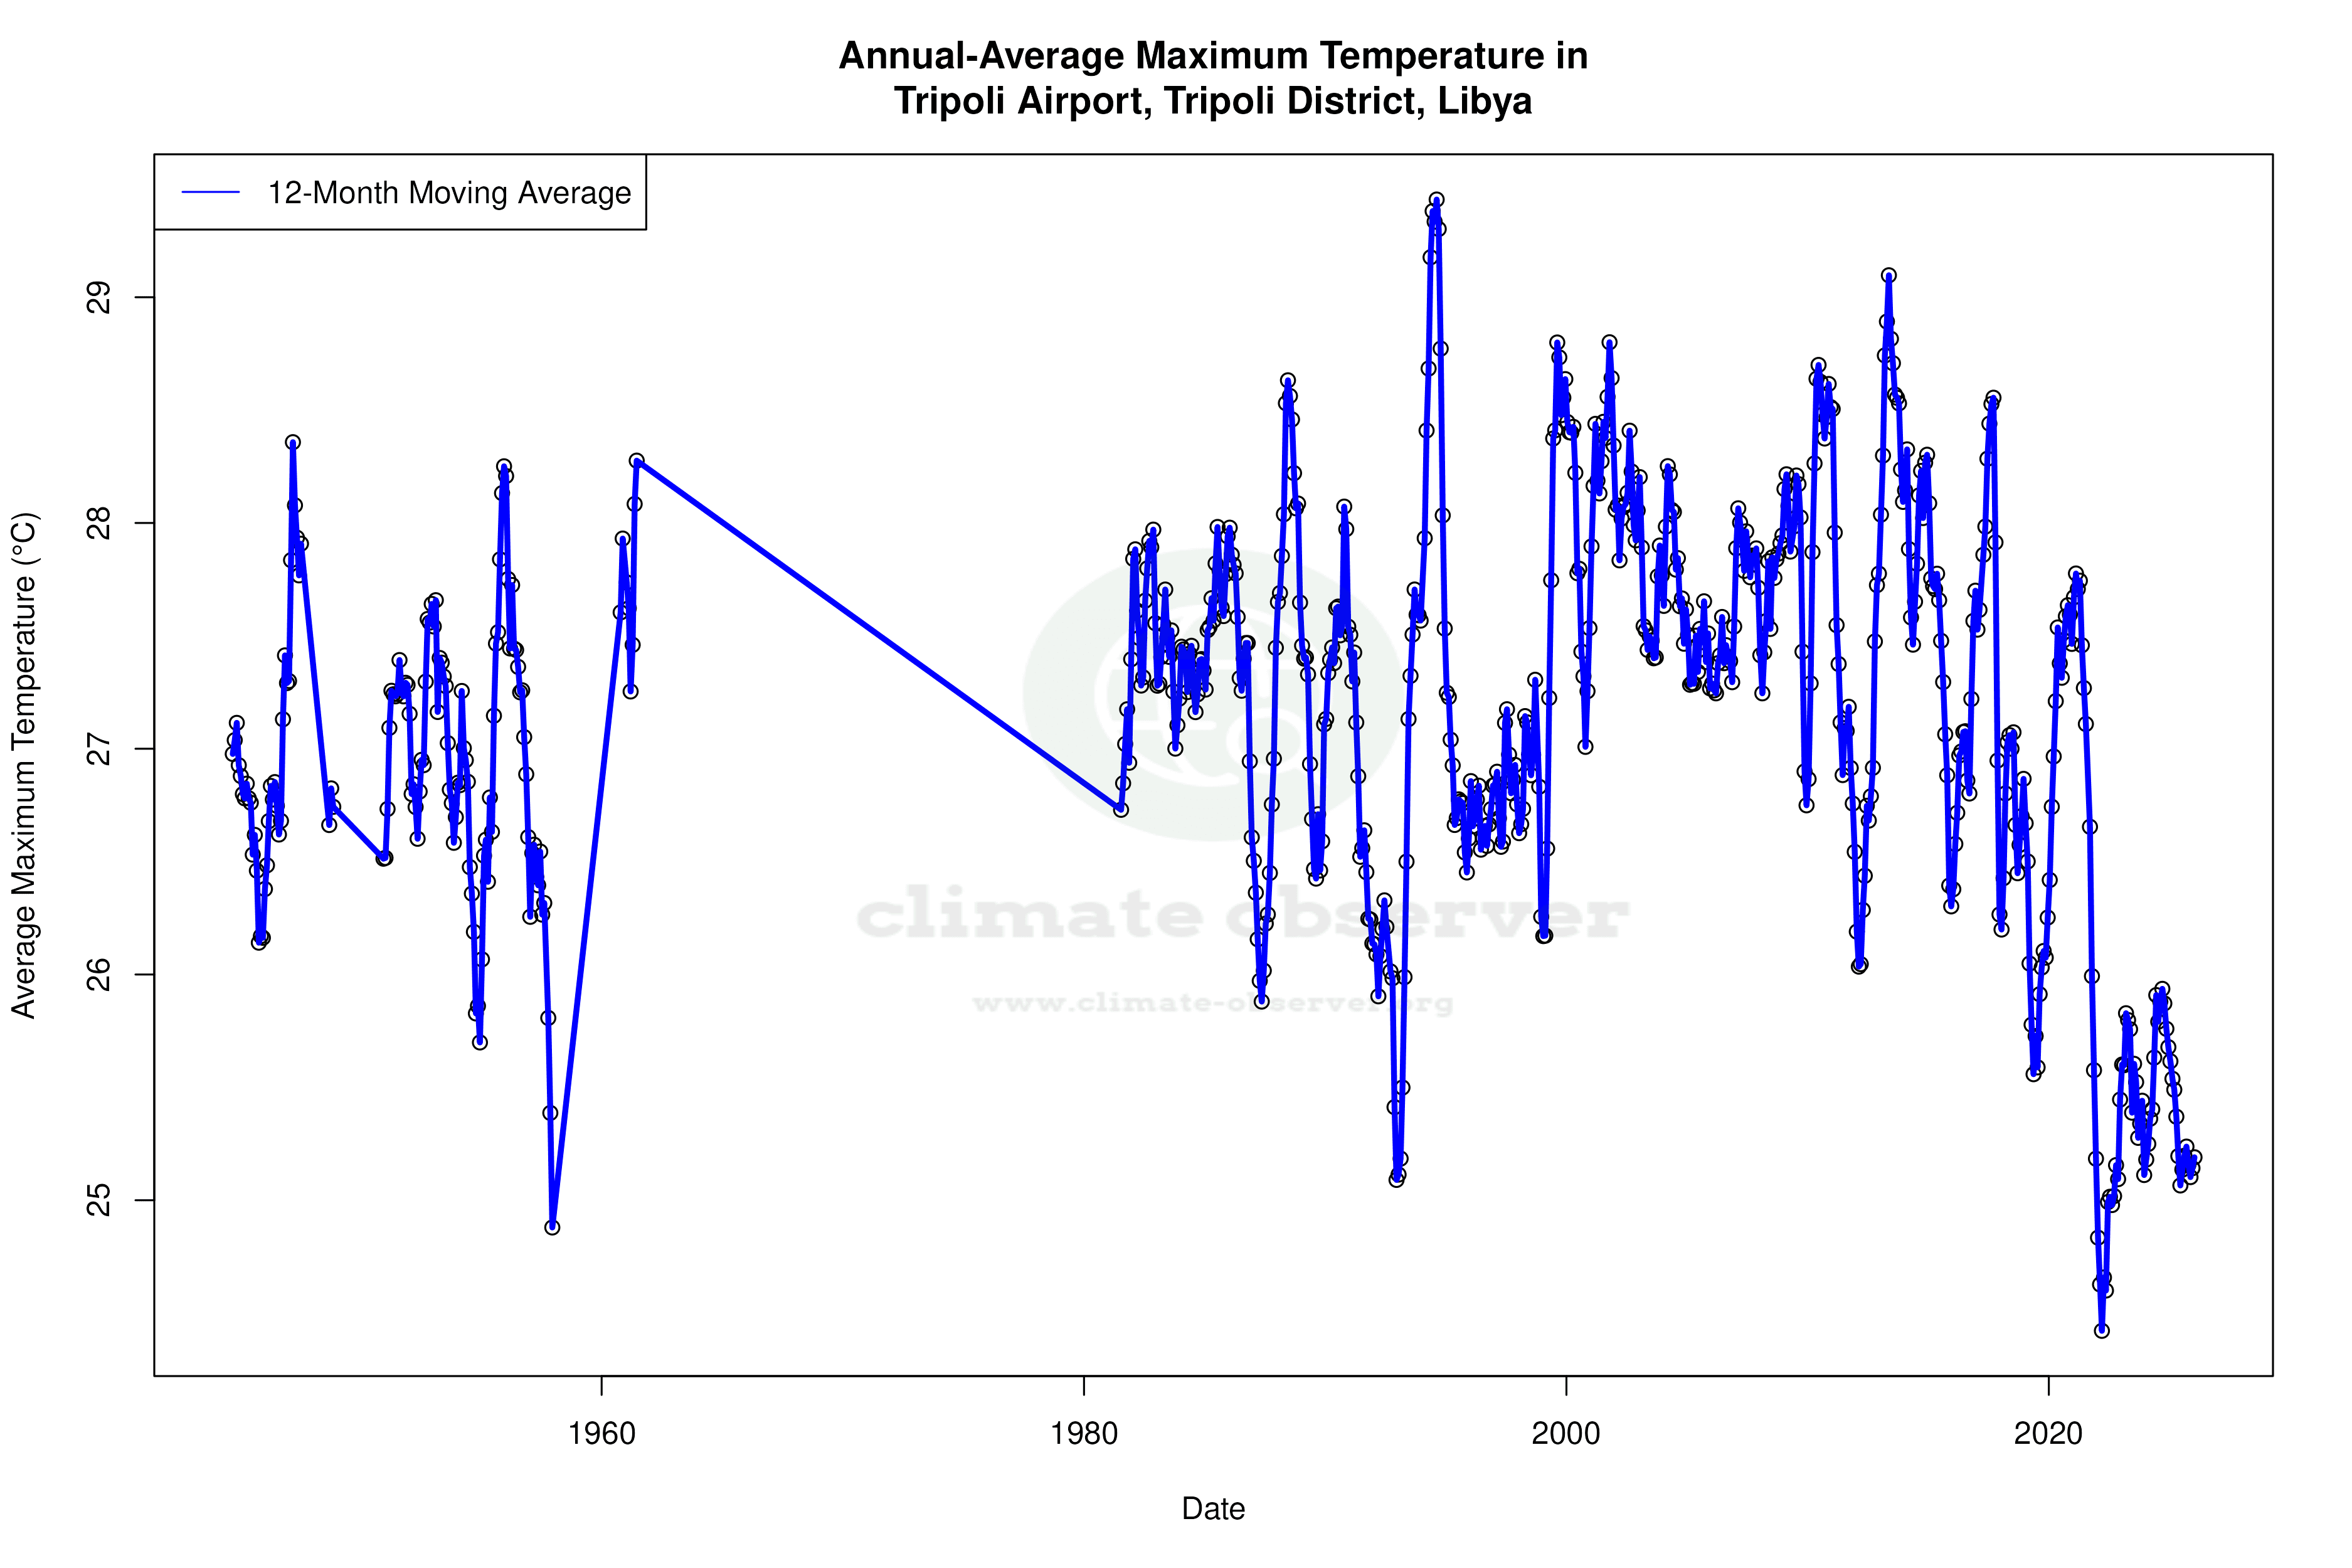
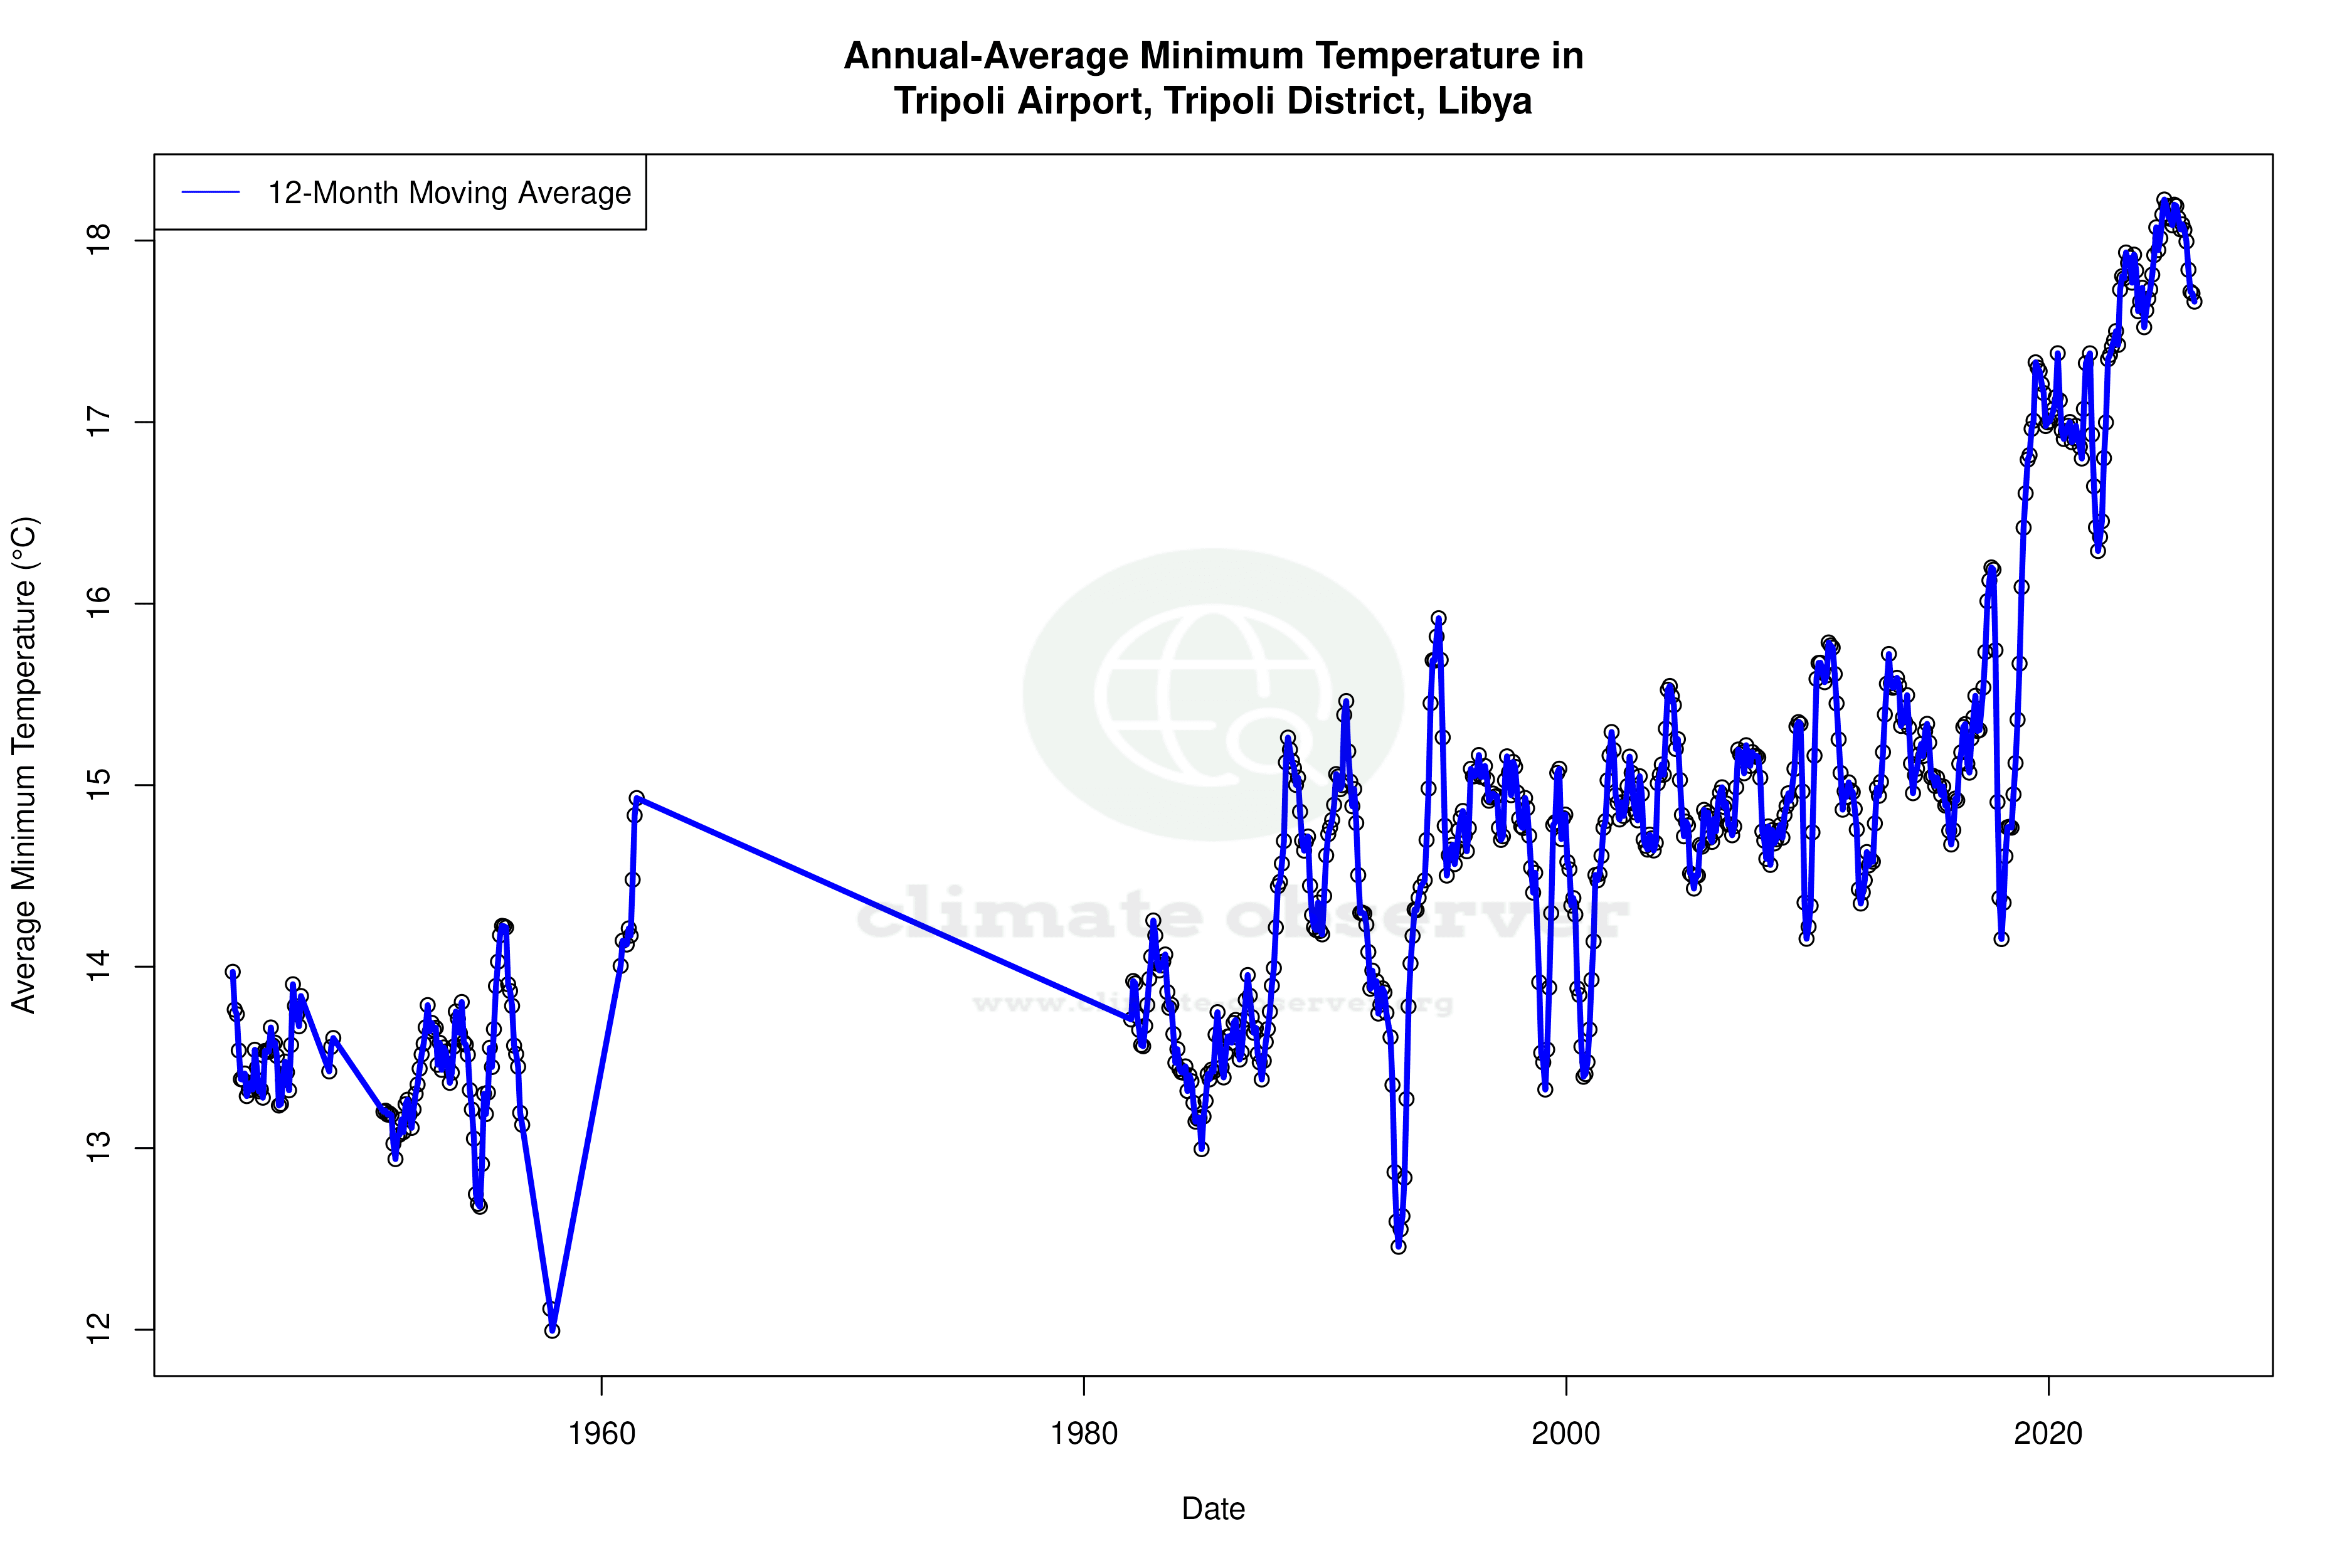
Tripoli Airport, located at 32.67°N, 13.15°E, is situated in a region classified under the Köppen climate system as a hot semi-arid climate (BSh). The geographical setting, near the Mediterranean coast, influences its climate, providing a mix of maritime and desert characteristics. Over the past decade, high temperatures have shown a cooling trend of -2.20°C (-3.96°F), contrasting with a warming trend in low temperatures of 3.60°C (6.48°F). This divergence suggests a complex interplay of regional climate factors, possibly influenced by broader climatic shifts or localised effects such as urban heat.
Long-term Temperature Trends
Examining the all-time trends reveals a more subtle change. High temperatures have experienced a minor cooling of -0.02°C (-0.04°F), while low temperatures have risen by 0.43°C (0.77°F). This indicates a gradual warming of the region's nights over the years, which could be linked to global warming or changes in regional weather patterns. Such trends highlight the importance of continuous monitoring to understand the underlying causes and potential impacts on local ecosystems and human activities.
Precipitation Patterns and Distribution
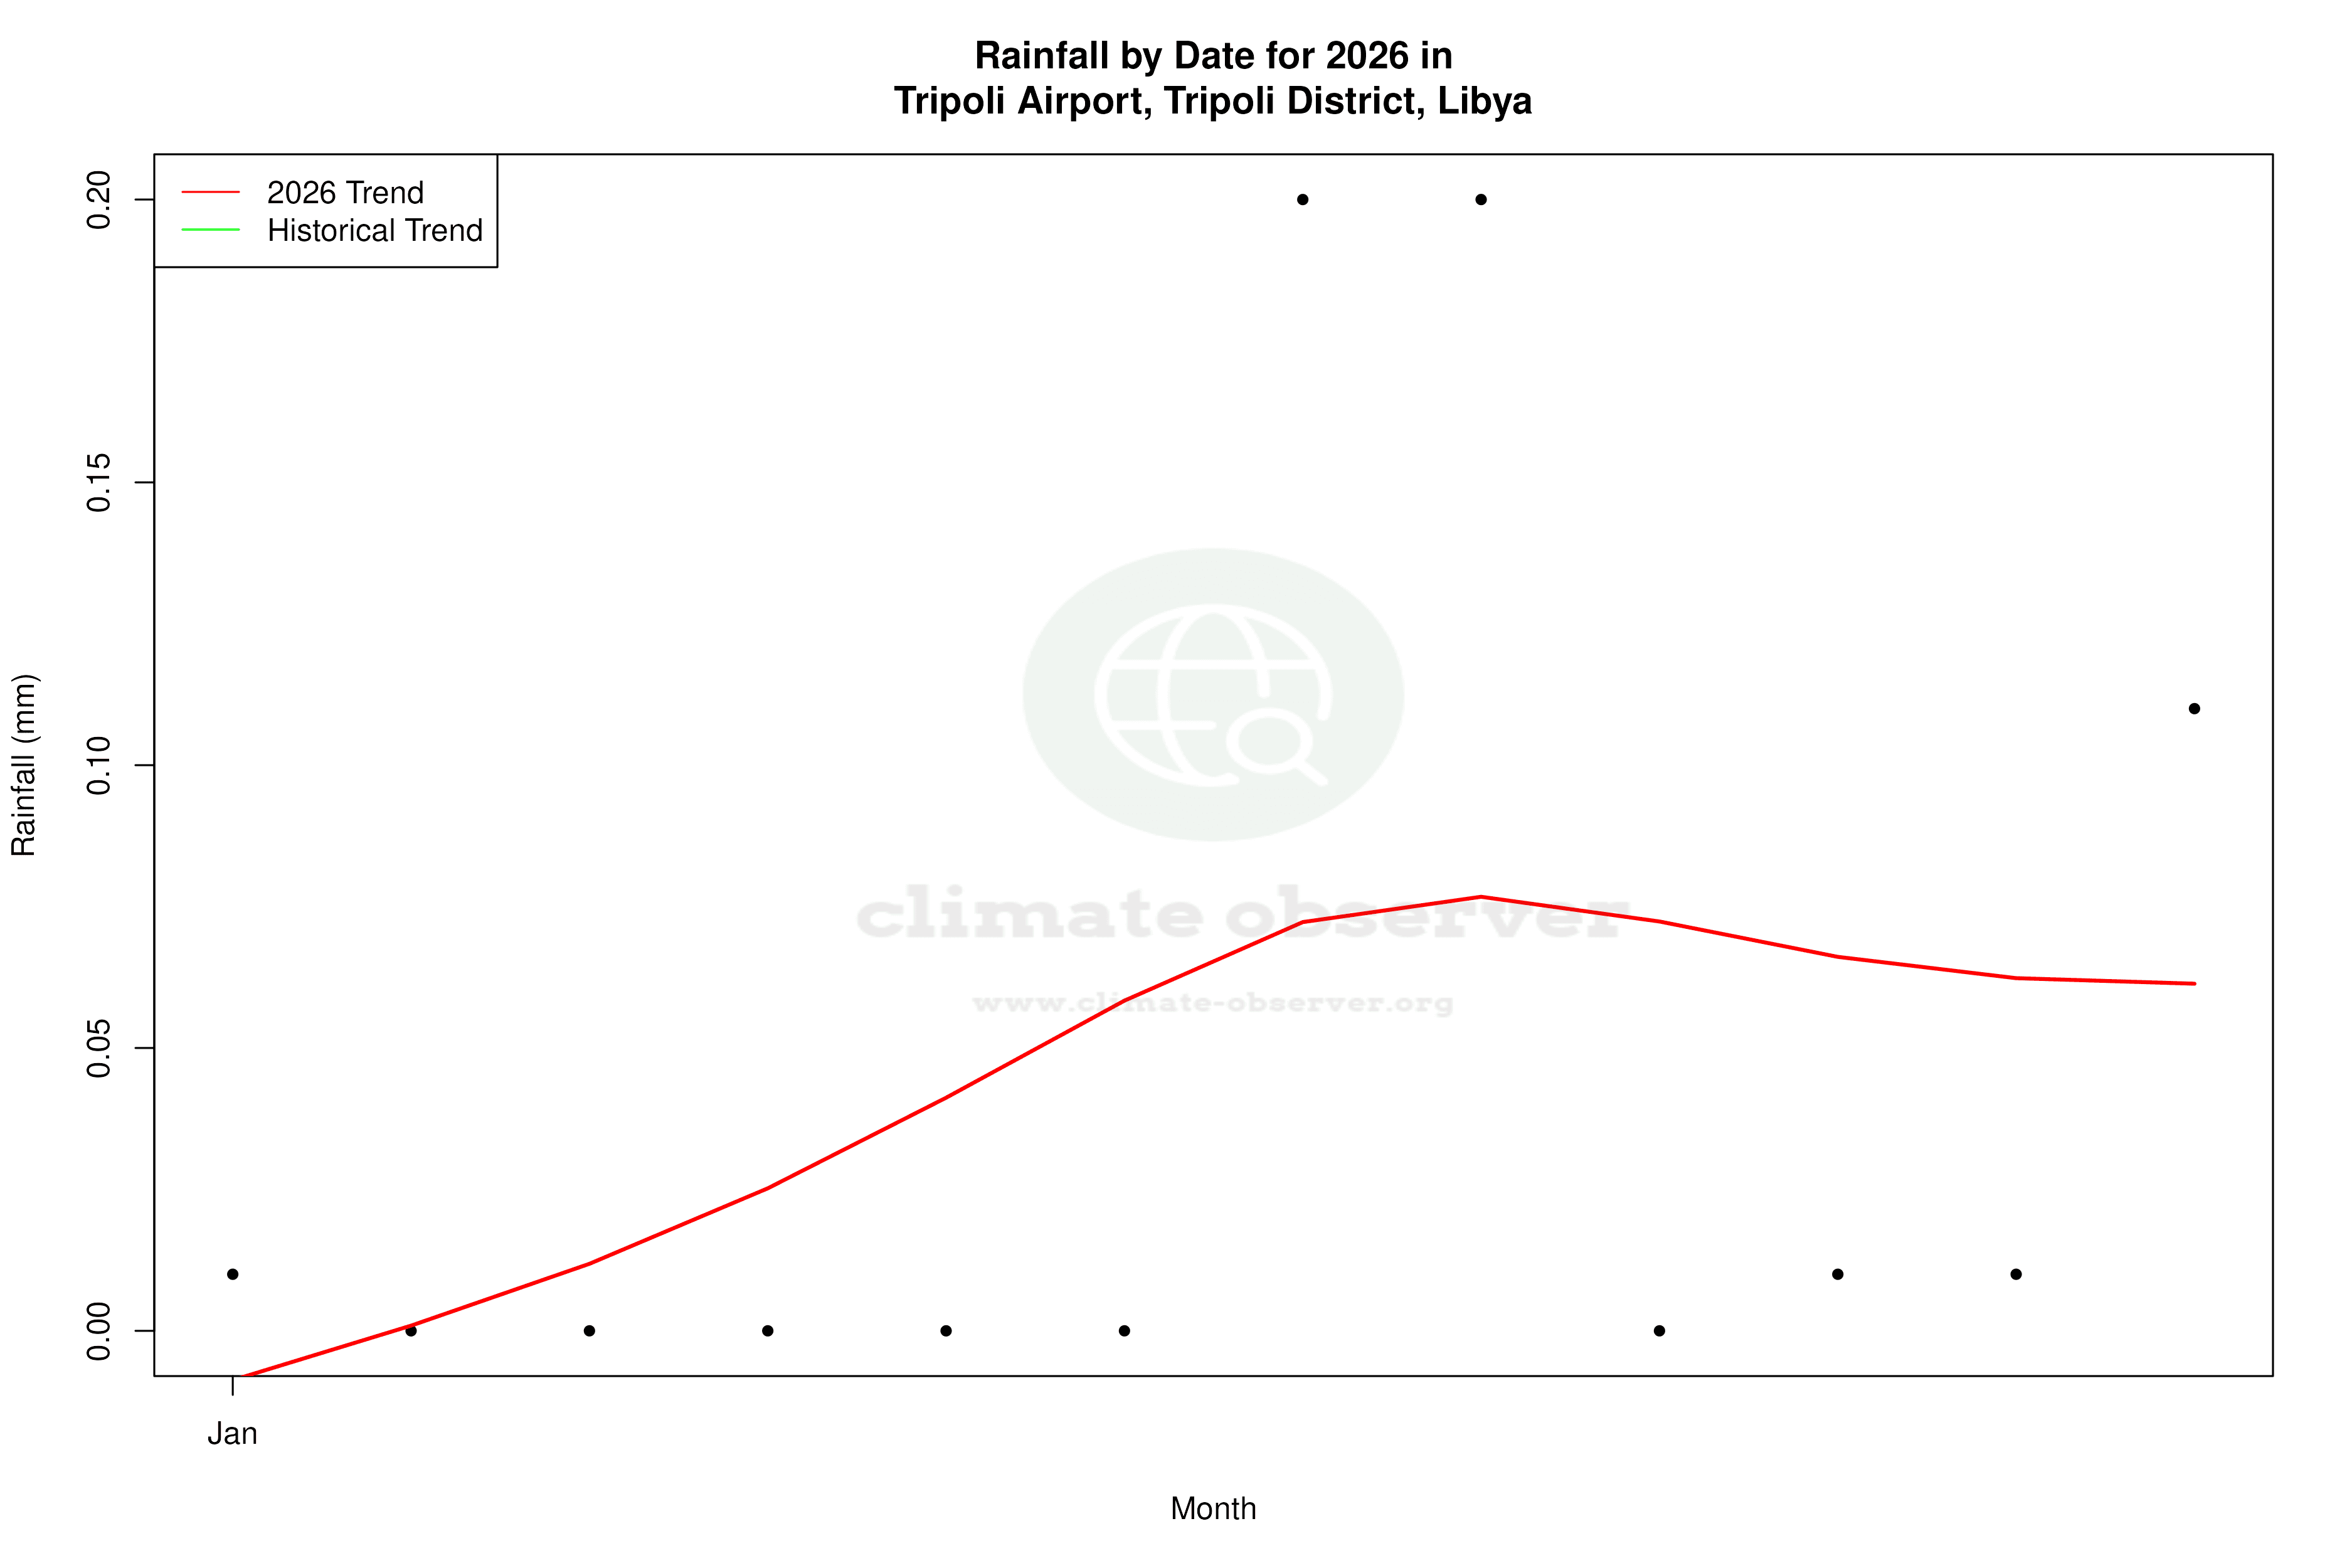
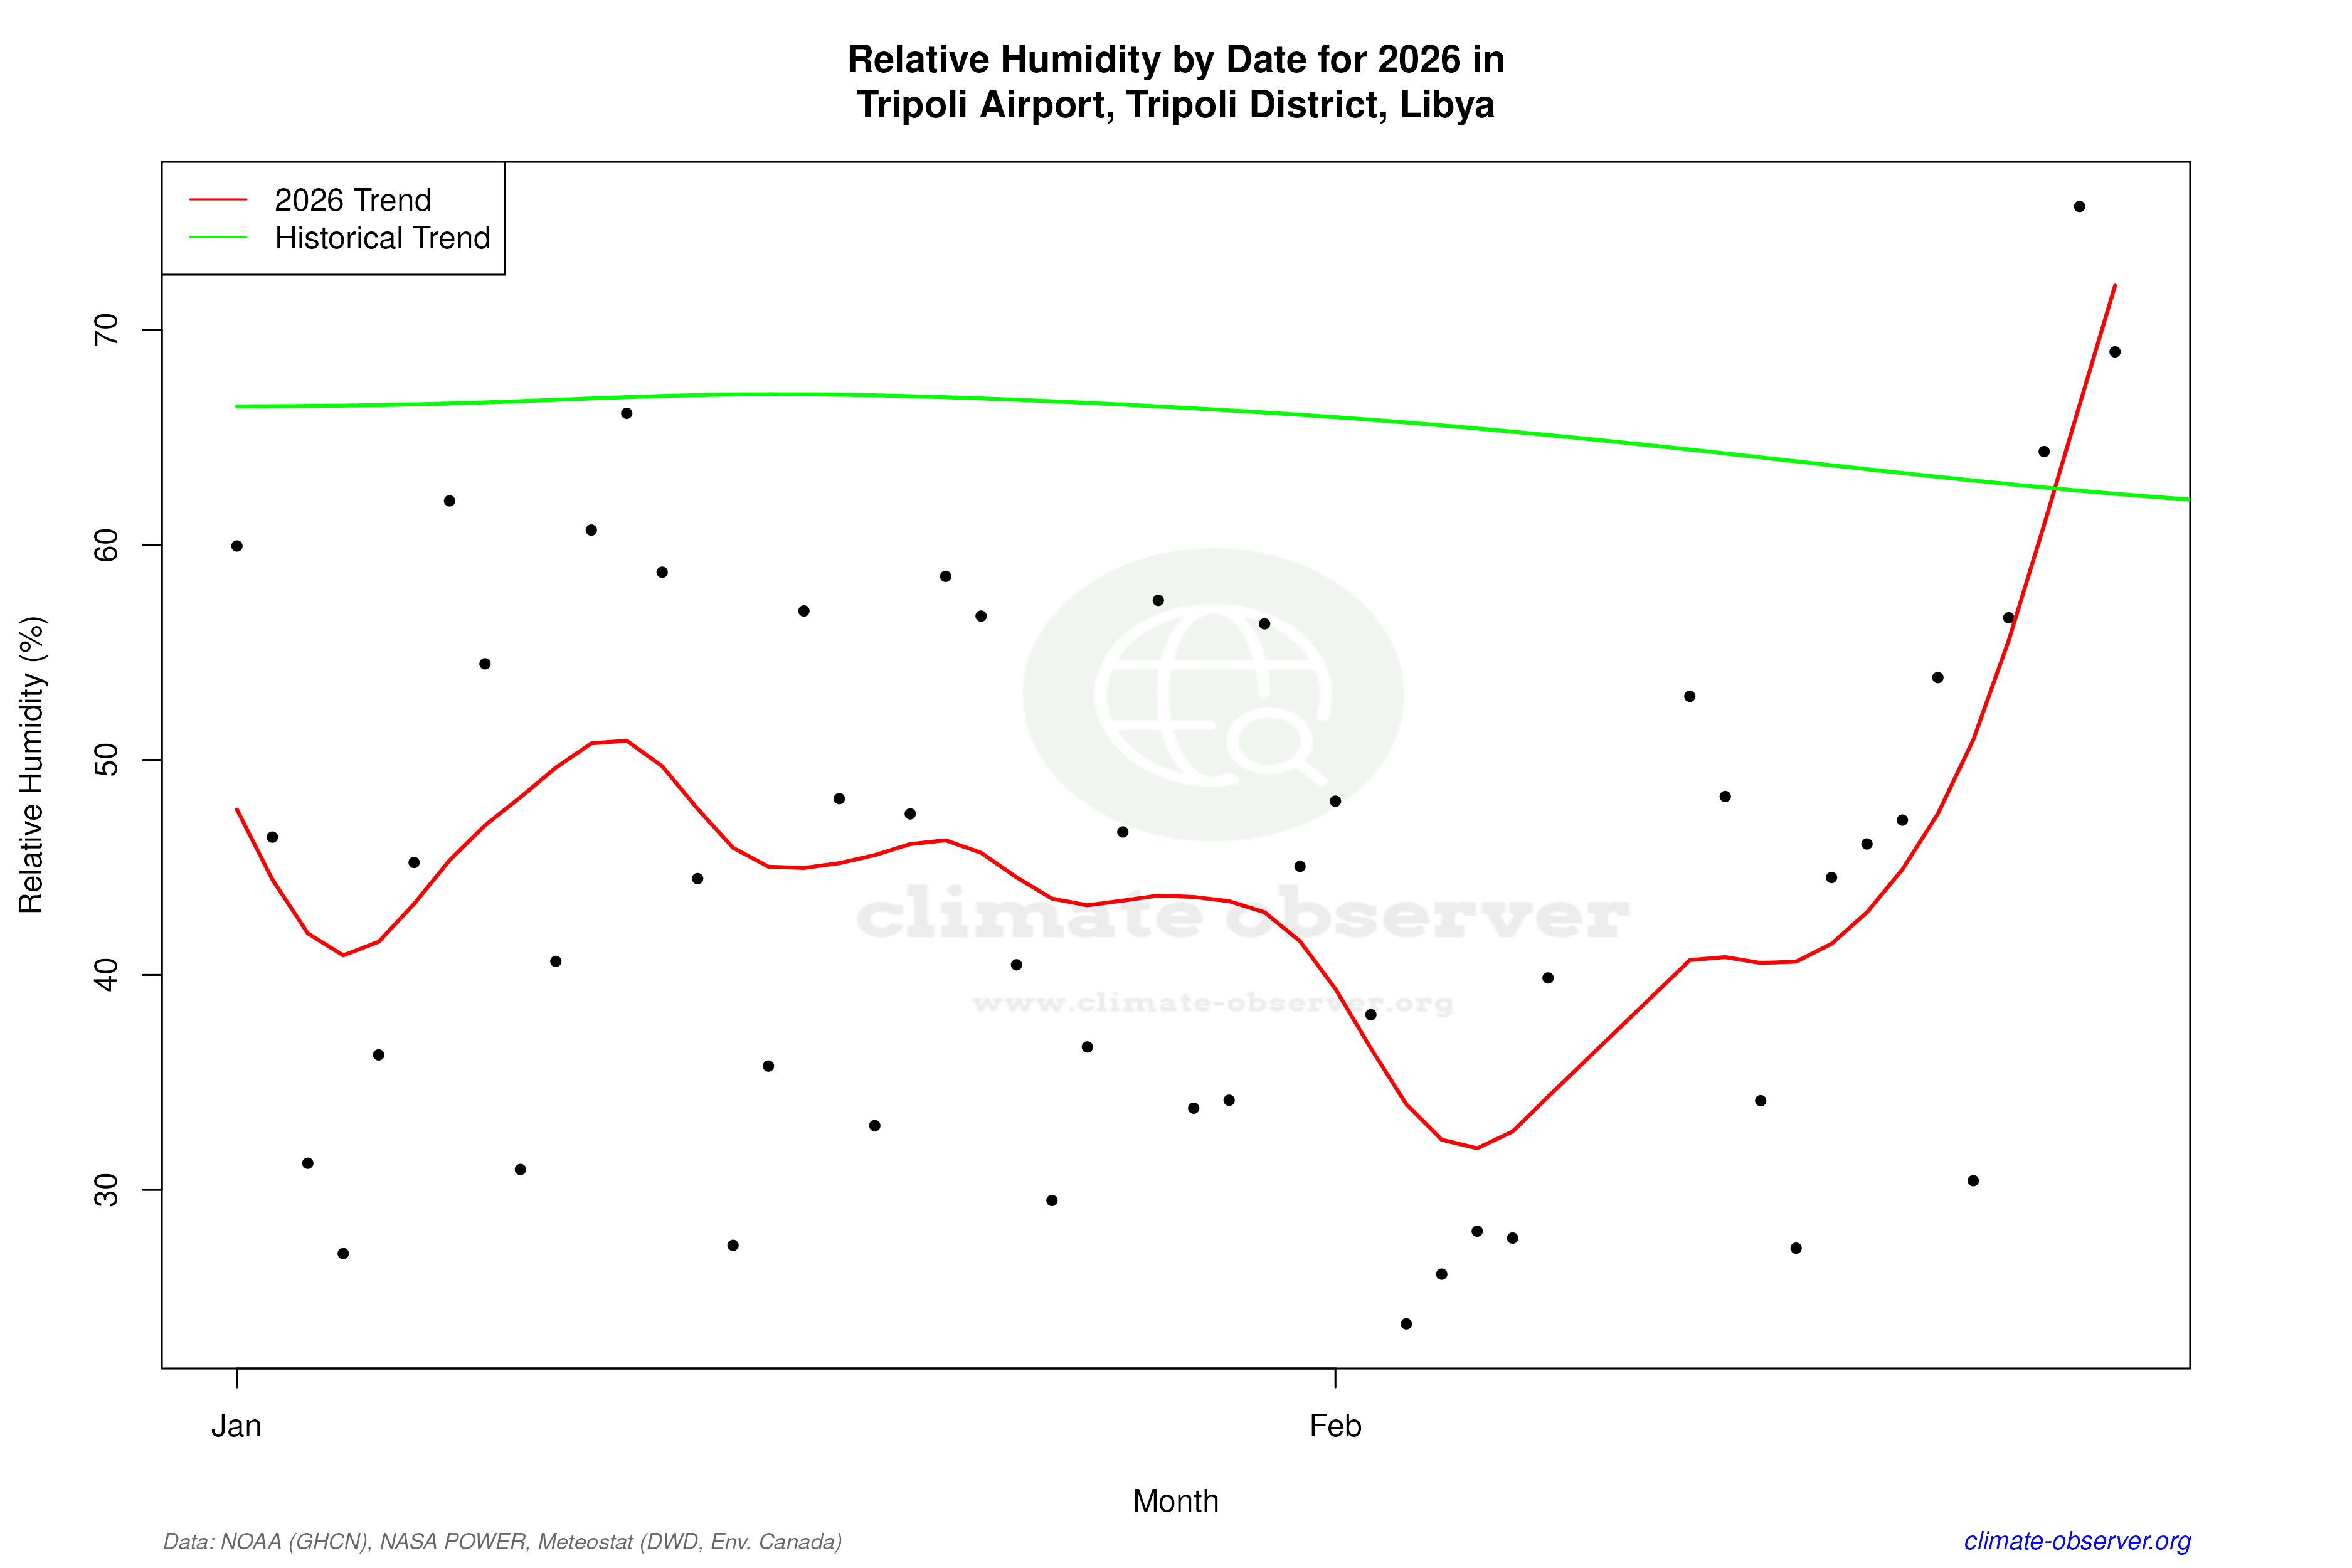
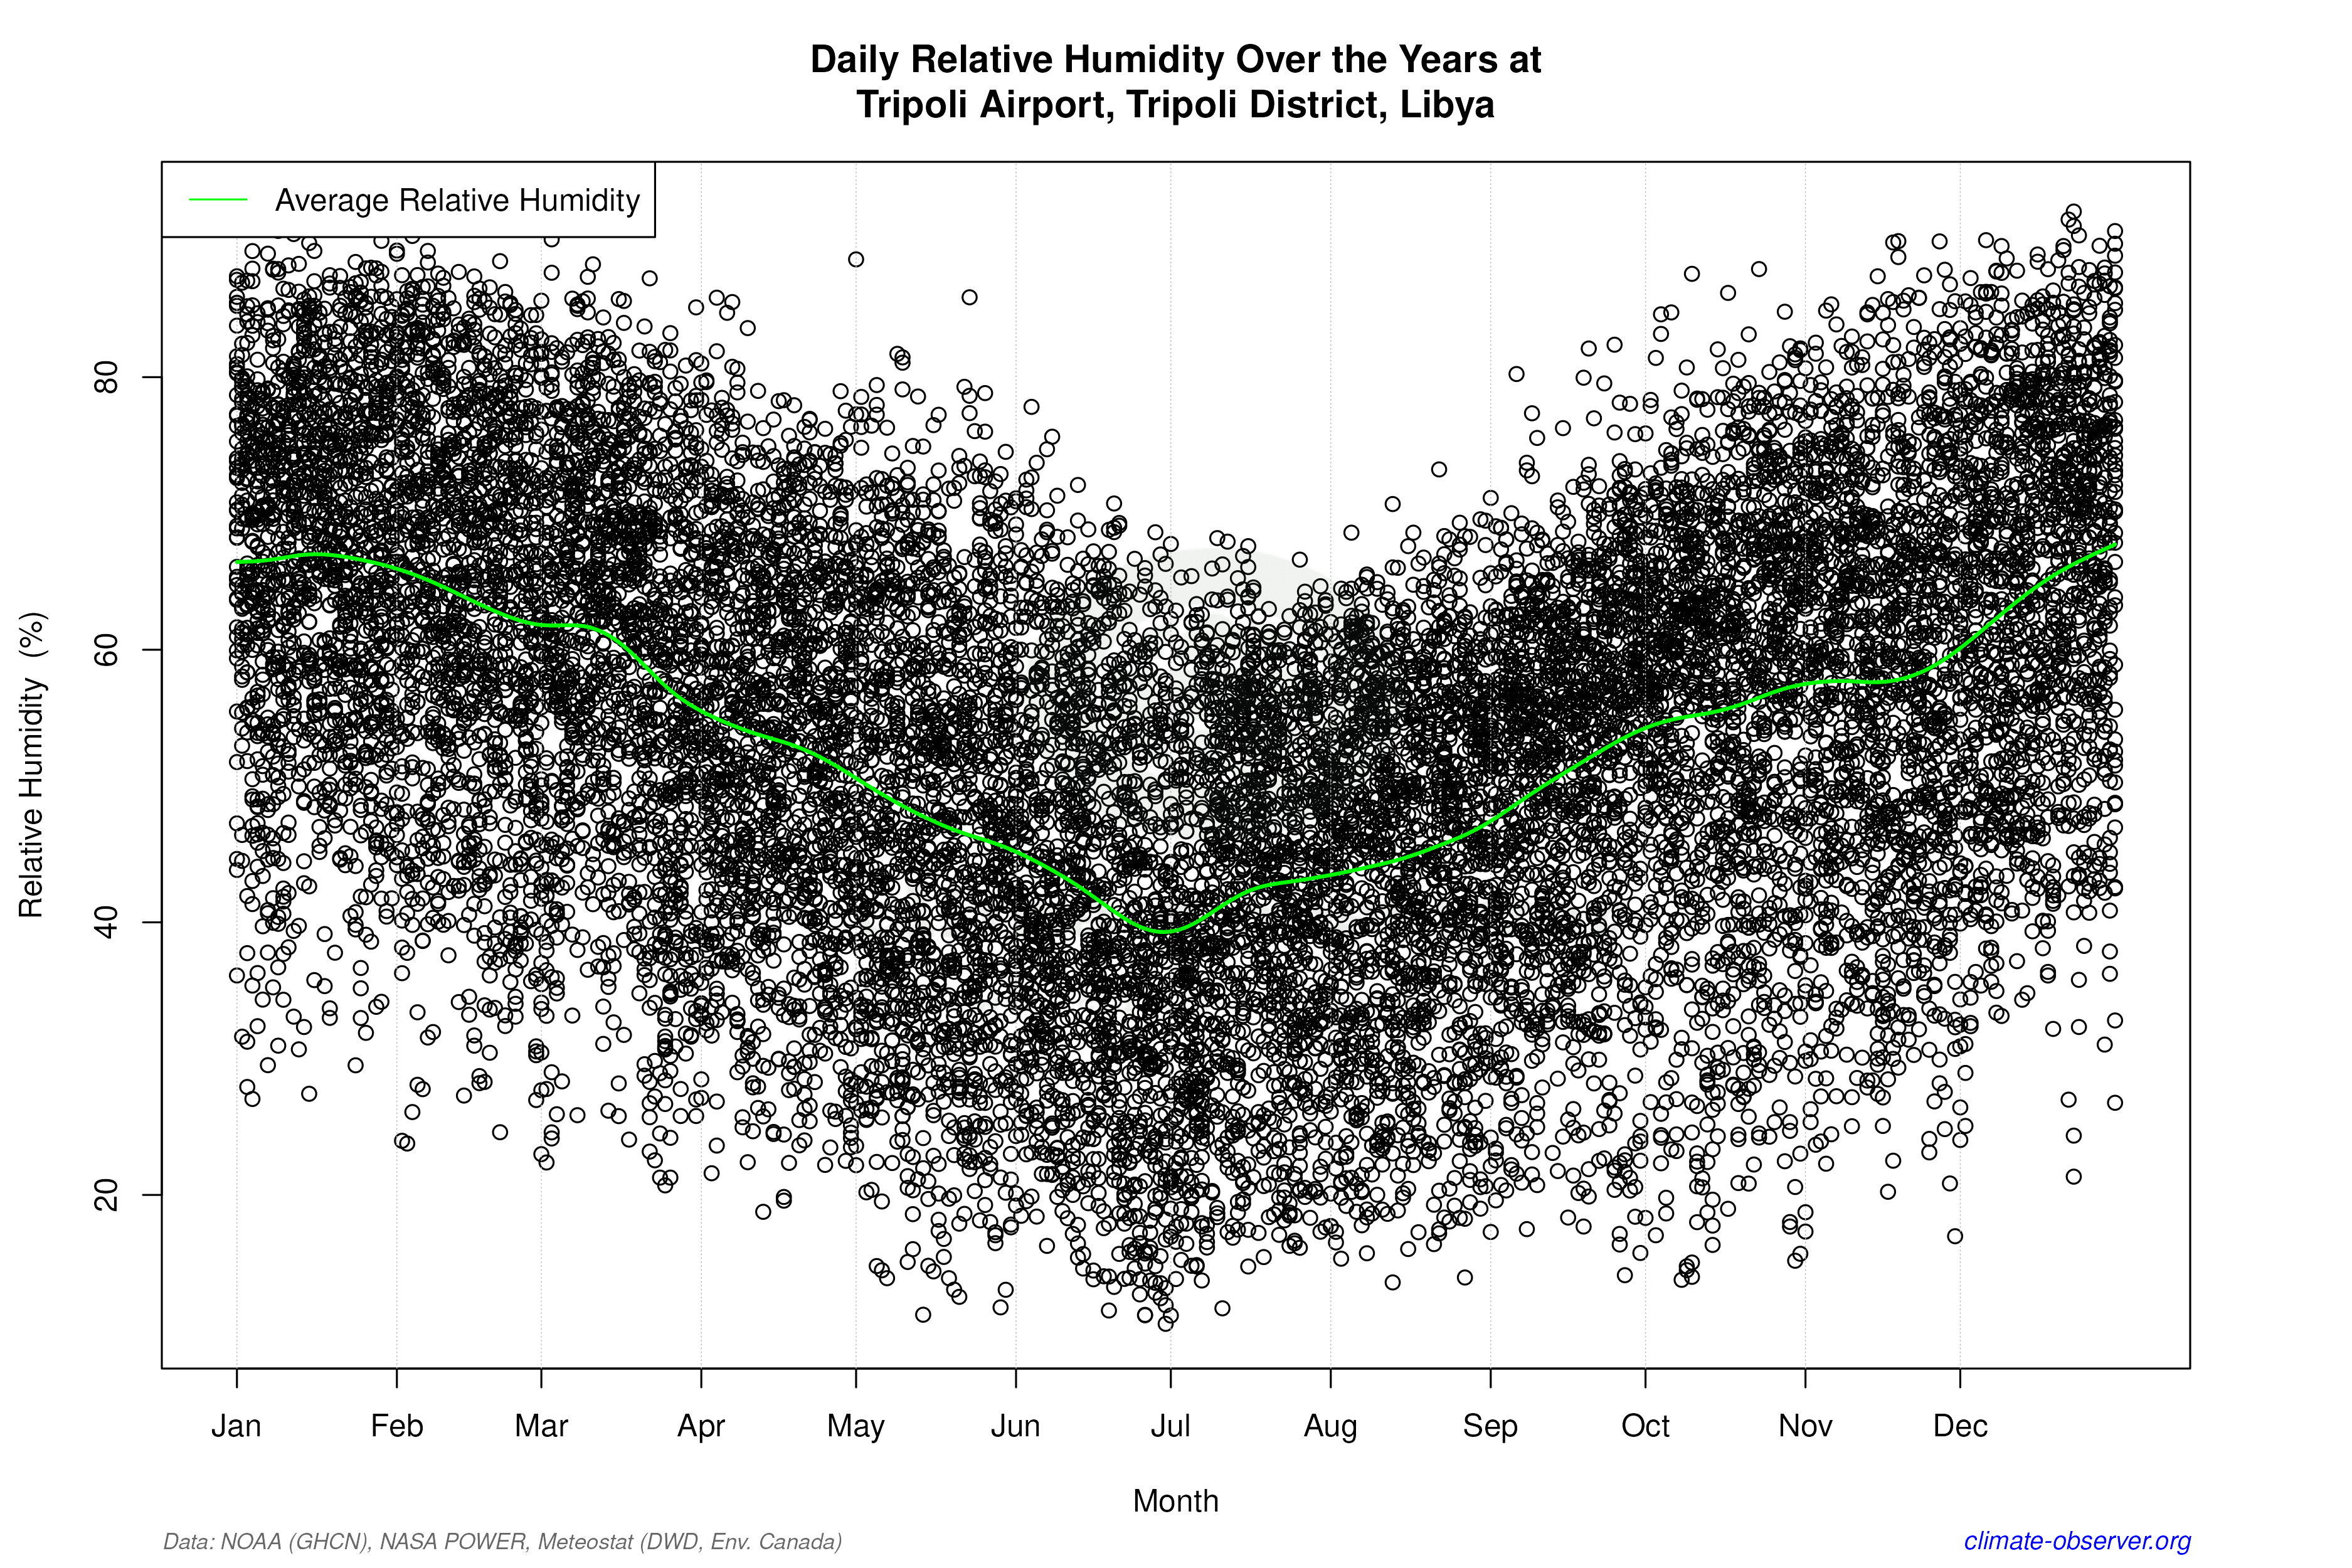
The Precipitation Concentration Index (PCI) provides insights into how rainfall is distributed throughout the year. A decrease from a baseline of 23.48 to a current value of 15.47 indicates a significant shift towards more evenly distributed precipitation. This change may reflect alterations in atmospheric circulation patterns or the influence of regional climatic phenomena, potentially leading to more consistent water availability throughout the year.
Record Extremes
Tripoli Airport has recorded some extreme temperatures, with a maximum of 49.2°C (120.6°F) and a minimum of -1.5°C (29.3°F). These extremes underscore the variability inherent in the region's climate, where hot, dry summers can be punctuated by rare cold spells. Such records are crucial for understanding the potential range of climate variability and preparing for future extremes.
Regional Climate Context
Libya's climate goals focus on adapting to and mitigating the impacts of climate change, with an emphasis on sustainable water management and desertification control. Recent weather events, such as intense heatwaves, underscore the urgency of these goals. The trends observed at Tripoli Airport provide valuable data for informing these efforts, highlighting the need for adaptive strategies that account for both warming lows and changing precipitation patterns.
Station Statistics
10-Year Trend
High: -2.21 °C/decade
Low: +3.59 °C/decade
Rain: -0.38 mm/decade
25-Year Trend
High: -1.02 °C/decade
Low: +1.35 °C/decade
Rain: +0.04 mm/decade
50-Year Trend
High: -0.21 °C/decade
Low: +0.79 °C/decade
Rain: -0.01 mm/decade
All-Time Trend
High: -0.02 °C/decade
Low: +0.43 °C/decade
Rain: -0.03 mm/decade
Percentage Above-Average Days
Last 12 Months: 41.9%
This Year: 52.5%
Precipitation Concentration Index (PCI) ℹ️
Last 12 Months: 18.4
Historical Average: 23.7
Percentile Rank of Last 12 Months ℹ️
High: 3rd percentile
Low: 98th percentile
Rain: 20th percentile
Change in Variance ℹ️
High: -16.8%
Low: -2.9%
Intraday: -28.2%
Data Coverage
77.5%
First Year of Data
1943
Station Location
Historical Weather Records
| Max High | Avg High | Min High | Max Avg | Avg Avg | Min Avg | Max Low | Avg Low | Min Low | Max Precipitation | Avg Precipitation | Max Snow | Avg Snow | |
|---|---|---|---|---|---|---|---|---|---|---|---|---|---|
| Record | 49.2 °C | — | 6.8 °C | 41.9 °C | — | 4.6 °C | 31.8 °C | — | -1.5 °C | 179.4 mm | — | — | — |
| January | 32.8 °C | 17.1 °C | 6.8 °C | 22.3 °C | 11.9 °C | 4.6 °C | 17.6 °C | 7.0 °C | -0.9 °C | 47.1 mm | 1.7 mm | — | — |
| February | 36.2 °C | 18.8 °C | 9.4 °C | 27.3 °C | 12.9 °C | 5.7 °C | 21.5 °C | 7.4 °C | -1.5 °C | 57.2 mm | 1.2 mm | — | — |
| March | 39.6 °C | 21.9 °C | 10.0 °C | 28.8 °C | 15.4 °C | 6.4 °C | 23.3 °C | 9.3 °C | 0.0 °C | 81.5 mm | 0.7 mm | — | — |
| April | 44.0 °C | 26.0 °C | 14.0 °C | 32.2 °C | 18.9 °C | 10.4 °C | 27.8 °C | 12.3 °C | 0.0 °C | 97.0 mm | 0.4 mm | — | — |
| May | 46.7 °C | 30.2 °C | 14.9 °C | 39.4 °C | 23.1 °C | 13.5 °C | 31.8 °C | 16.1 °C | 2.8 °C | 84.4 mm | 0.2 mm | — | — |
| June | 49.2 °C | 34.2 °C | 21.7 °C | 40.1 °C | 26.8 °C | 17.8 °C | 31.6 °C | 19.8 °C | 10.0 °C | 25.6 mm | 0.0 mm | — | — |
| July | 48.0 °C | 35.7 °C | 25.0 °C | 41.9 °C | 28.3 °C | 20.0 °C | 31.2 °C | 21.3 °C | 9.0 °C | 8.2 mm | 0.0 mm | — | — |
| August | 48.5 °C | 35.9 °C | 27.2 °C | 38.7 °C | 28.6 °C | 21.9 °C | 31.0 °C | 22.0 °C | 9.0 °C | 21.4 mm | 0.1 mm | — | — |
| September | 46.3 °C | 33.7 °C | 22.7 °C | 37.6 °C | 26.8 °C | 18.3 °C | 29.3 °C | 20.9 °C | 10.0 °C | 179.4 mm | 0.8 mm | — | — |
| October | 42.6 °C | 29.3 °C | 17.0 °C | 36.5 °C | 22.9 °C | 12.3 °C | 31.4 °C | 17.5 °C | 5.0 °C | 99.0 mm | 1.0 mm | — | — |
| November | 38.5 °C | 23.3 °C | 13.0 °C | 30.8 °C | 17.4 °C | 8.8 °C | 23.3 °C | 12.3 °C | 2.0 °C | 97.0 mm | 1.4 mm | — | — |
| December | 32.1 °C | 18.6 °C | 7.2 °C | 26.3 °C | 13.3 °C | 5.6 °C | 20.5 °C | 8.6 °C | 0.0 °C | 68.0 mm | 1.7 mm | — | — |
Data Visualisations
Remove WatermarksCurrent Year Climate Trends vs Historical


Max Temperature this Year | 1 of 6
Climate 12-Month Moving Averages
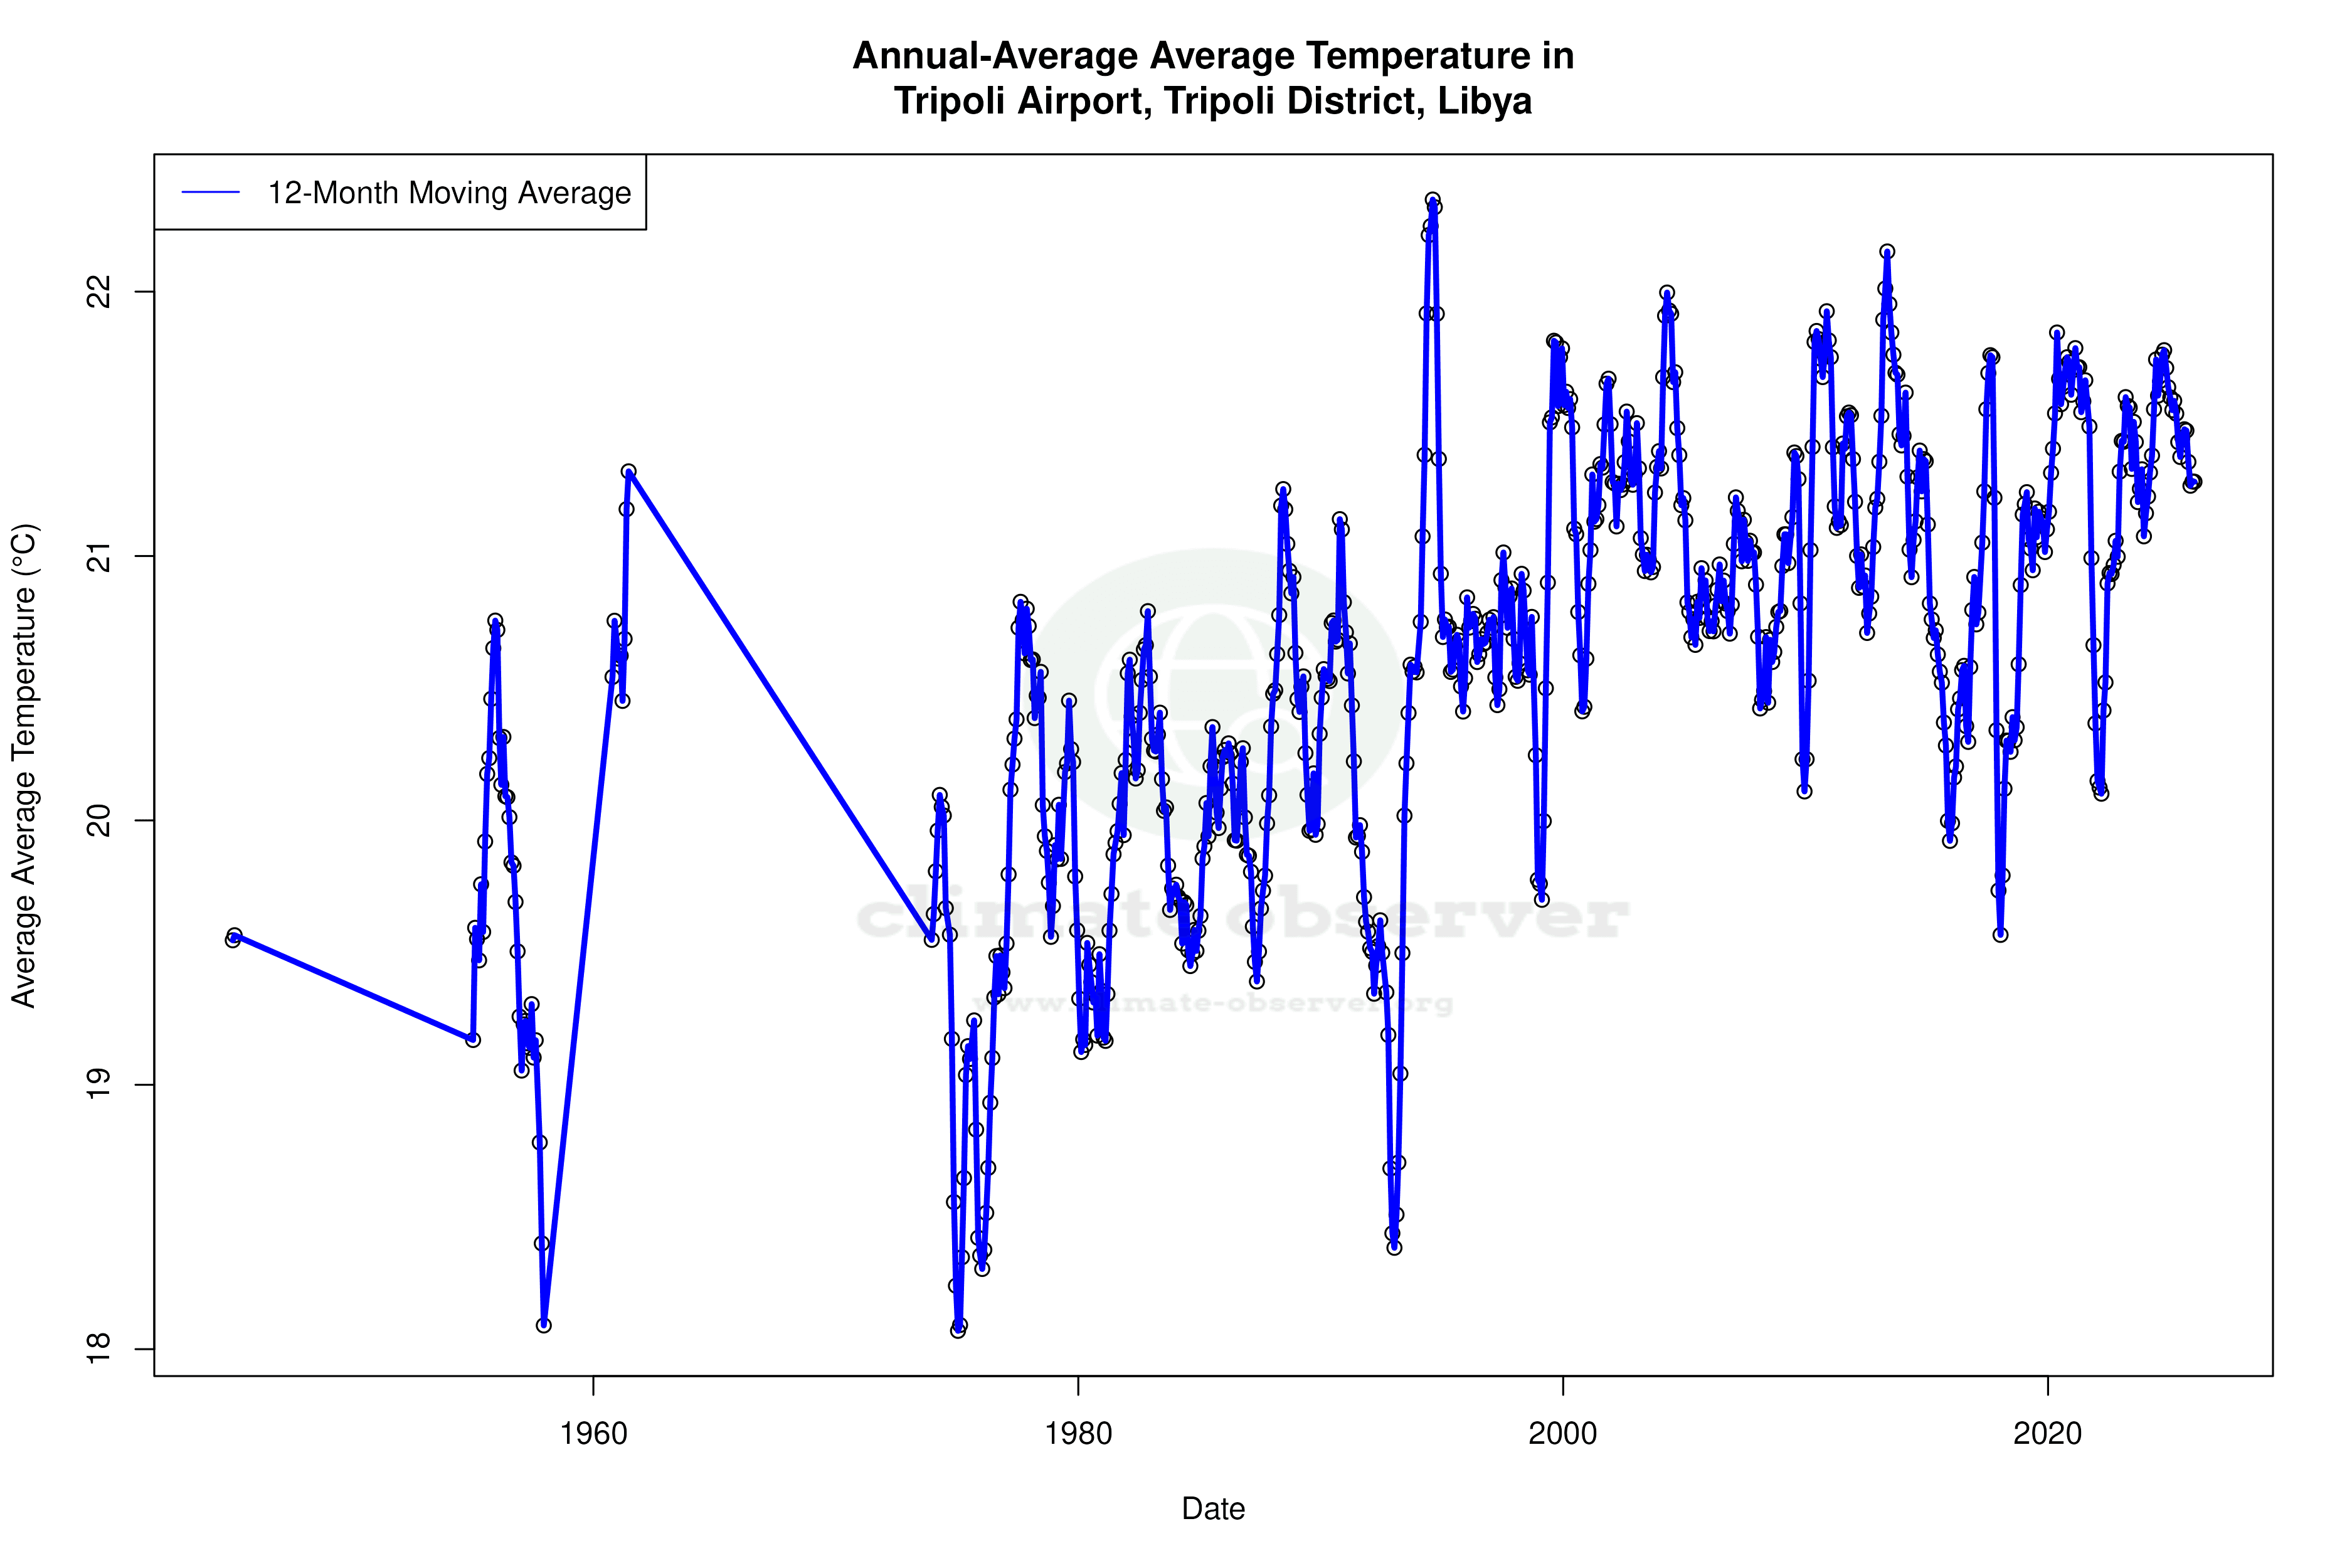


Max Temperature 12-Month MA | 1 of 6
Daily Data Points and Averages Throughout the Year

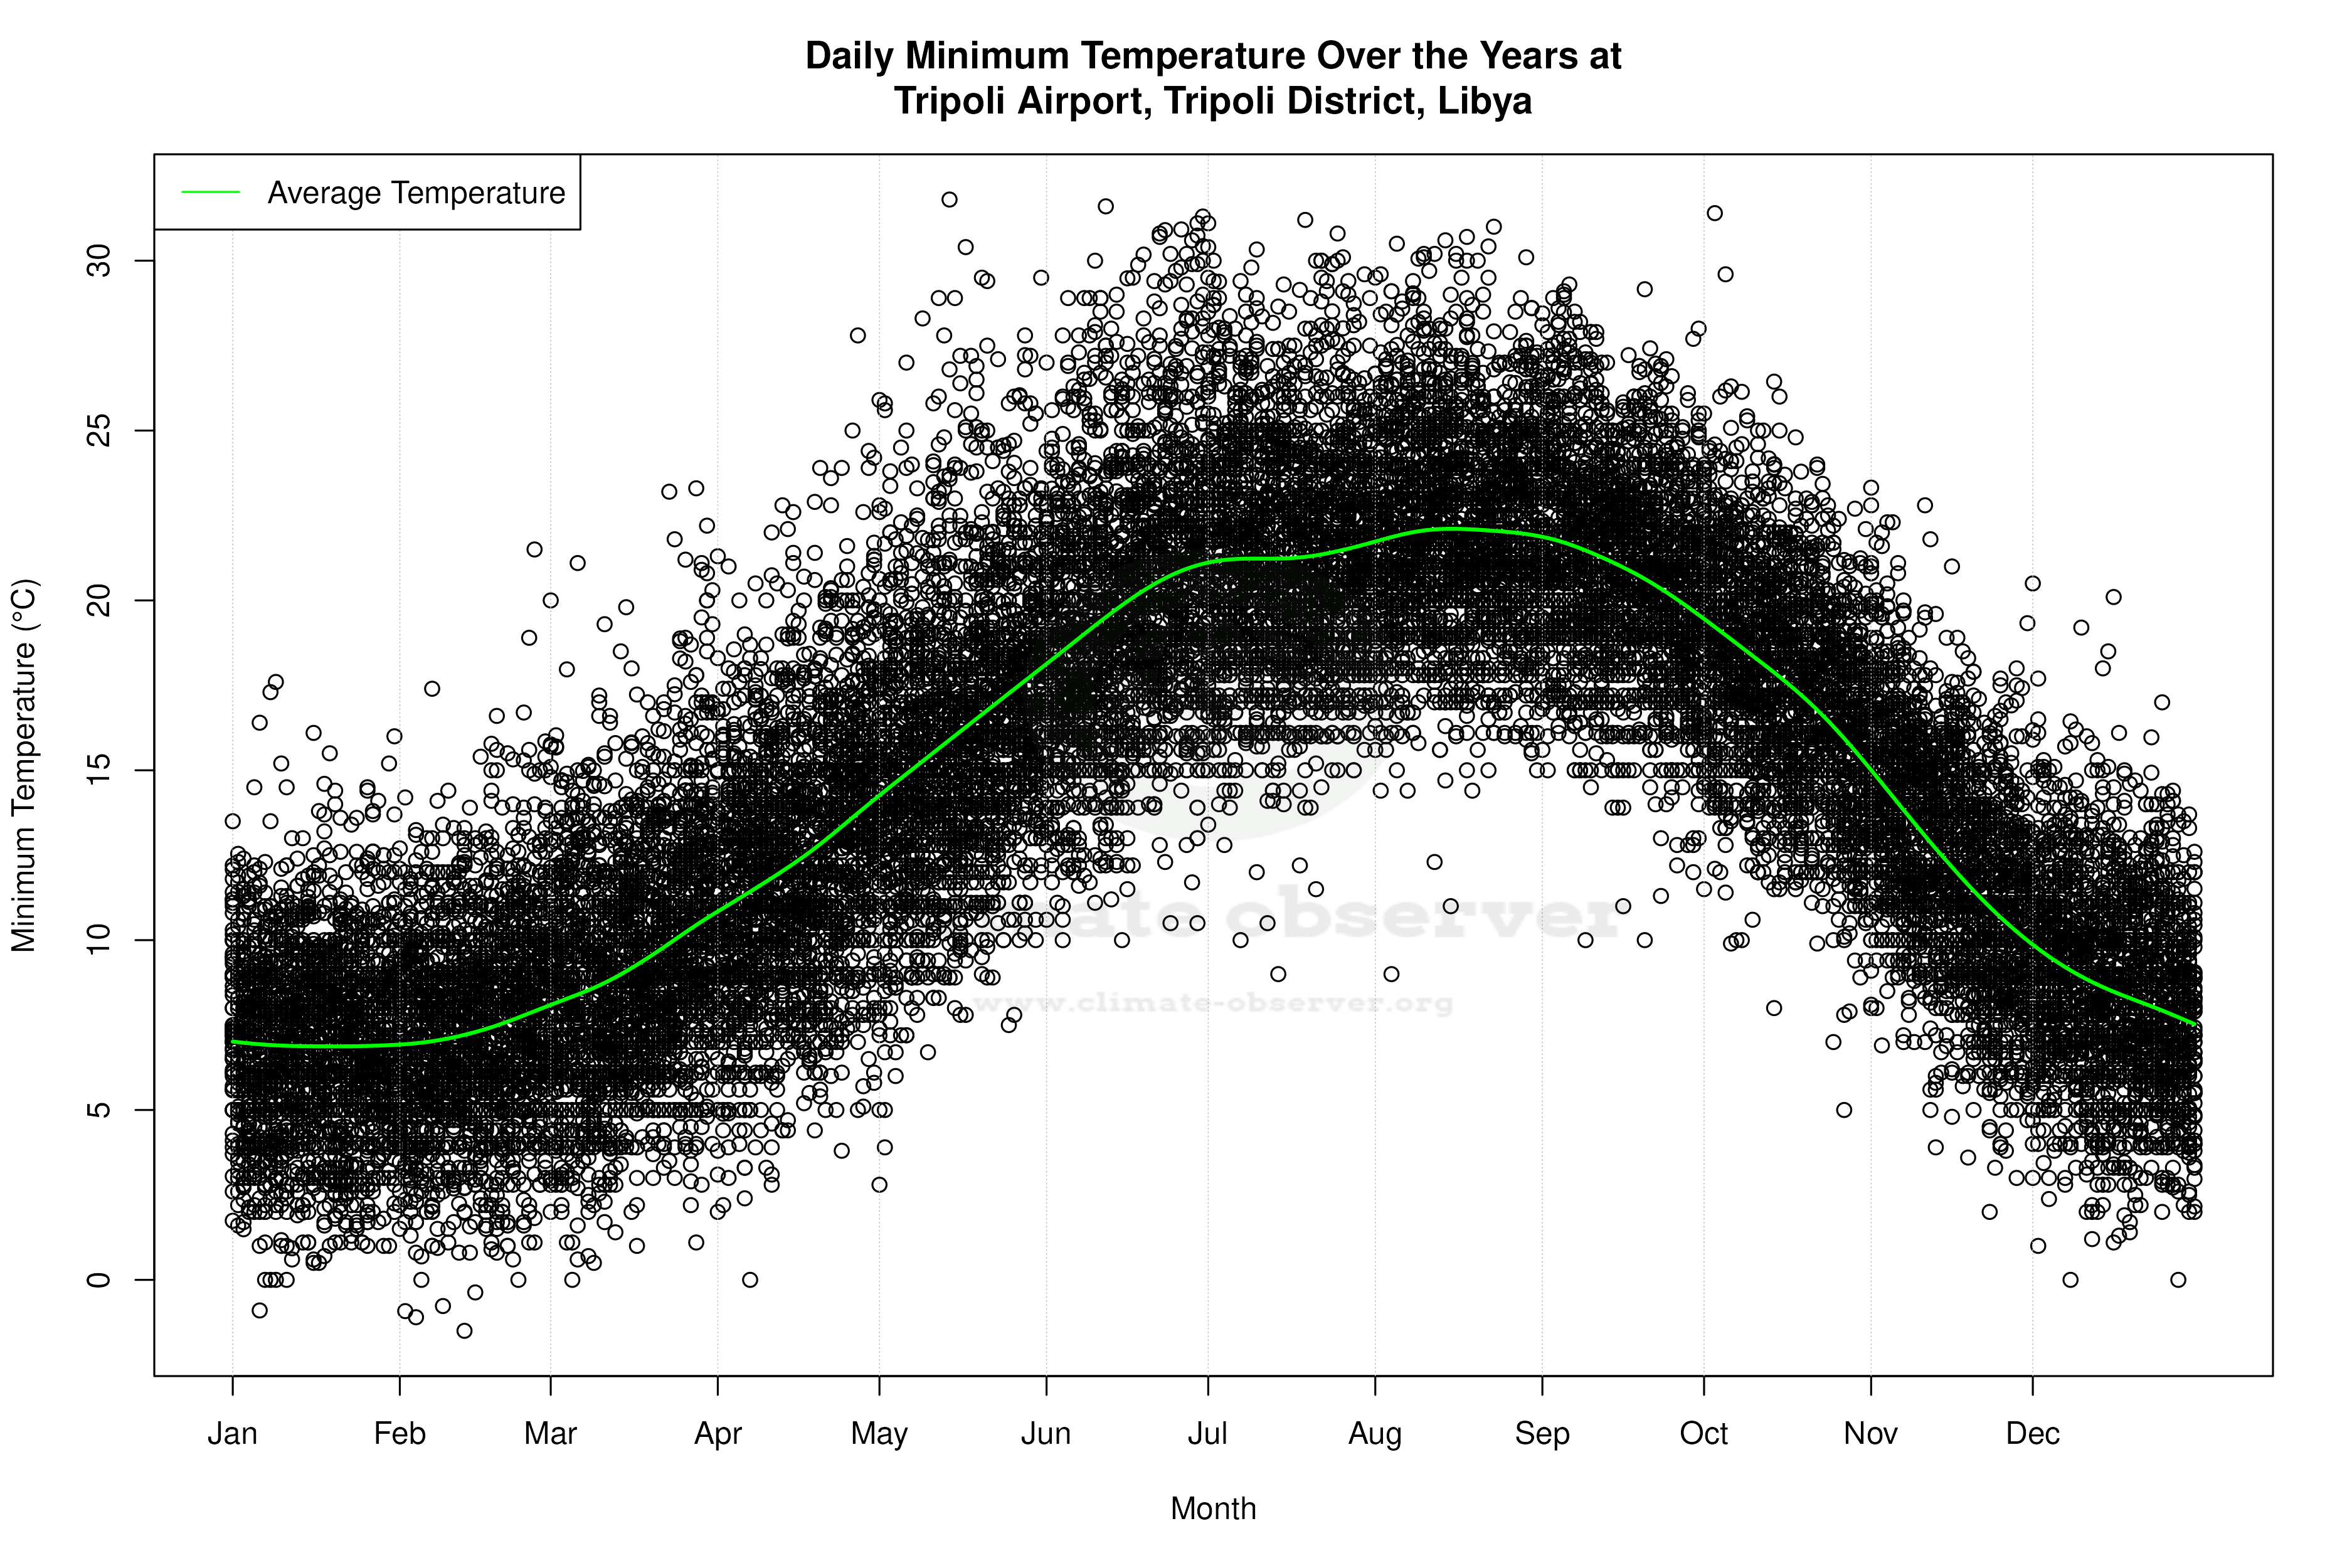
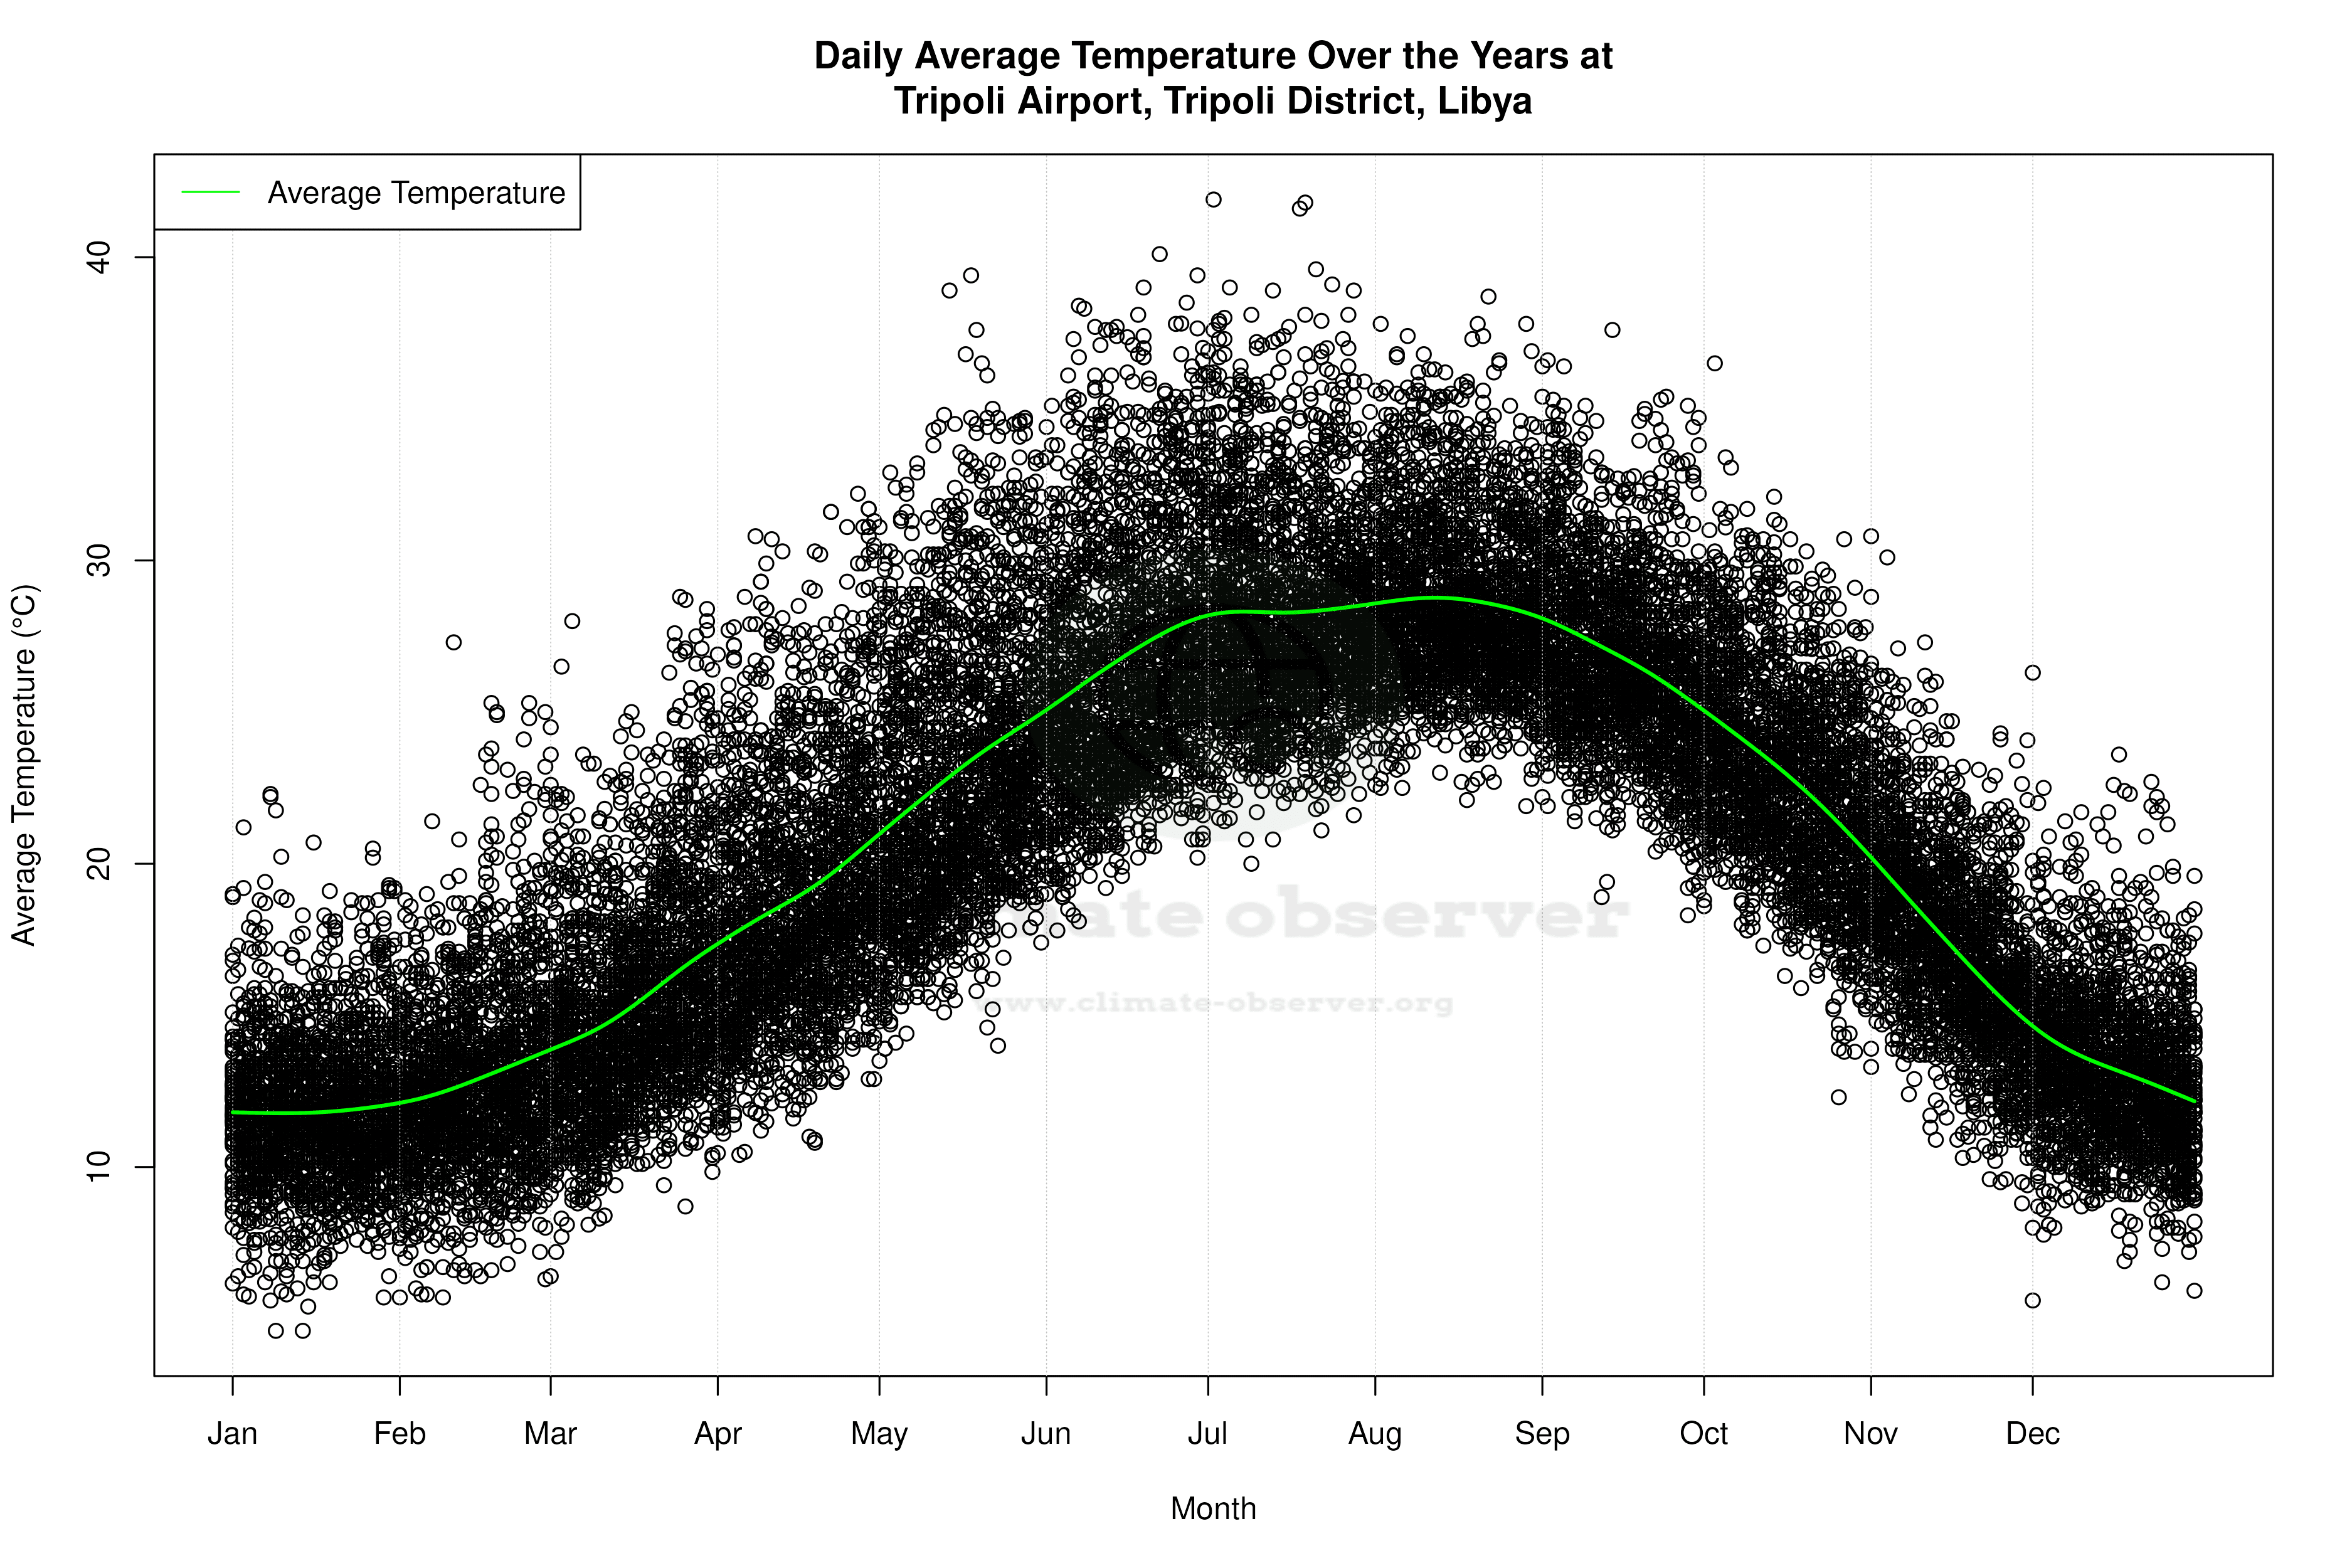

Average Max Temperature Throughout Year | 1 of 5
