Climate for Station: Misurata, Misrata District, Libya
Loading live weather...
Climate Analysis & Overview
Misurata, Libya experiences a complex climate story with a recent warming trend in low temperatures, contrasting with a long-term cooling in highs. Precipitation has become more evenly distributed, reflecting a shift in regional weather patterns.
Köppen Climate and Geographic Influence
Misurata, located along the Libyan coast, falls under the hot desert climate classification (BWh) according to the Köppen system. This classification is characterised by extremely hot summers and mild winters, with minimal precipitation. The Mediterranean Sea moderates temperatures slightly, but the region remains predominantly arid. The coastal position influences local weather patterns, contributing to the observed temperature trends and precipitation distribution.
Temperature Trends: A Tale of Two Scales
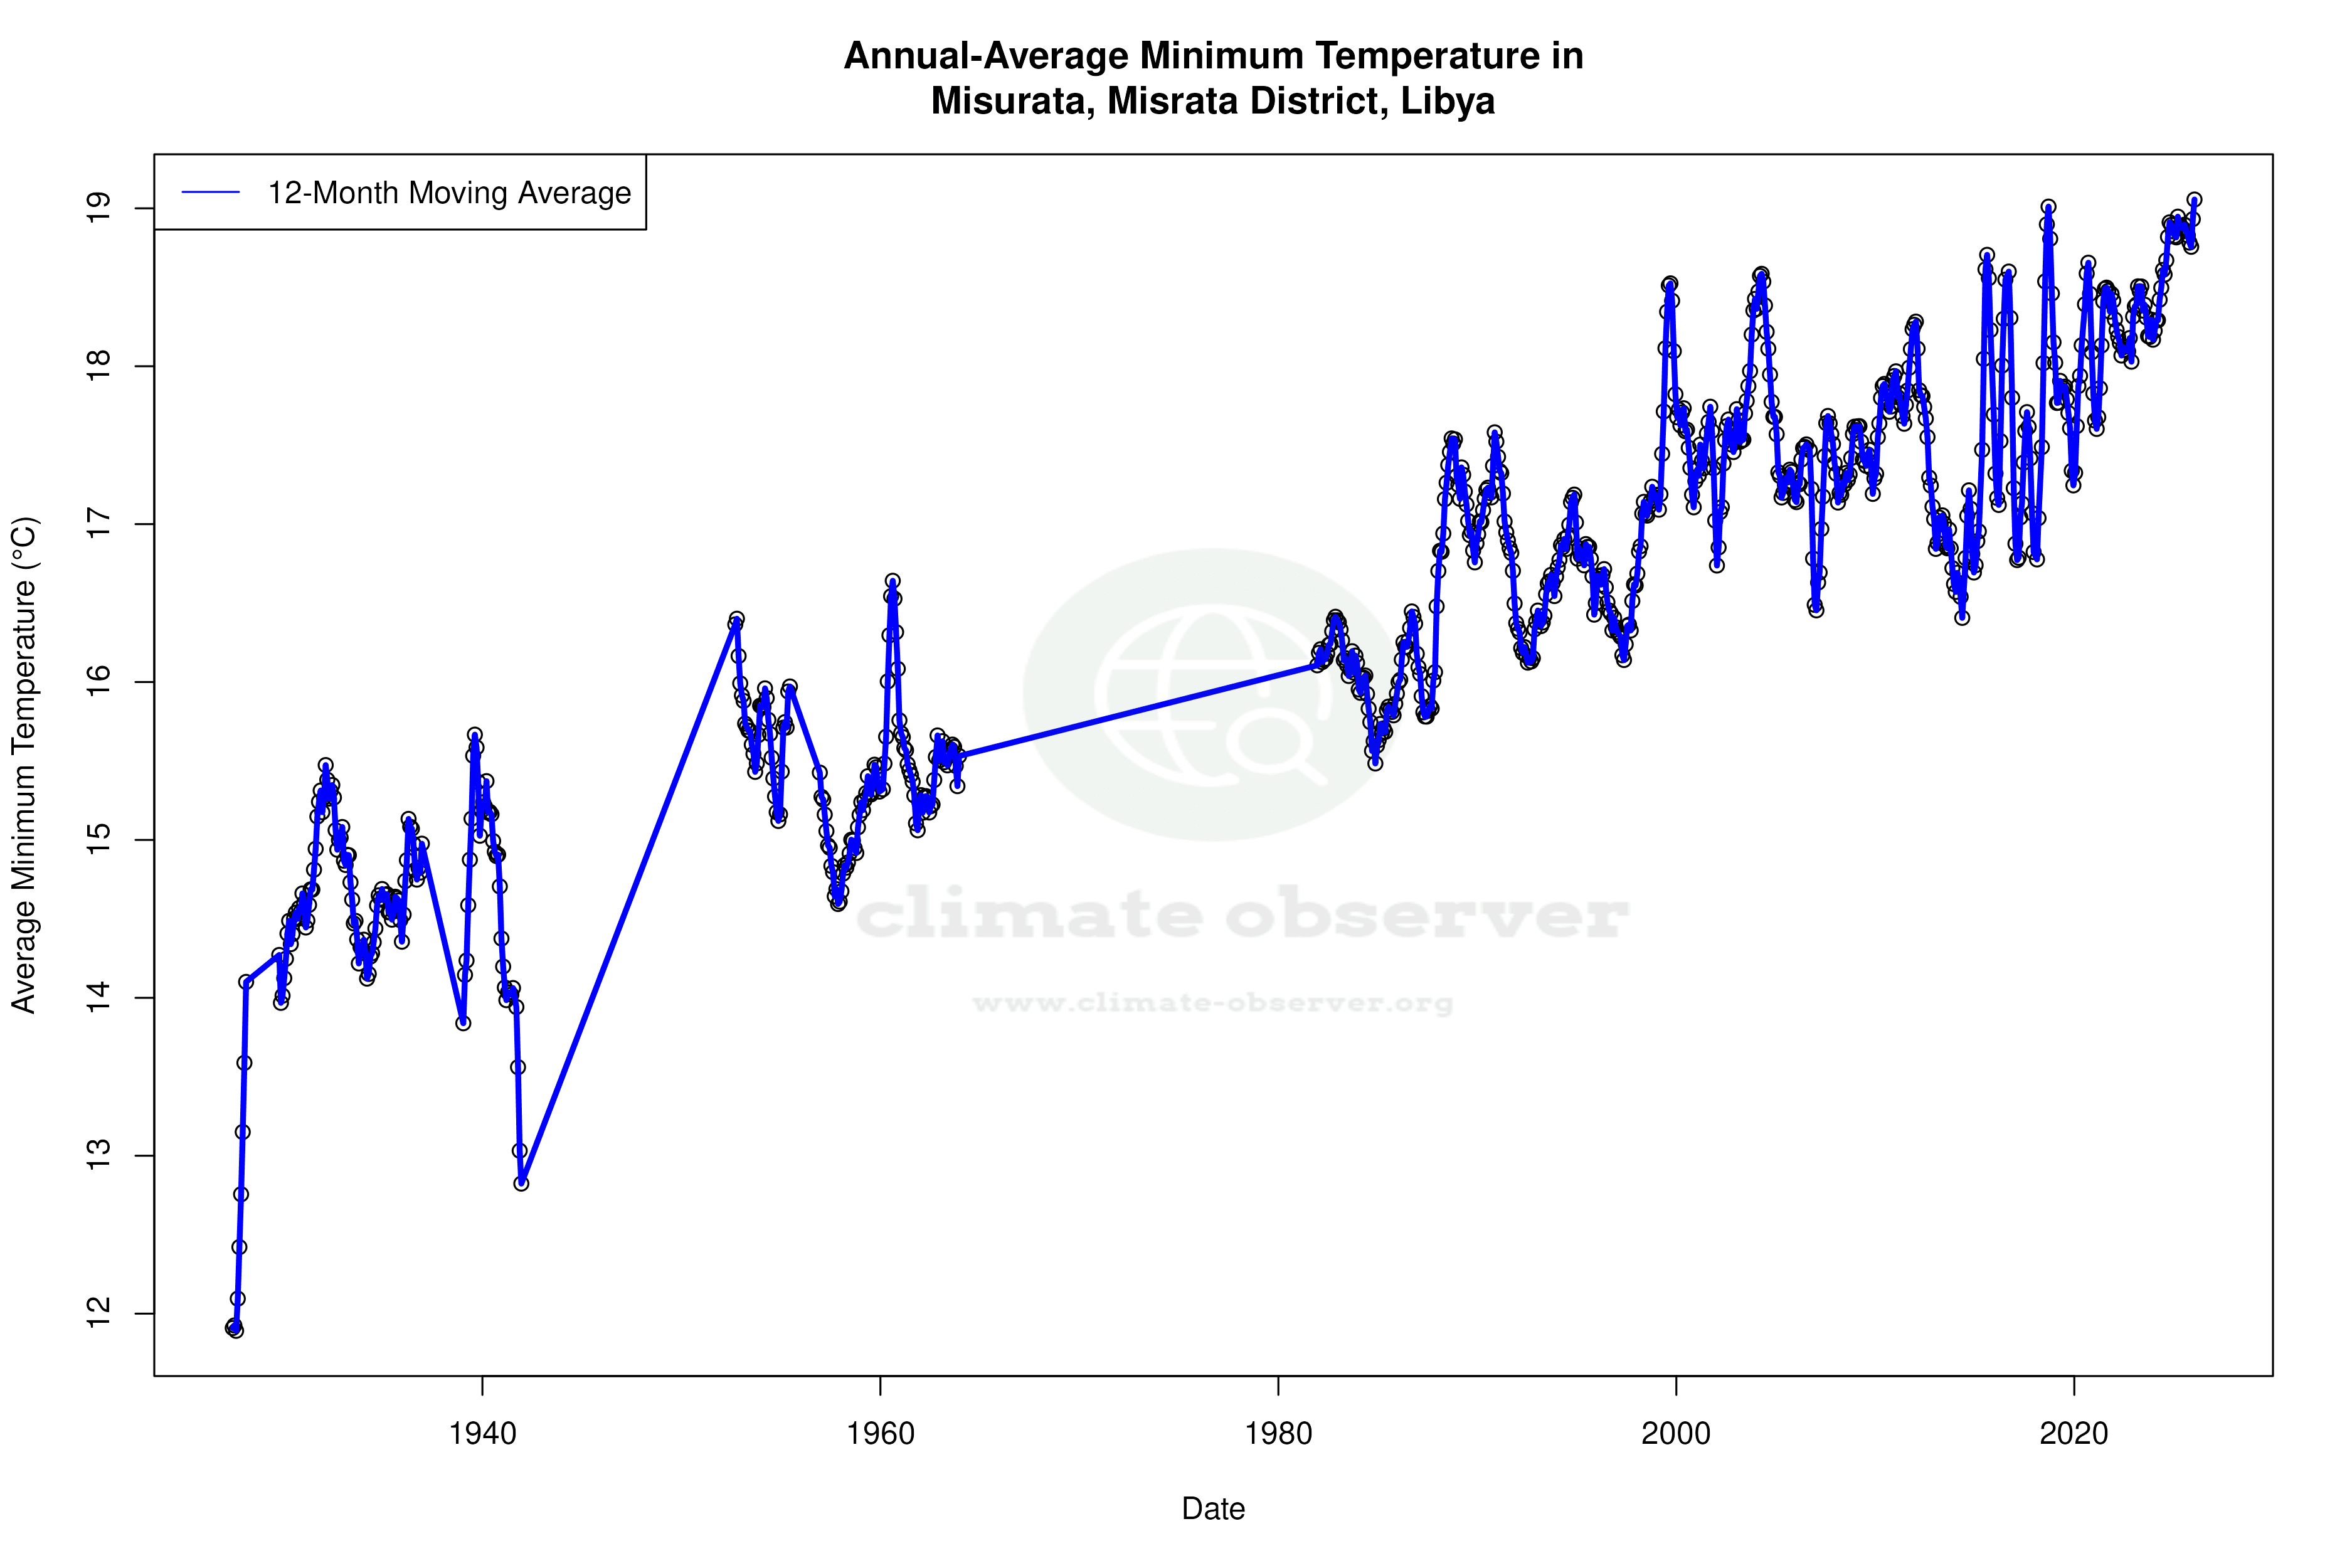
Over the past decade, Misurata has experienced a noticeable warming trend in low temperatures, with an increase of 1.44°C (2.59°F). This suggests that nights are becoming warmer, which could affect local agriculture and energy consumption patterns. In contrast, the all-time trend for lows shows a more modest warming of 0.41°C (0.74°F), indicating that recent years have seen an acceleration in warming.
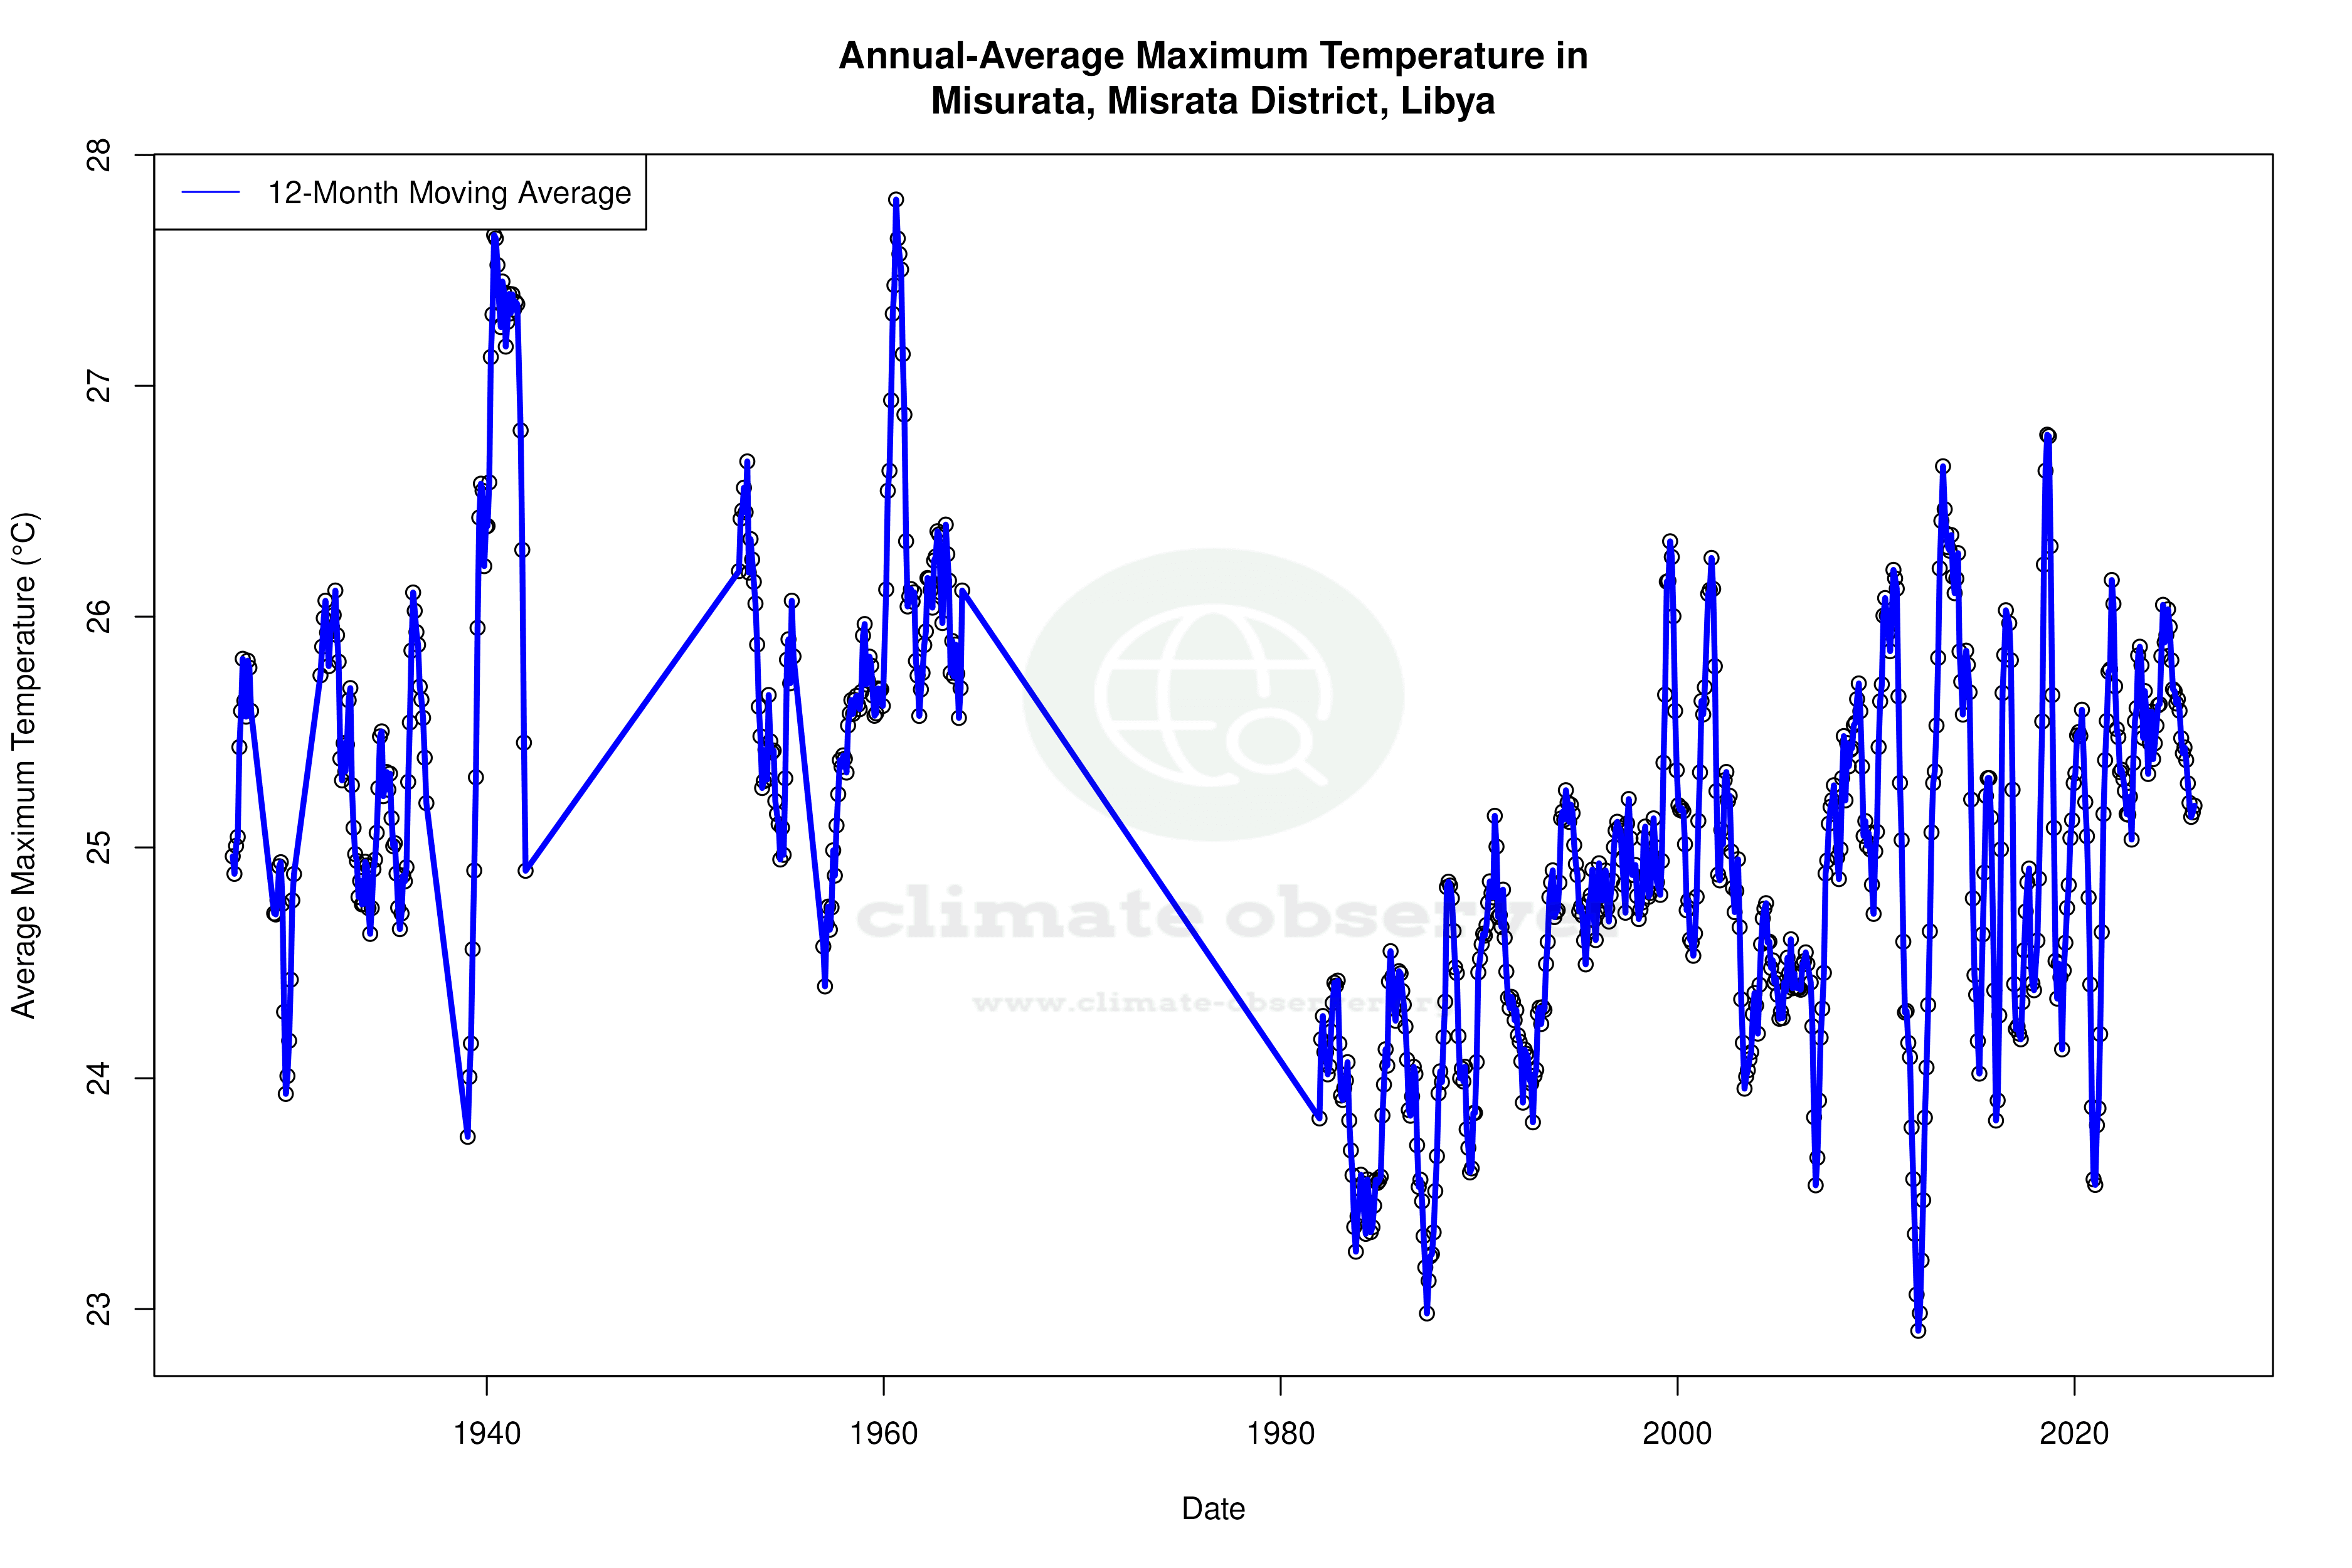
Conversely, high temperatures have shown a cooling trend over the long term, with a decrease of 0.08°C (0.14°F). However, the past decade has seen a reversal, with highs increasing by 0.87°C (1.57°F). This divergence between short-term and long-term trends highlights the complexity of climate dynamics in the region.
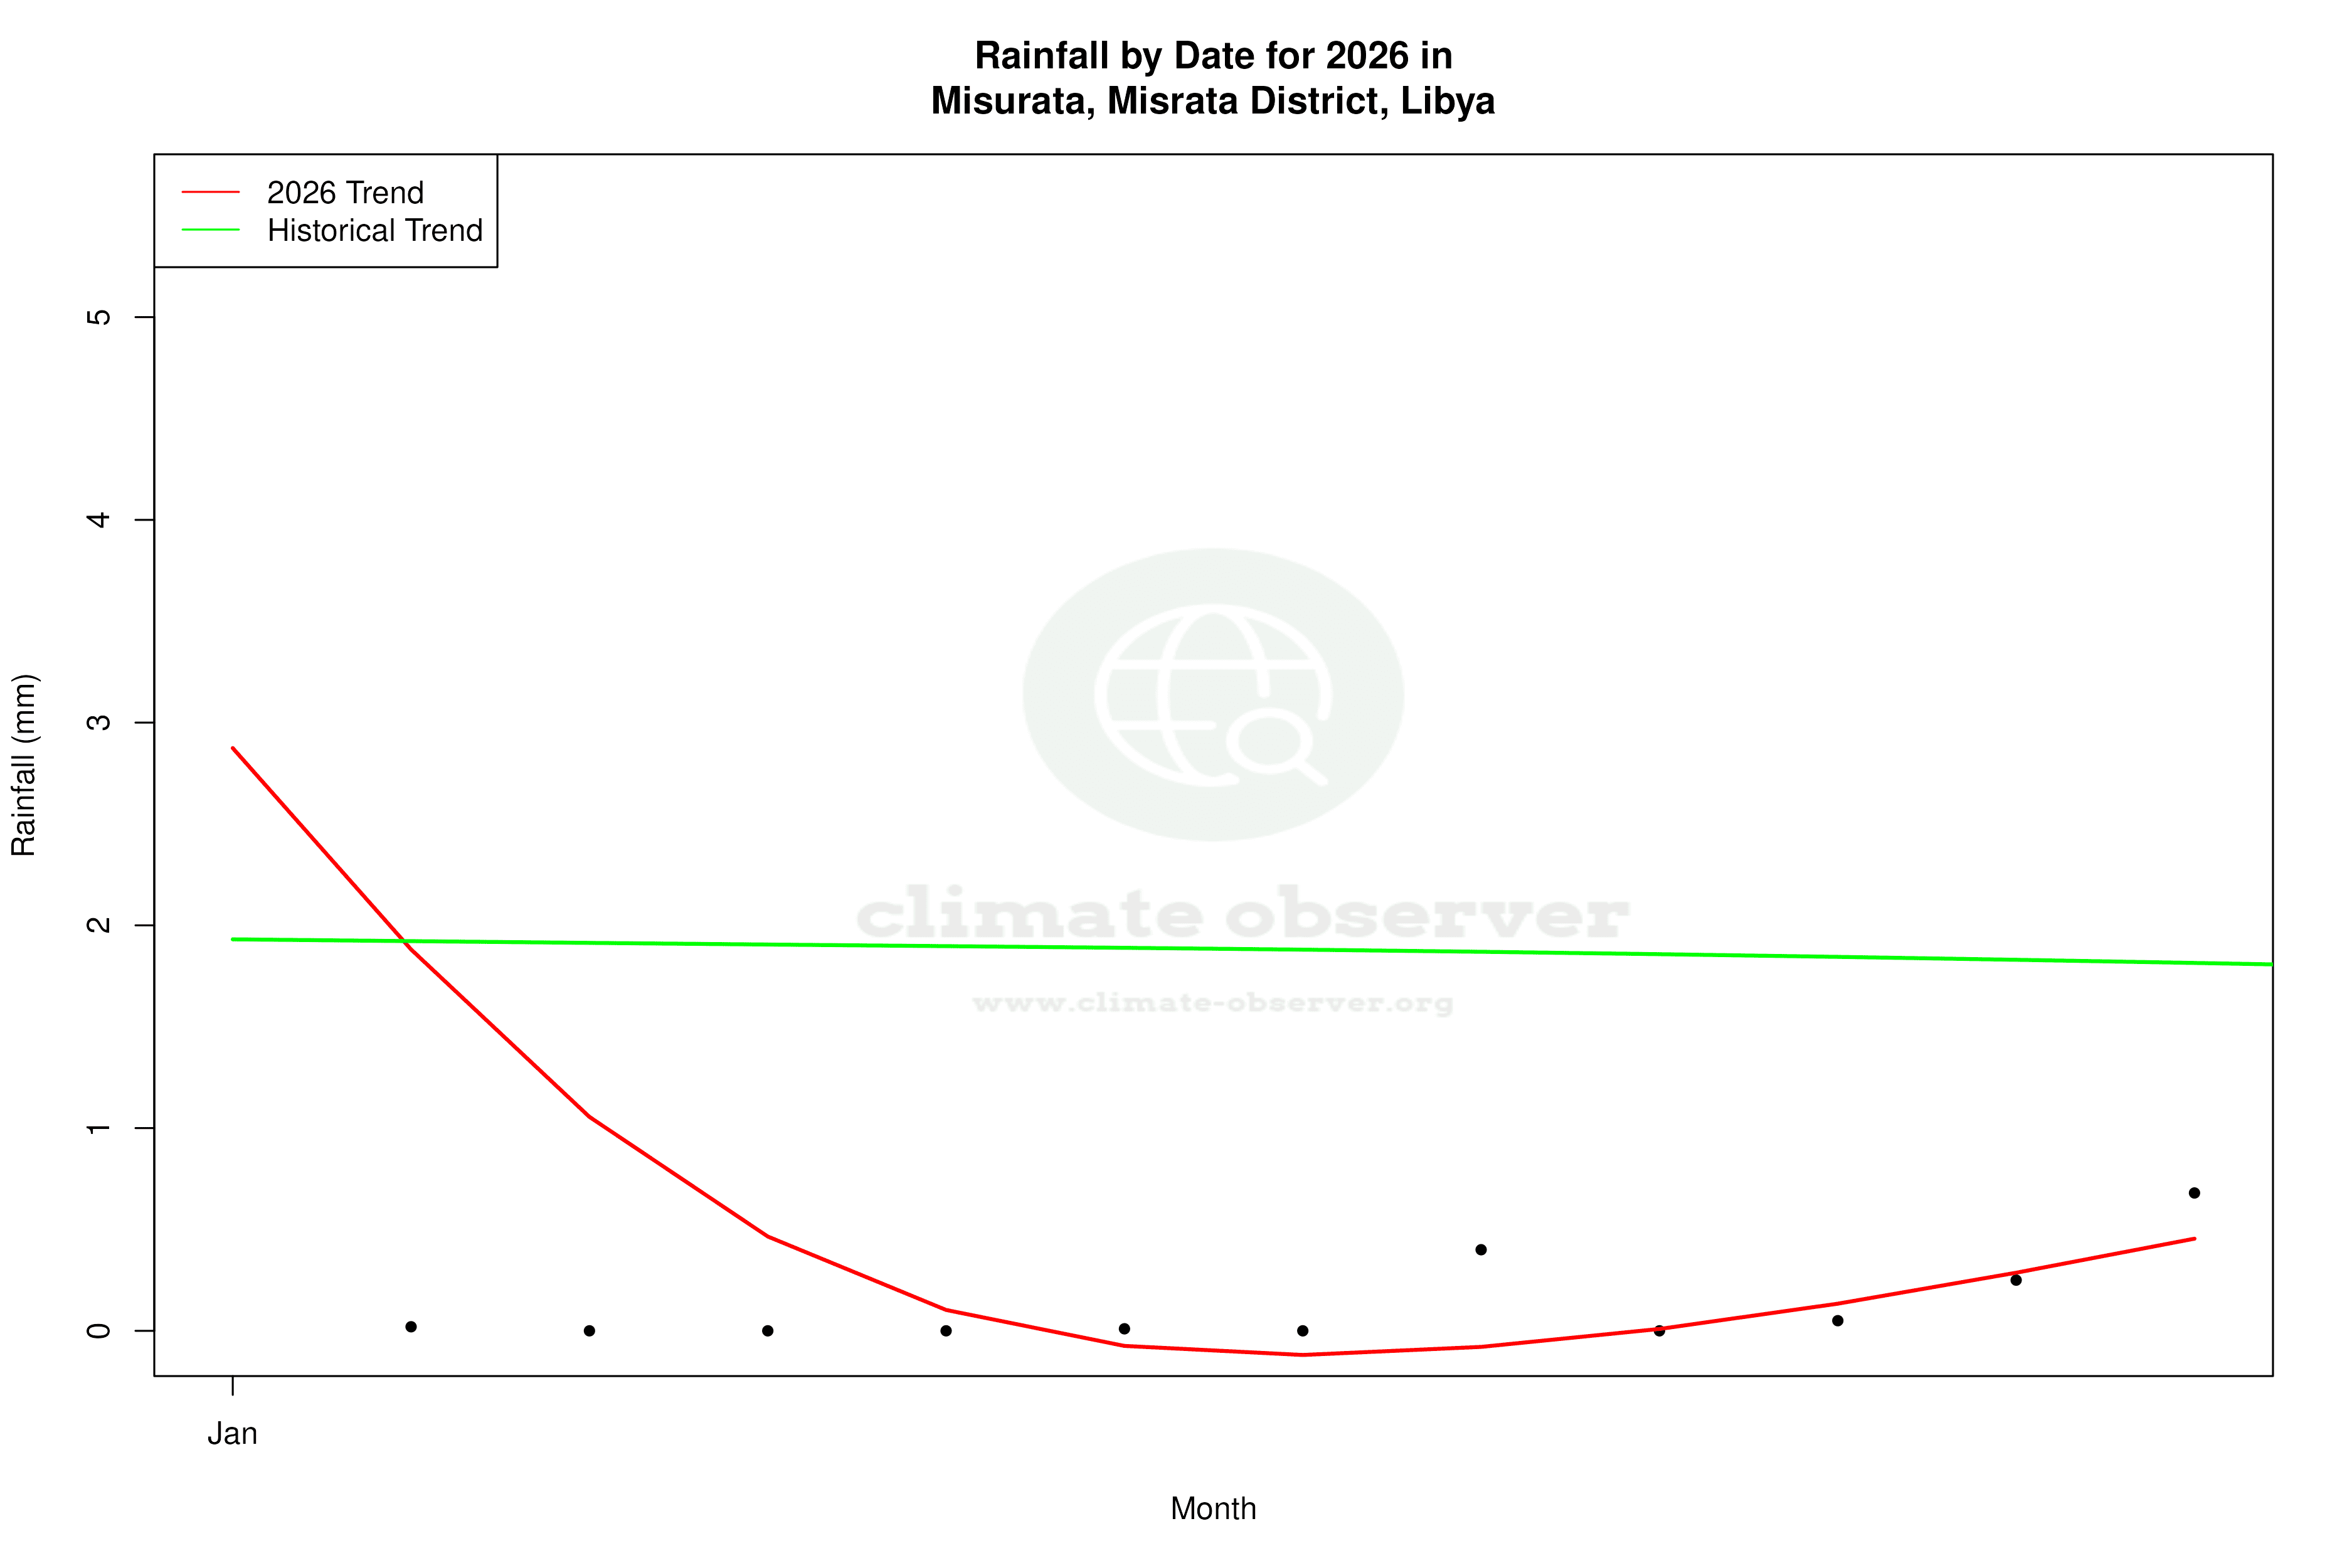
Precipitation Patterns: A Shift Towards Evenness
The Precipitation Concentration Index (PCI) for Misurata has decreased from a baseline of 21.4 to a current value of 17.8. This indicates that precipitation events are becoming more evenly distributed throughout the year, rather than being concentrated in a few intense events. This shift could have significant implications for water resource management and agricultural planning in the region, as more consistent rainfall can support more stable crop yields.
Record Extremes: The Boundaries of Misurata's Climate
Misurata's climate extremes are marked by a record high of 51.2°C (124.2°F) and a record low of -1.1°C (30.0°F). These records underscore the wide temperature range experienced in this desert climate, with potential impacts on human health and infrastructure. The extreme heat poses challenges for energy demand and public health, particularly during the peak summer months.
Regional Climate Context and Implications
Libya's regional climate goals focus on adapting to changing weather patterns and mitigating the impacts of climate change. The observed trends in Misurata, particularly the warming of low temperatures and more evenly distributed precipitation, align with broader regional efforts to understand and adapt to climate variability. Recent weather events, such as unseasonal rainfall or heatwaves, further emphasise the need for robust climate adaptation strategies in the region.
Station Statistics
10-Year Trend
High: +0.88 °C/decade
Low: +1.47 °C/decade
Rain: -0.33 mm/decade
25-Year Trend
High: +0.20 °C/decade
Low: +0.37 °C/decade
Rain: +0.03 mm/decade
50-Year Trend
High: +0.33 °C/decade
Low: +0.50 °C/decade
Rain: +0.01 mm/decade
All-Time Trend
High: -0.08 °C/decade
Low: +0.41 °C/decade
Rain: +0.01 mm/decade
Percentage Above-Average Days
Last 12 Months: 50.7%
This Year: 73.7%
Precipitation Concentration Index (PCI) ℹ️
Last 12 Months: 21.6
Historical Average: 23.2
Percentile Rank of Last 12 Months ℹ️
High: 65th percentile
Low: 99th percentile
Rain: 67th percentile
Change in Variance ℹ️
High: -7.1%
Low: -6.7%
Intraday: -23.4%
Data Coverage
69.7%
First Year of Data
1949
Station Location
Historical Weather Records
| Max High | Avg High | Min High | Max Avg | Avg Avg | Min Avg | Max Low | Avg Low | Min Low | Max Precipitation | Avg Precipitation | Max Snow | Avg Snow | |
|---|---|---|---|---|---|---|---|---|---|---|---|---|---|
| Record | 51.2 °C | — | 8.5 °C | 38.3 °C | — | 6.4 °C | 32.0 °C | — | -1.1 °C | 89.8 mm | — | — | — |
| January | 32.2 °C | 17.8 °C | 8.5 °C | 22.8 °C | 14.0 °C | 6.4 °C | 19.0 °C | 9.8 °C | -1.1 °C | 51.6 mm | 1.8 mm | — | — |
| February | 36.2 °C | 18.6 °C | 8.9 °C | 25.2 °C | 14.3 °C | 6.9 °C | 19.3 °C | 9.9 °C | 0.2 °C | 37.4 mm | 1.1 mm | — | — |
| March | 38.9 °C | 20.7 °C | 9.4 °C | 28.8 °C | 16.0 °C | 8.2 °C | 22.9 °C | 11.5 °C | -0.1 °C | 41.3 mm | 0.6 mm | — | — |
| April | 45.2 °C | 23.1 °C | 14.3 °C | 31.1 °C | 18.3 °C | 11.8 °C | 24.4 °C | 13.9 °C | 1.2 °C | 21.8 mm | 0.3 mm | — | — |
| May | 44.9 °C | 26.1 °C | 17.3 °C | 35.9 °C | 21.3 °C | 14.4 °C | 27.0 °C | 16.8 °C | 8.2 °C | 55.3 mm | 0.2 mm | — | — |
| June | 51.2 °C | 29.4 °C | 20.0 °C | 38.3 °C | 24.6 °C | 18.4 °C | 31.8 °C | 20.0 °C | 10.0 °C | 13.1 mm | 0.1 mm | — | — |
| July | 46.8 °C | 31.2 °C | 24.0 °C | 36.5 °C | 26.7 °C | 21.5 °C | 32.0 °C | 22.4 °C | 13.0 °C | 3.3 mm | 0.0 mm | — | — |
| August | 46.1 °C | 31.9 °C | 22.1 °C | 35.1 °C | 27.6 °C | 19.8 °C | 28.5 °C | 23.3 °C | 14.9 °C | 12.4 mm | 0.1 mm | — | — |
| September | 47.6 °C | 30.9 °C | 20.4 °C | 35.0 °C | 26.5 °C | 19.6 °C | 29.8 °C | 22.4 °C | 11.8 °C | 89.8 mm | 0.5 mm | — | — |
| October | 41.2 °C | 28.0 °C | 18.8 °C | 32.0 °C | 23.6 °C | 15.2 °C | 27.1 °C | 19.5 °C | 6.8 °C | 59.9 mm | 1.1 mm | — | — |
| November | 36.4 °C | 23.8 °C | 14.1 °C | 29.3 °C | 19.4 °C | 11.3 °C | 23.5 °C | 15.1 °C | 1.0 °C | 71.9 mm | 1.2 mm | — | — |
| December | 32.2 °C | 19.3 °C | 8.9 °C | 24.3 °C | 15.4 °C | 7.3 °C | 21.5 °C | 11.4 °C | 2.0 °C | 59.9 mm | 1.8 mm | — | — |
Data Visualisations
Remove WatermarksCurrent Year Climate Trends vs Historical


Max Temperature this Year | 1 of 6
Climate 12-Month Moving Averages


Max Temperature 12-Month MA | 1 of 6
Daily Data Points and Averages Throughout the Year

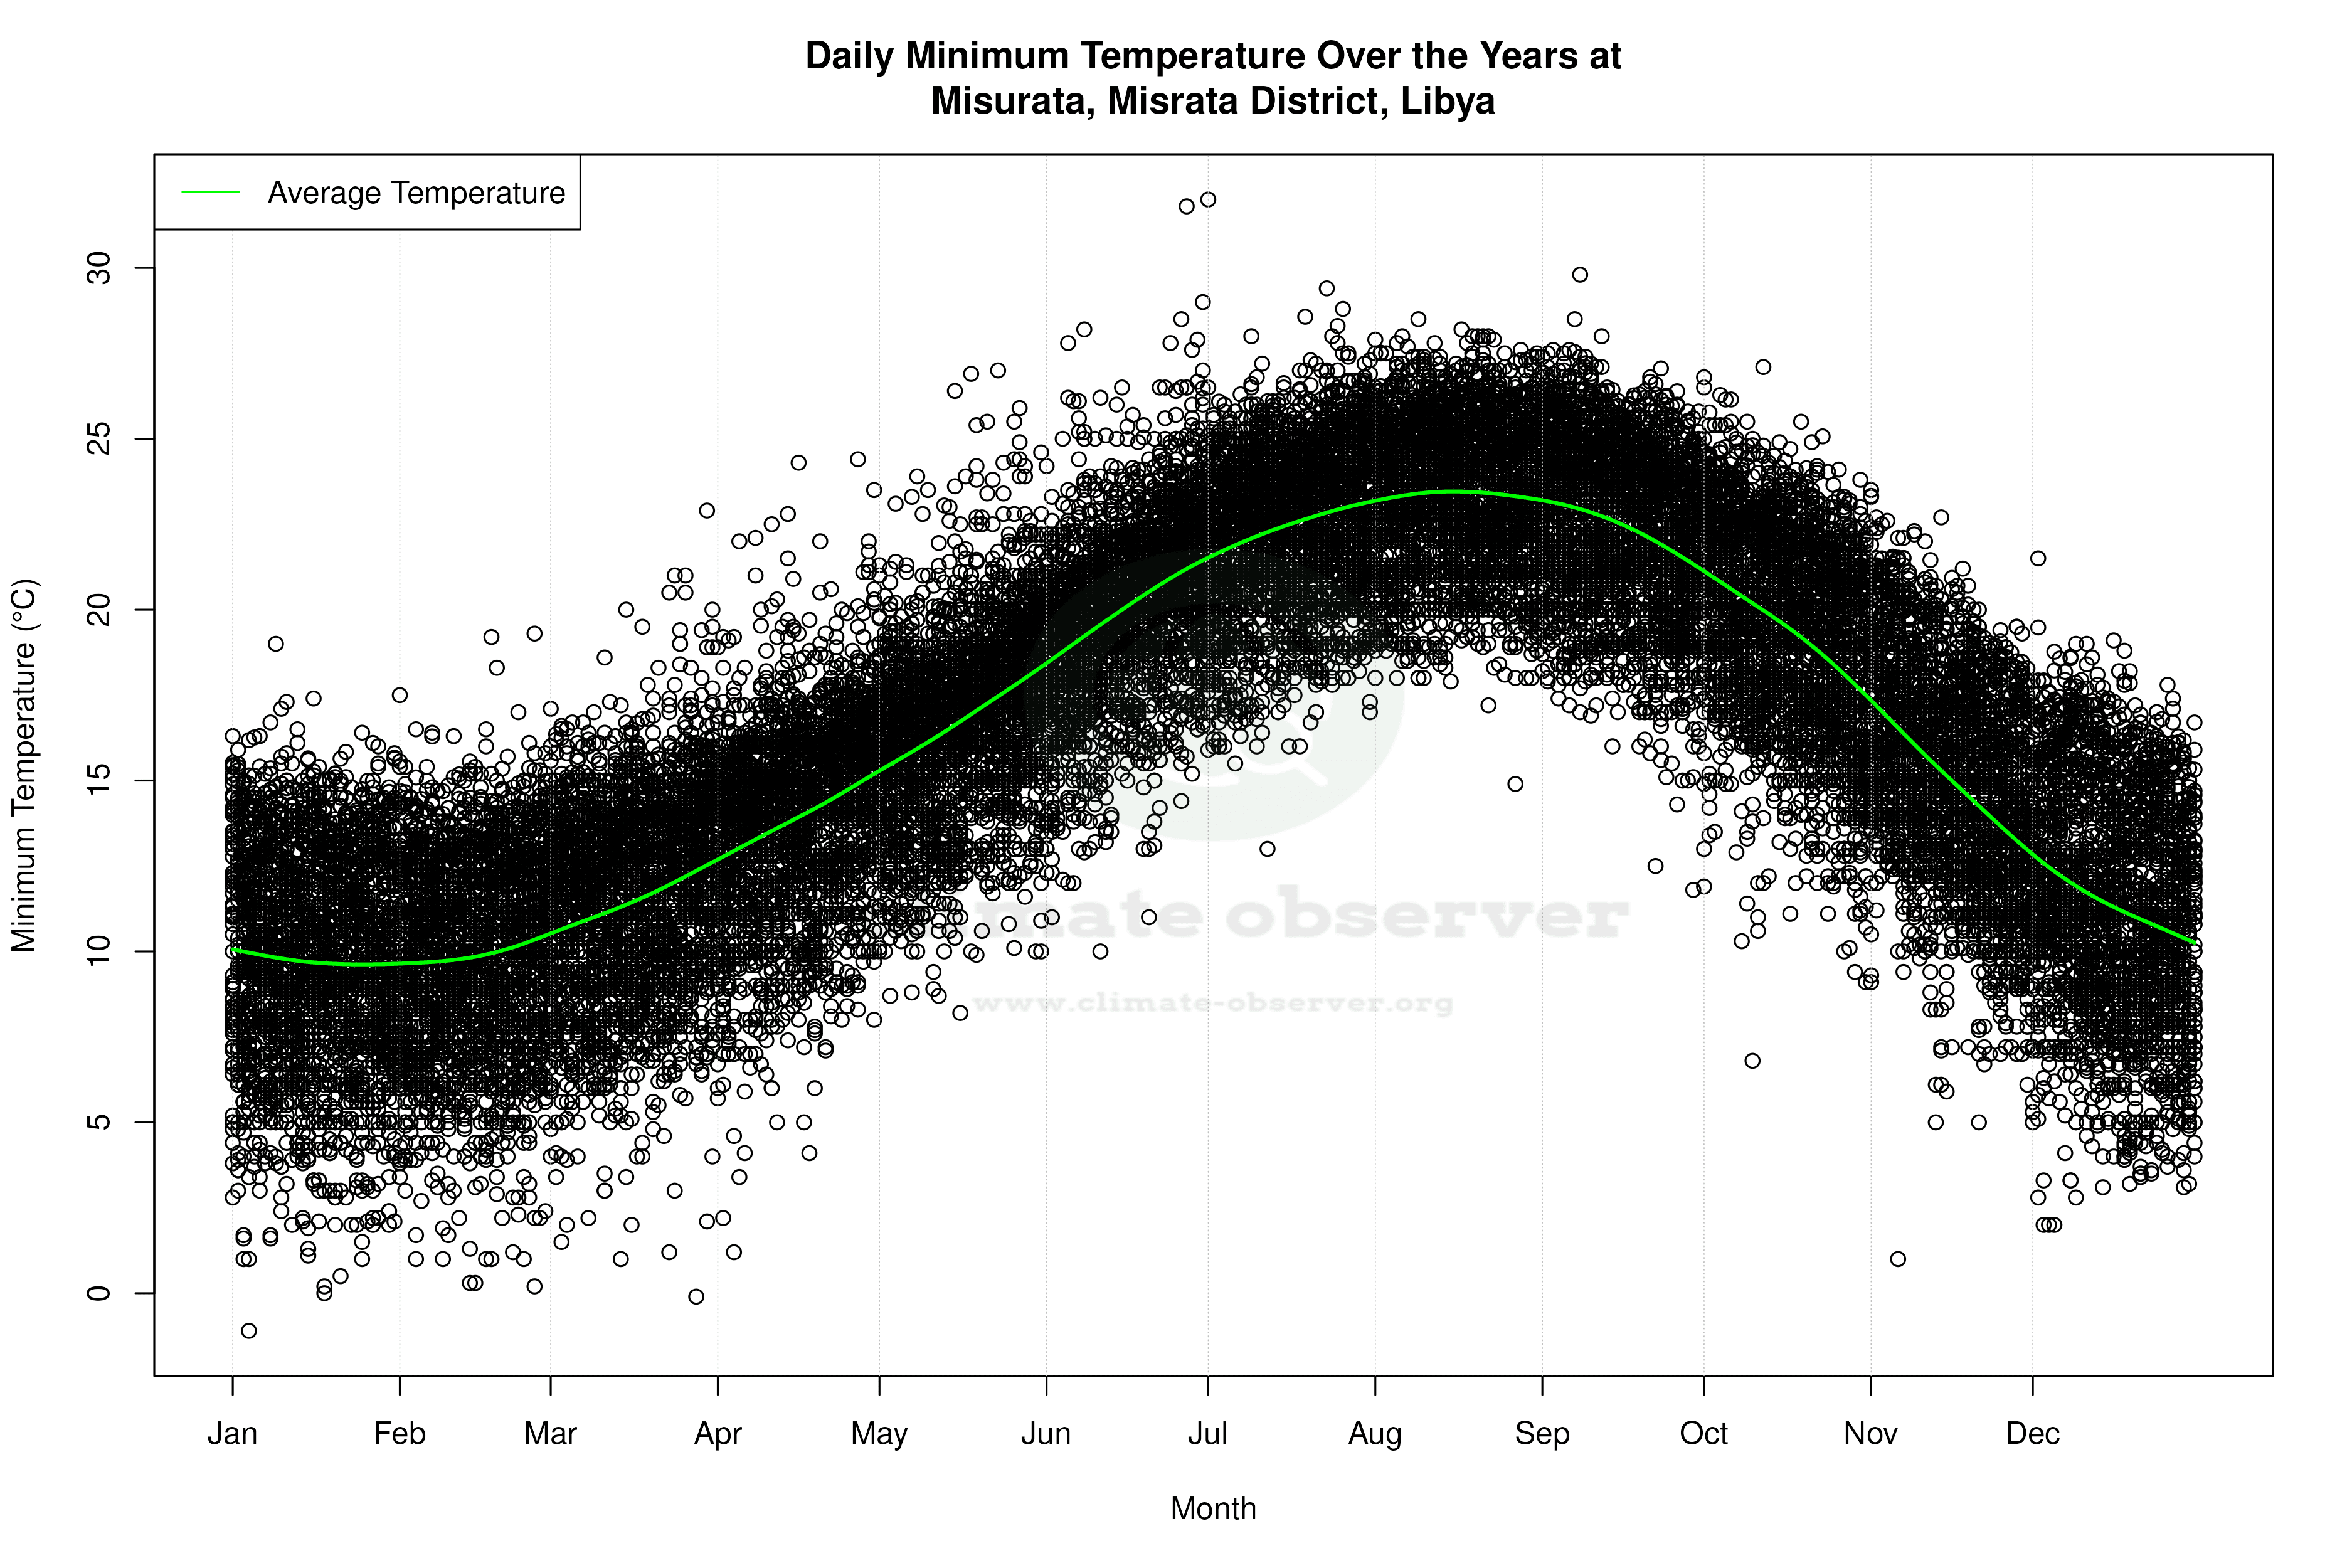
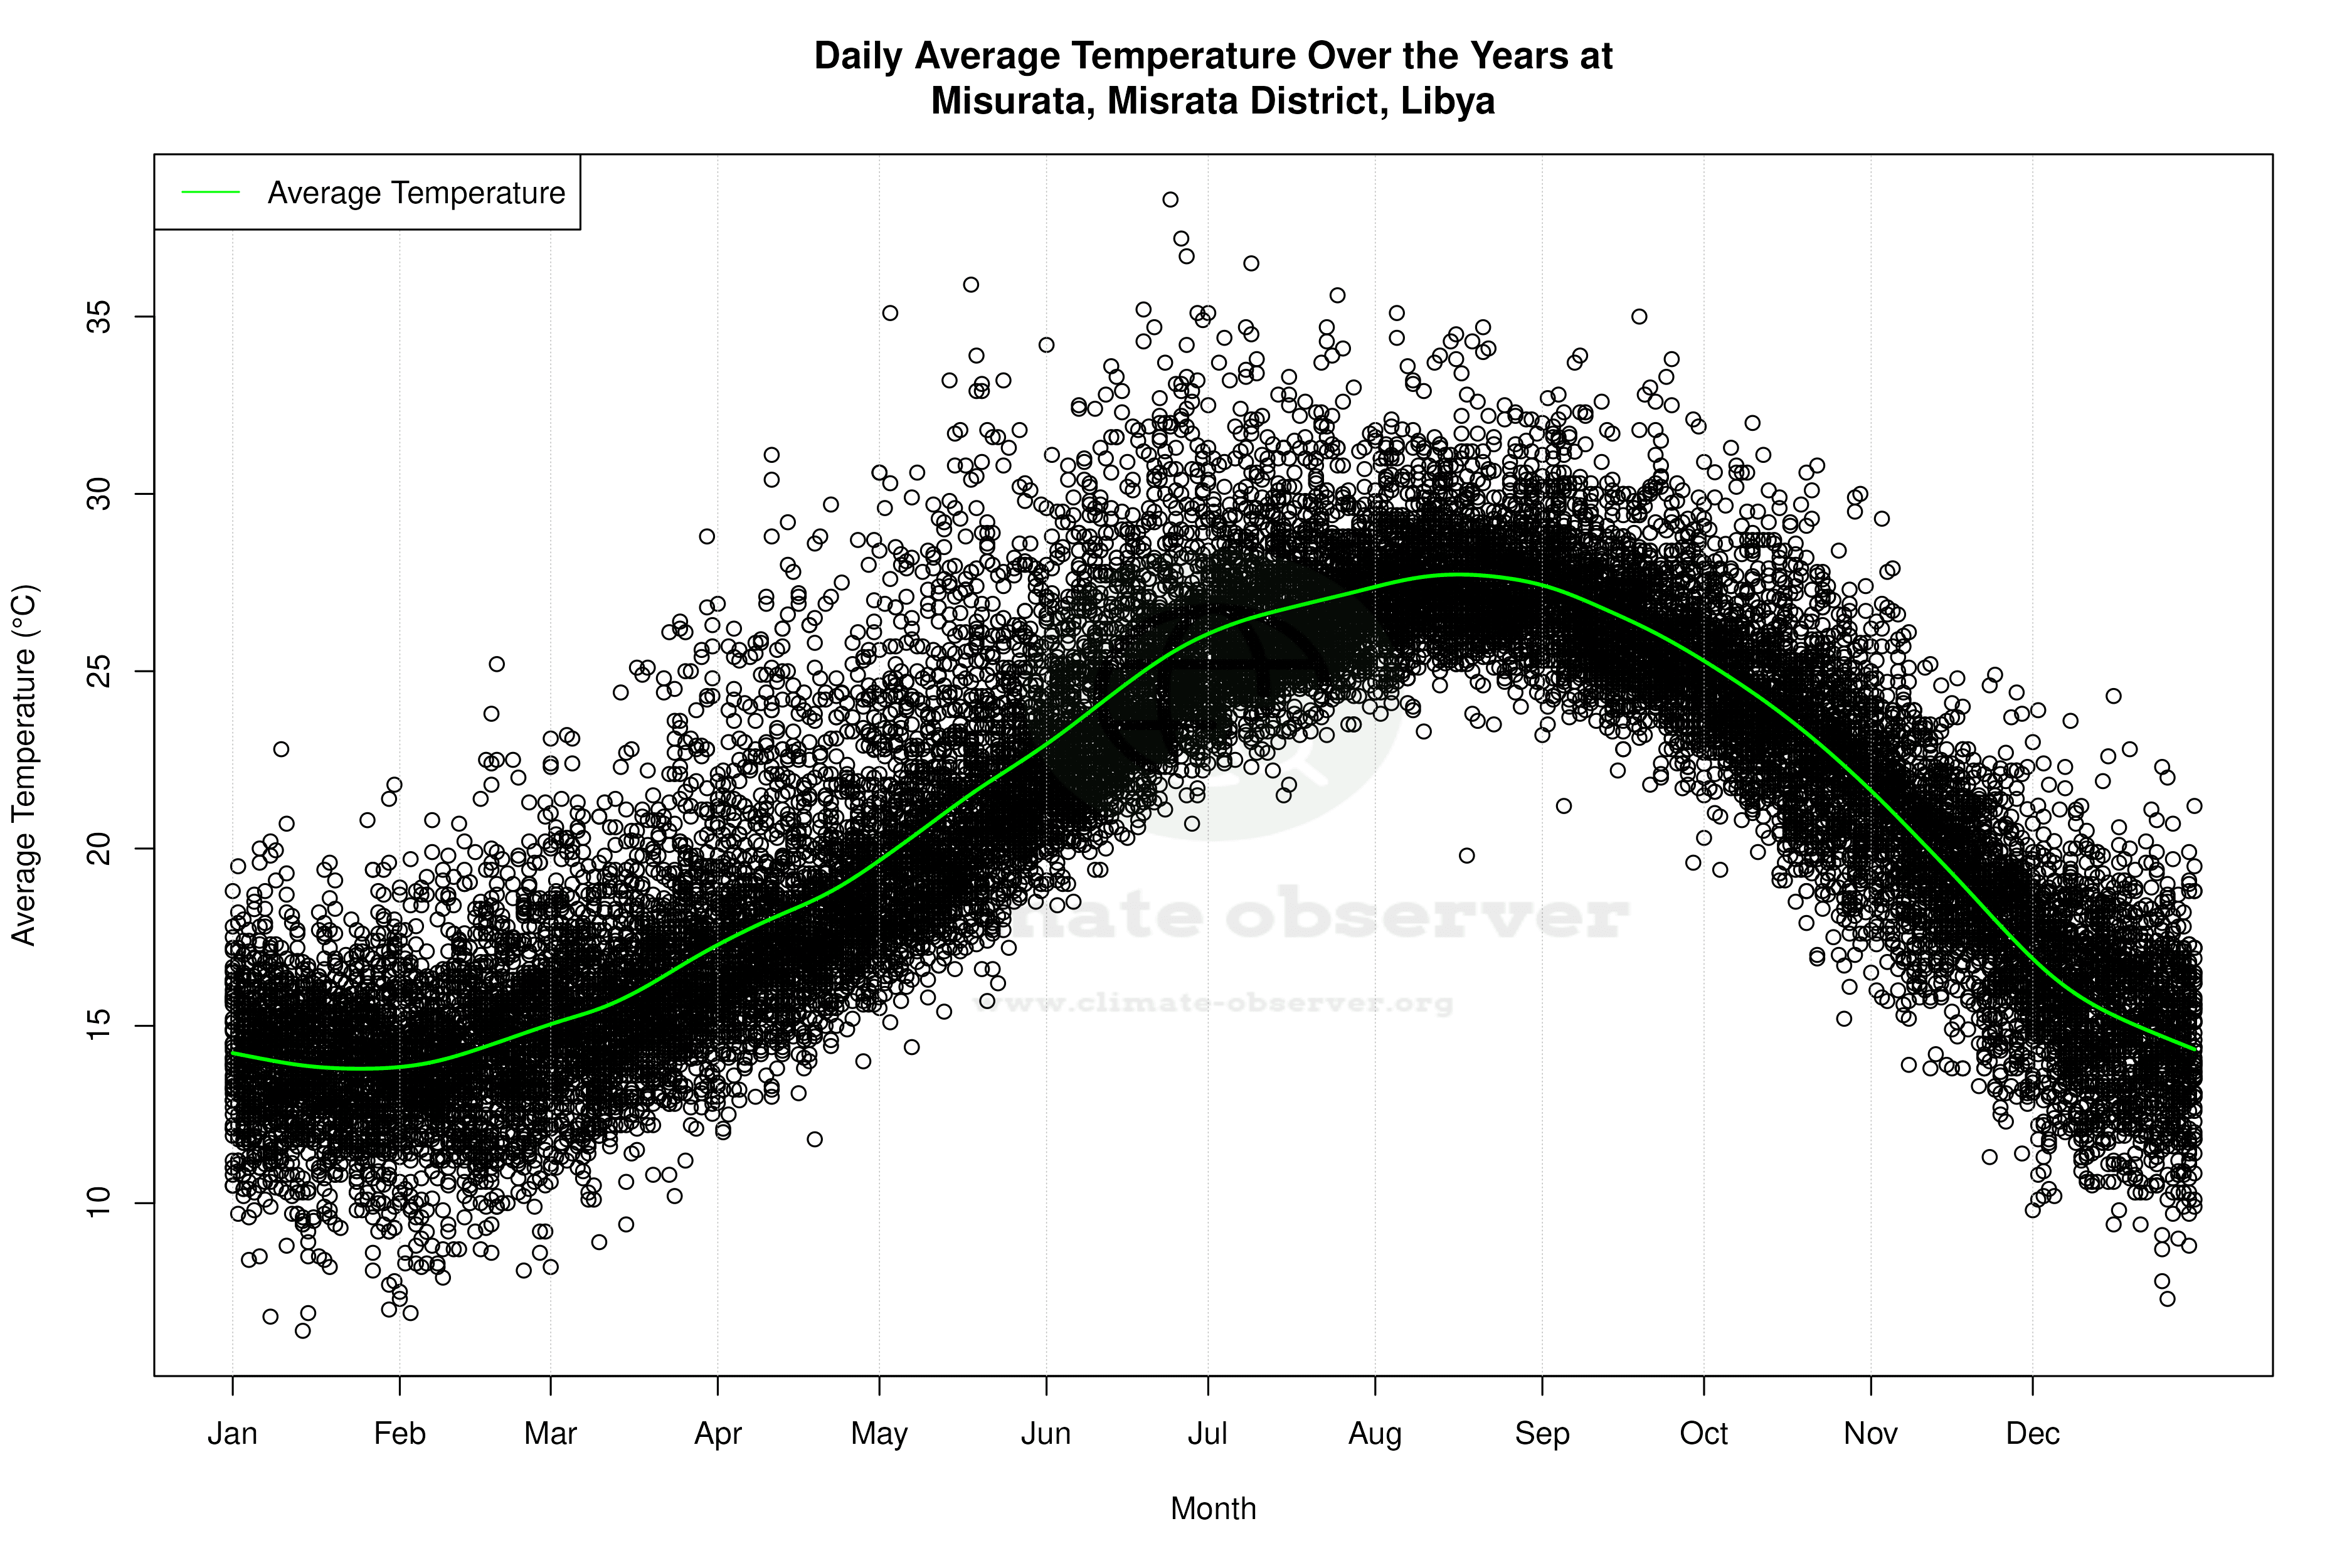


Average Max Temperature Throughout Year | 1 of 5
