Climate for Station: Sirte, Sirte District, Libya
Loading live weather...
Climate Analysis & Overview
Sirte's climate is experiencing a notable warming trend, particularly in nighttime temperatures, with a significant shift towards more evenly distributed precipitation. This aligns with Libya's broader climate adaptation goals, emphasizing the need for sustainable water management in the region.
Desert Climate Dynamics
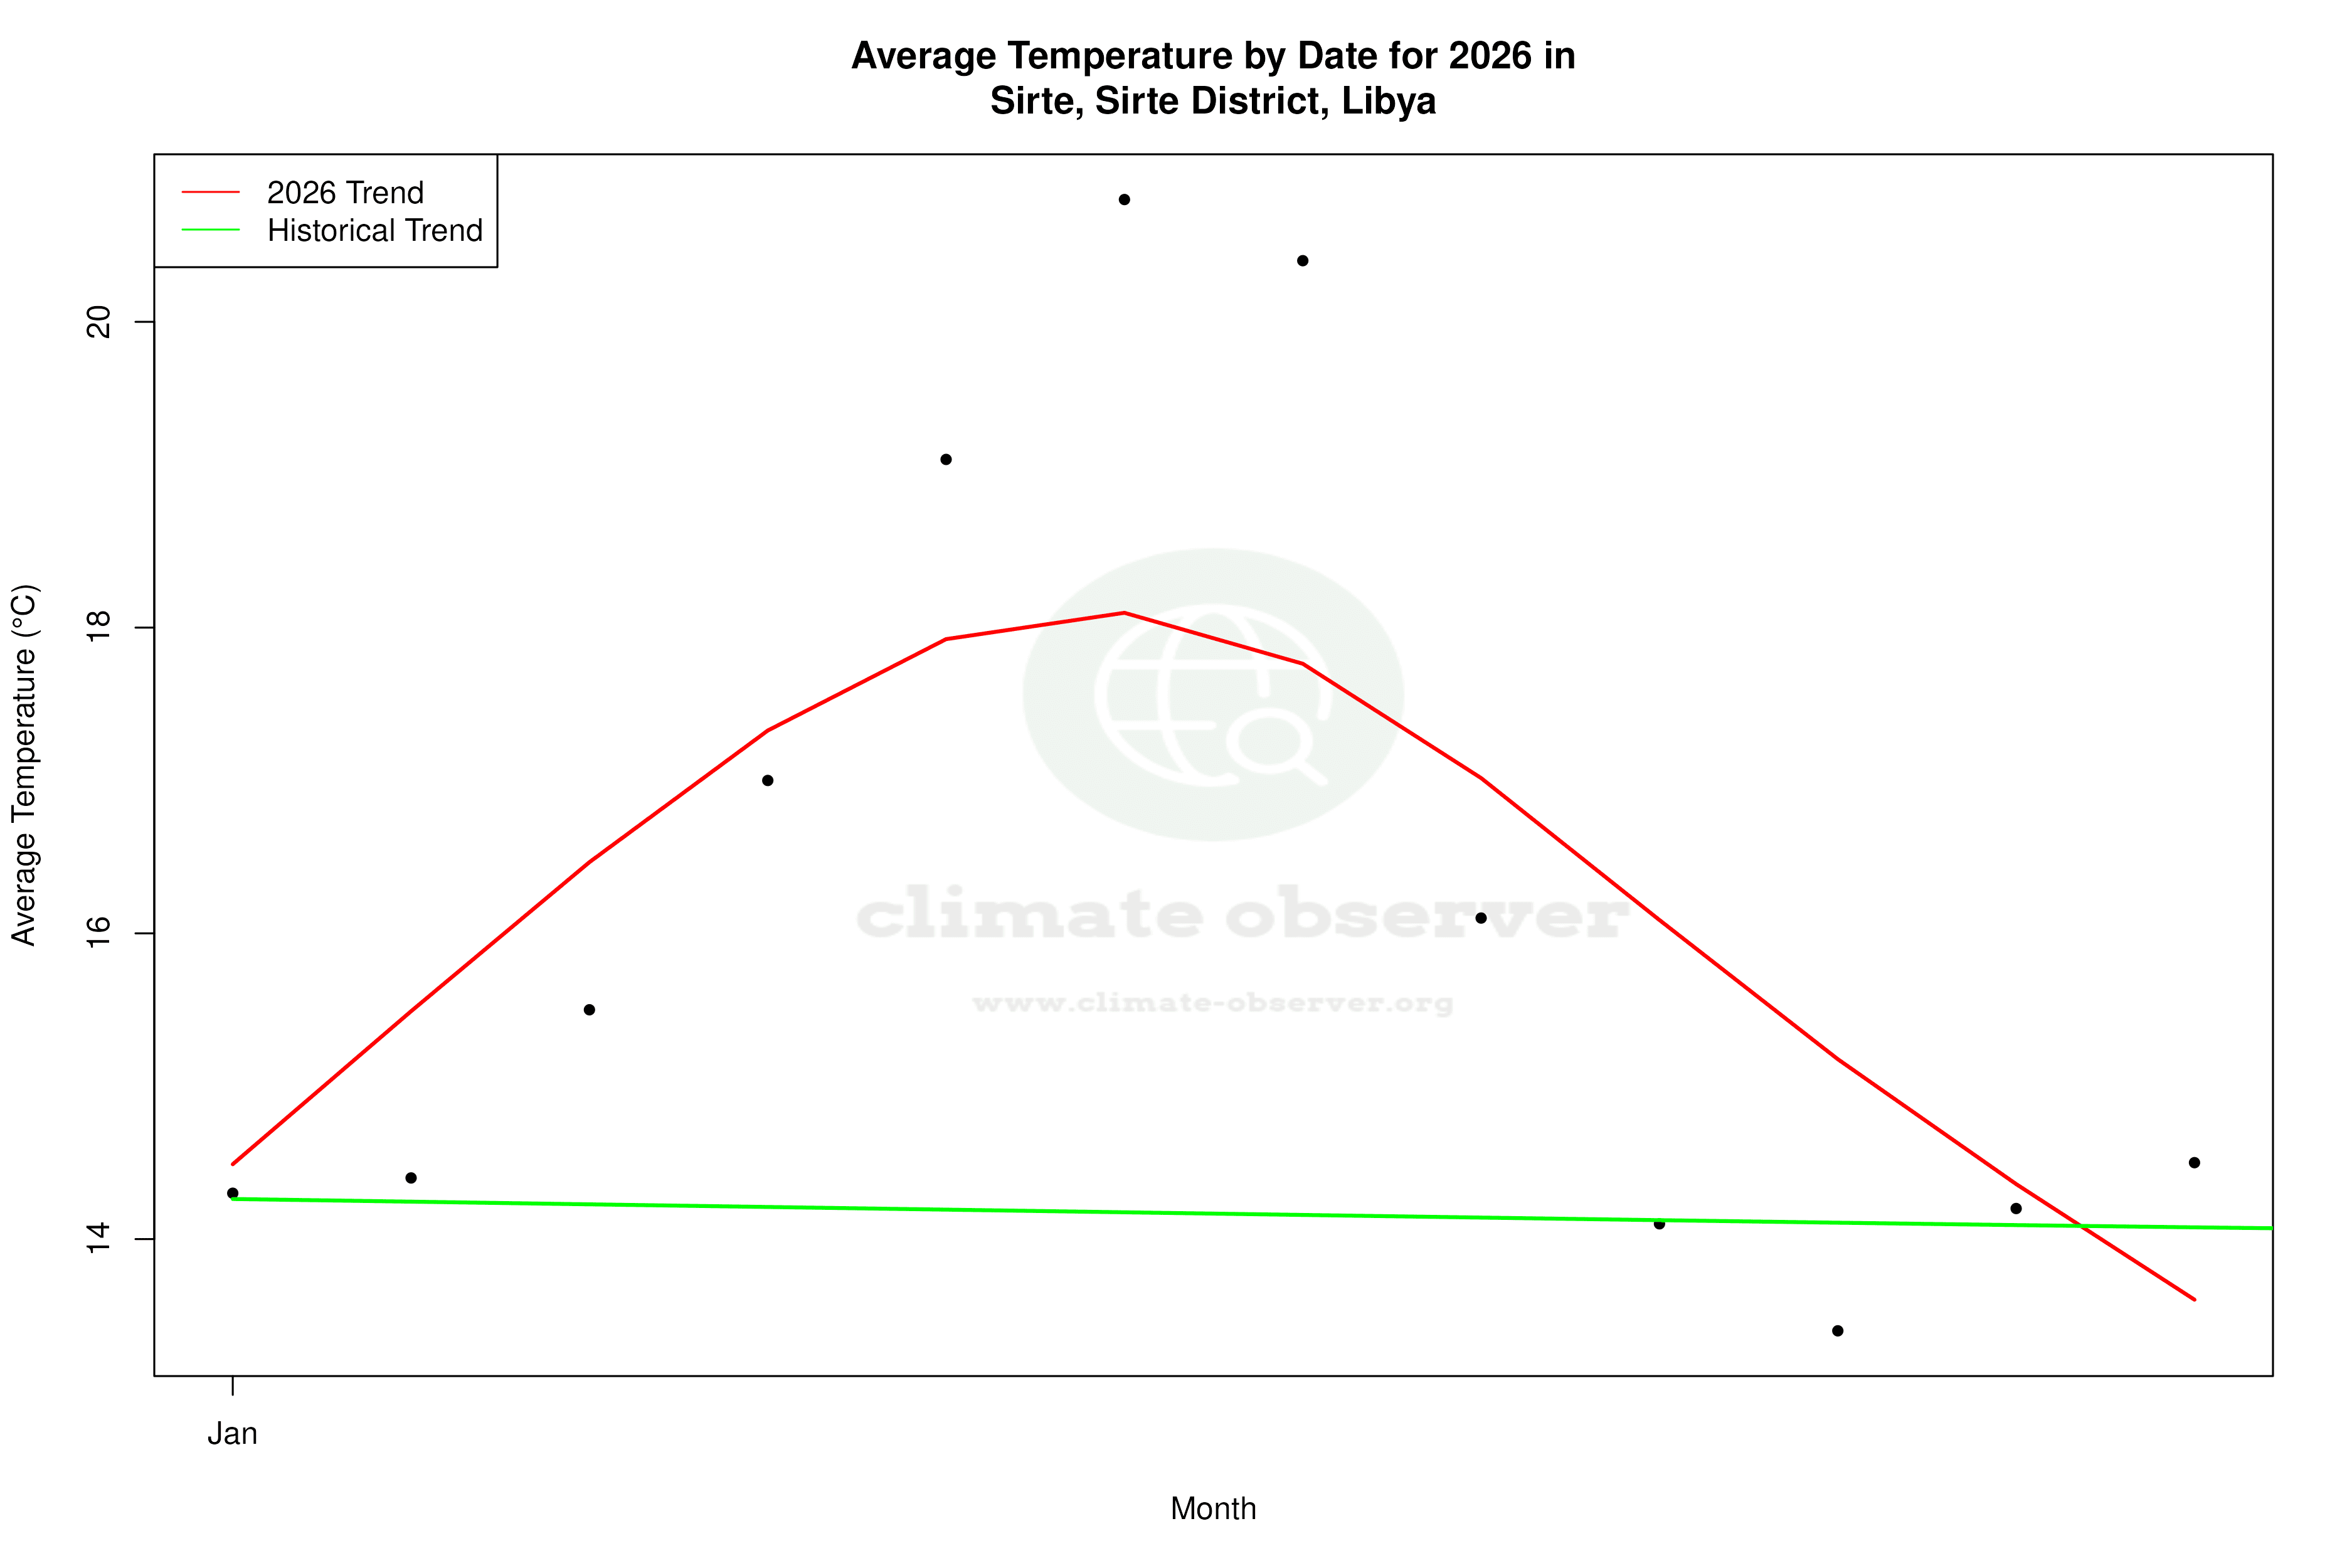
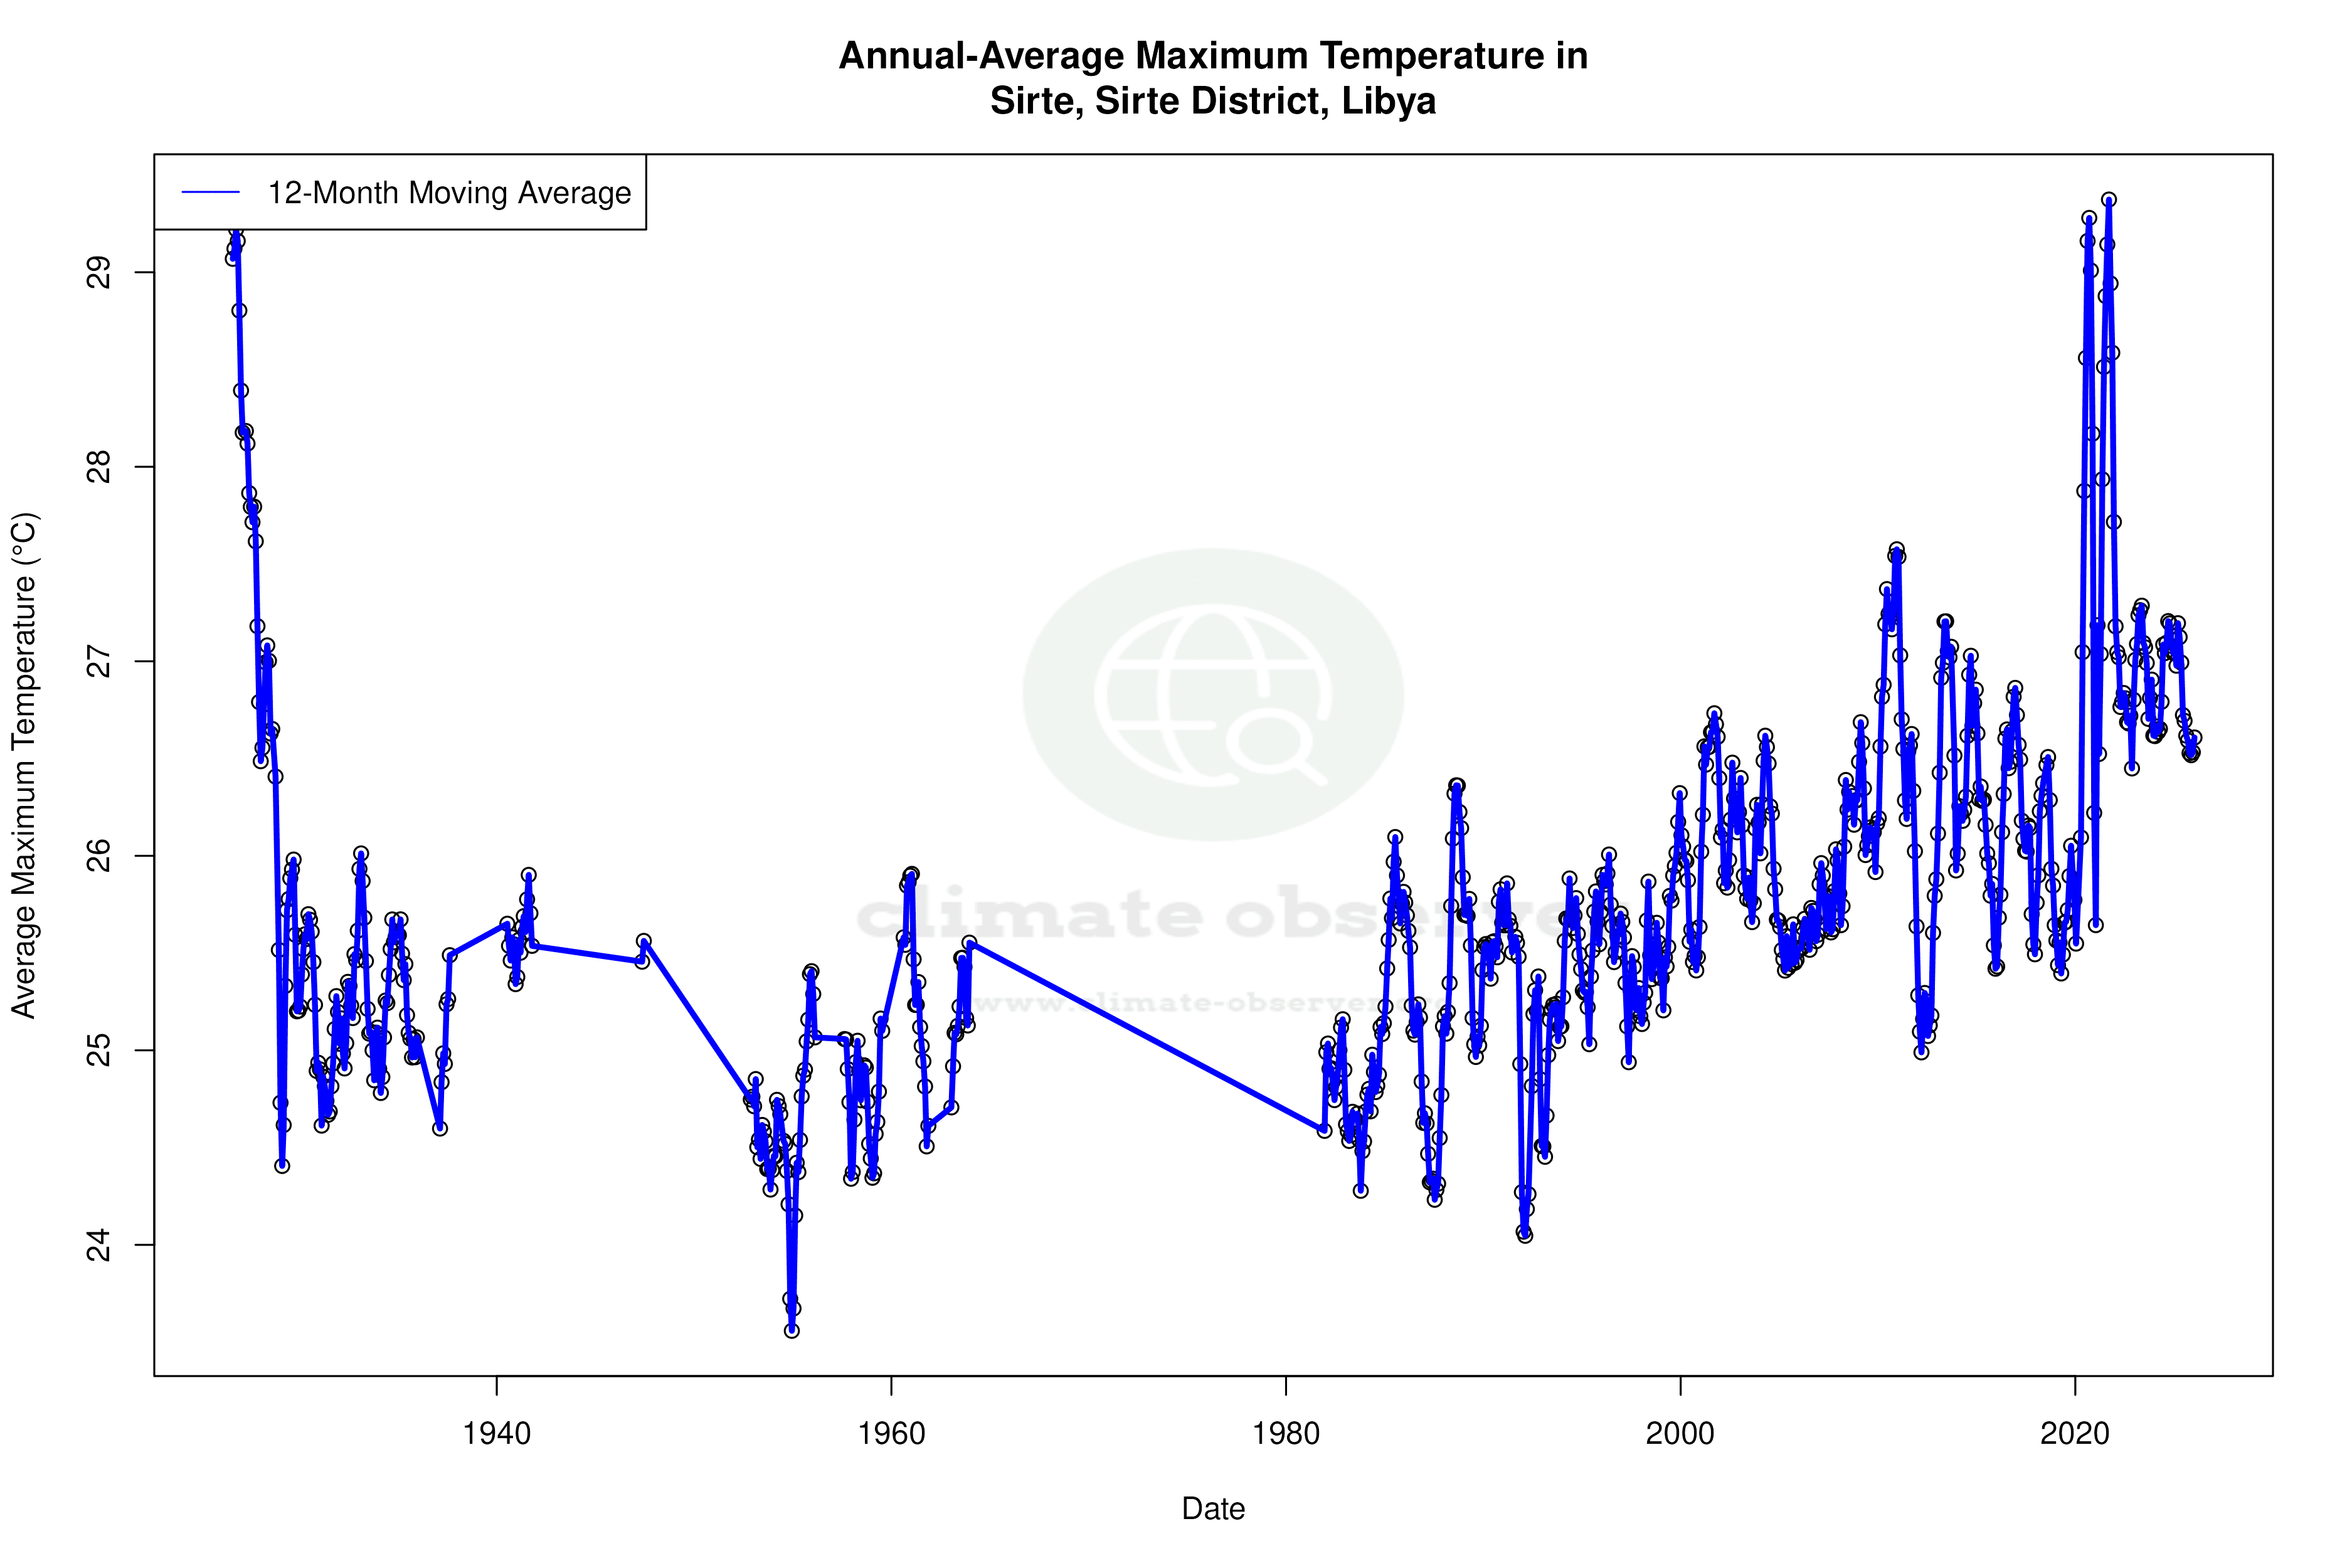
Sirte, located at 31.2°N, 16.5797°E, is characterised by a hot desert climate under the Köppen classification (BWh). Its proximity to the Mediterranean Sea tempers the extreme heat typical of inland desert areas, but it still experiences significant thermal variations. The all-time temperature trends reveal a warming of 0.10°C (0.18°F) in high temperatures, indicating a slight increase over the years. However, the lows show a more pronounced warming of 0.20°C (0.36°F), suggesting that nights are becoming warmer at a faster rate than daytime temperatures.
Recent Thermal Shifts
The past decade has seen more dramatic changes, with highs increasing by 0.38°C (0.68°F) and lows by a substantial 2.20°C (3.96°F). This disparity highlights a significant warming trend during the night, which could affect local ecosystems and agriculture. The record temperatures for Sirte have reached extremes, with a maximum of 47.8°C (118.0°F) and a minimum of -0.1°C (31.8°F), underscoring the region's broad thermal range.
Precipitation Patterns
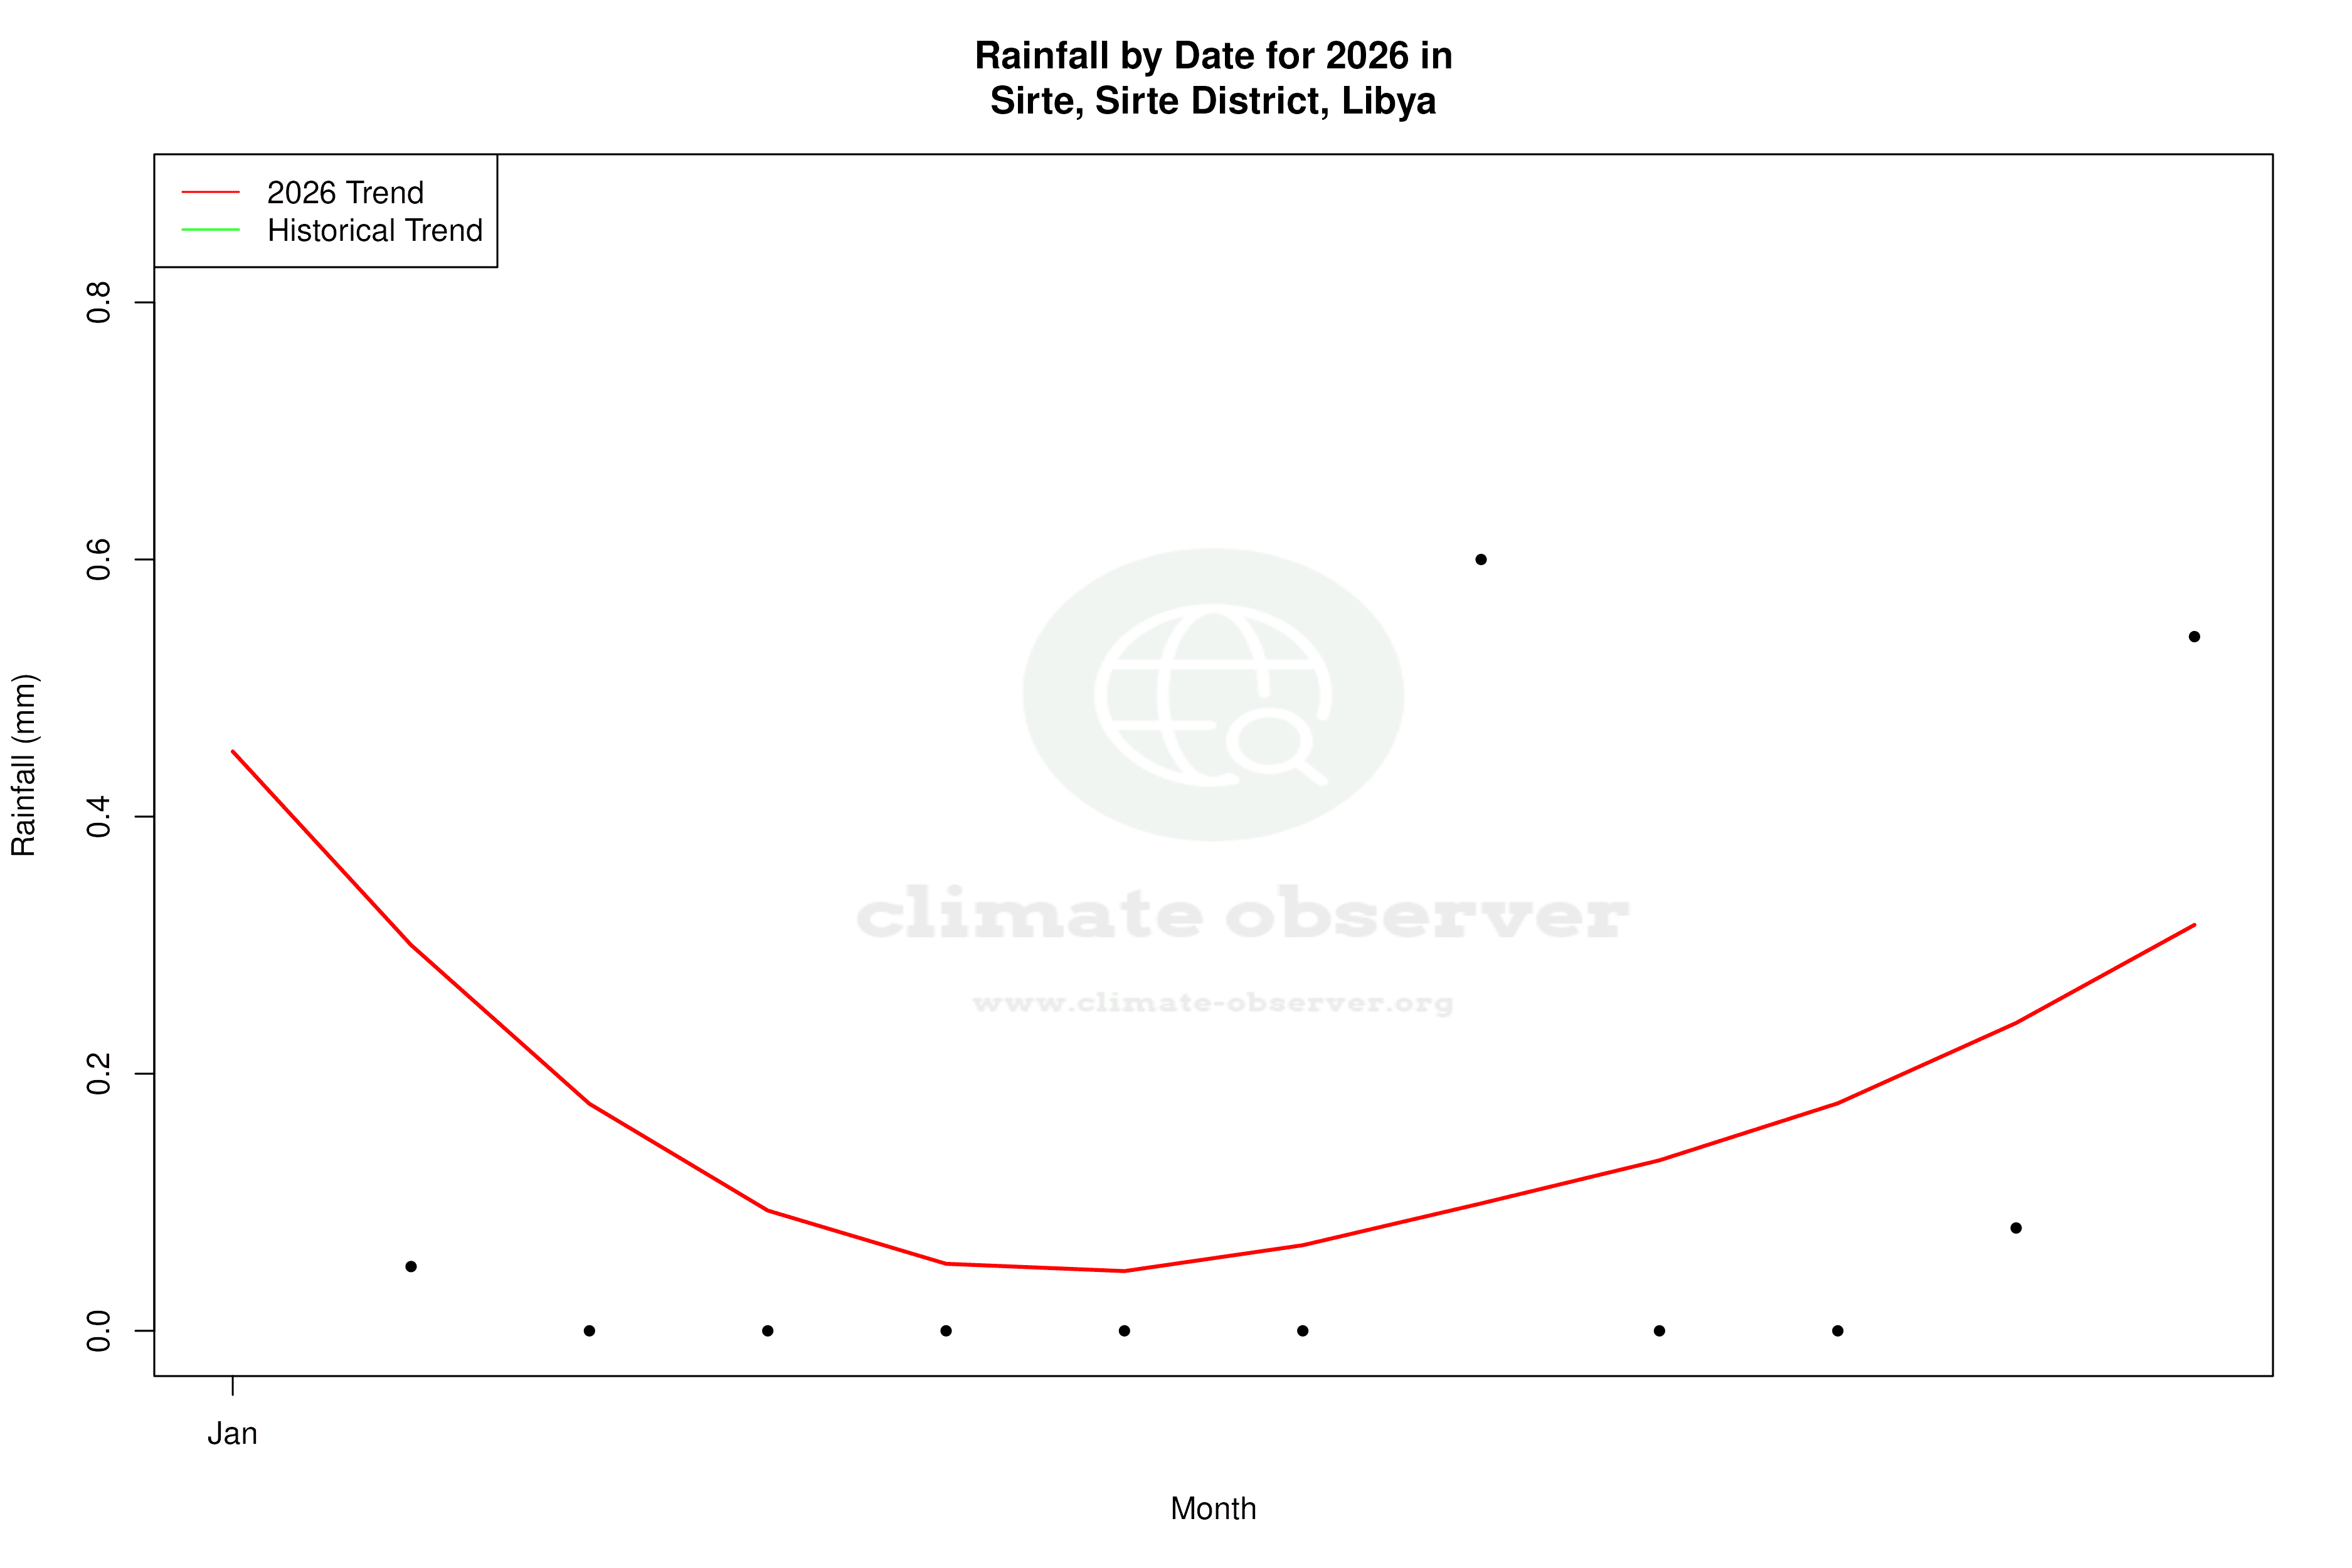
The Precipitation Concentration Index (PCI) for Sirte has decreased from a baseline of 28.3 to a current value of 24.6, indicating a shift towards more evenly distributed rainfall throughout the year. This change is significant given the region's reliance on scarce and irregular rainfall. A PCI above 20 suggests that precipitation remains concentrated, but the recent decline points to a trend of less extreme rainfall events, potentially easing the pressure on water resources and aligning with Libya's climate resilience strategies.
Implications for Regional Climate Goals
Libya's climate adaptation efforts focus on managing water resources efficiently and mitigating the impacts of climate change. The warming trends and changes in precipitation distribution in Sirte highlight the importance of these goals. As temperatures continue to rise, particularly during the night, and precipitation becomes more evenly spread, the region must adapt to these evolving conditions to ensure sustainable development and resource management.
Station Statistics
10-Year Trend
High: +0.10 °C/decade
Low: +2.29 °C/decade
Rain: +0.03 mm/decade
25-Year Trend
High: +0.27 °C/decade
Low: +0.88 °C/decade
Rain: +0.06 mm/decade
50-Year Trend
High: +0.40 °C/decade
Low: +0.49 °C/decade
Rain: +0.03 mm/decade
All-Time Trend
High: +0.10 °C/decade
Low: +0.20 °C/decade
Rain: +0.00 mm/decade
Percentage Above-Average Days
Last 12 Months: 54.0%
This Year: 59.4%
Precipitation Concentration Index (PCI) ℹ️
Last 12 Months: 22.7
Historical Average: 26.4
Percentile Rank of Last 12 Months ℹ️
High: 43rd percentile
Low: 99th percentile
Rain: 28th percentile
Change in Variance ℹ️
High: +1.4%
Low: +1.7%
Intraday: -18.8%
Data Coverage
70.7%
First Year of Data
1925
Station Location
Historical Weather Records
| Max High | Avg High | Min High | Max Avg | Avg Avg | Min Avg | Max Low | Avg Low | Min Low | Max Precipitation | Avg Precipitation | Max Snow | Avg Snow | |
|---|---|---|---|---|---|---|---|---|---|---|---|---|---|
| Record | 47.8 °C | — | 9.4 °C | 37.4 °C | — | 7.0 °C | 32.1 °C | — | -0.1 °C | 85.5 mm | — | — | — |
| January | 32.0 °C | 18.2 °C | 10.0 °C | 23.6 °C | 14.1 °C | 7.0 °C | 19.0 °C | 9.3 °C | 0.6 °C | 43.9 mm | 1.2 mm | — | — |
| February | 37.4 °C | 19.4 °C | 9.4 °C | 25.6 °C | 15.0 °C | 7.9 °C | 20.7 °C | 9.8 °C | 0.4 °C | 55.1 mm | 0.9 mm | — | — |
| March | 39.1 °C | 21.8 °C | 10.0 °C | 29.1 °C | 16.9 °C | 10.3 °C | 25.7 °C | 11.6 °C | -0.1 °C | 49.1 mm | 0.3 mm | — | — |
| April | 45.0 °C | 24.5 °C | 15.5 °C | 32.2 °C | 19.3 °C | 12.3 °C | 27.5 °C | 14.0 °C | 0.0 °C | 18.2 mm | 0.1 mm | — | — |
| May | 45.8 °C | 27.2 °C | 18.7 °C | 36.5 °C | 22.0 °C | 16.1 °C | 27.8 °C | 17.0 °C | 4.0 °C | 12.7 mm | 0.1 mm | — | — |
| June | 47.8 °C | 29.7 °C | 21.0 °C | 37.0 °C | 24.7 °C | 18.0 °C | 31.0 °C | 19.9 °C | 9.0 °C | 8.9 mm | 0.0 mm | — | — |
| July | 44.2 °C | 30.8 °C | 23.6 °C | 35.2 °C | 26.7 °C | 21.6 °C | 30.0 °C | 22.1 °C | 10.0 °C | 1.7 mm | 0.0 mm | — | — |
| August | 44.8 °C | 31.6 °C | 22.6 °C | 37.4 °C | 27.6 °C | 22.3 °C | 32.1 °C | 23.0 °C | 11.5 °C | 8.0 mm | 0.0 mm | — | — |
| September | 44.6 °C | 31.1 °C | 21.2 °C | 36.1 °C | 26.6 °C | 20.4 °C | 29.5 °C | 22.0 °C | 11.8 °C | 50.5 mm | 0.2 mm | — | — |
| October | 43.0 °C | 28.8 °C | 19.1 °C | 34.9 °C | 24.0 °C | 16.2 °C | 31.2 °C | 19.3 °C | 7.5 °C | 33.5 mm | 0.5 mm | — | — |
| November | 38.0 °C | 24.4 °C | 14.7 °C | 30.9 °C | 19.9 °C | 11.0 °C | 25.2 °C | 14.9 °C | 5.7 °C | 55.3 mm | 0.6 mm | — | — |
| December | 32.8 °C | 19.8 °C | 10.5 °C | 25.2 °C | 15.6 °C | 8.1 °C | 21.0 °C | 10.7 °C | 1.0 °C | 85.5 mm | 1.2 mm | — | — |
Data Visualisations
Remove WatermarksCurrent Year Climate Trends vs Historical


Max Temperature this Year | 1 of 6
Climate 12-Month Moving Averages
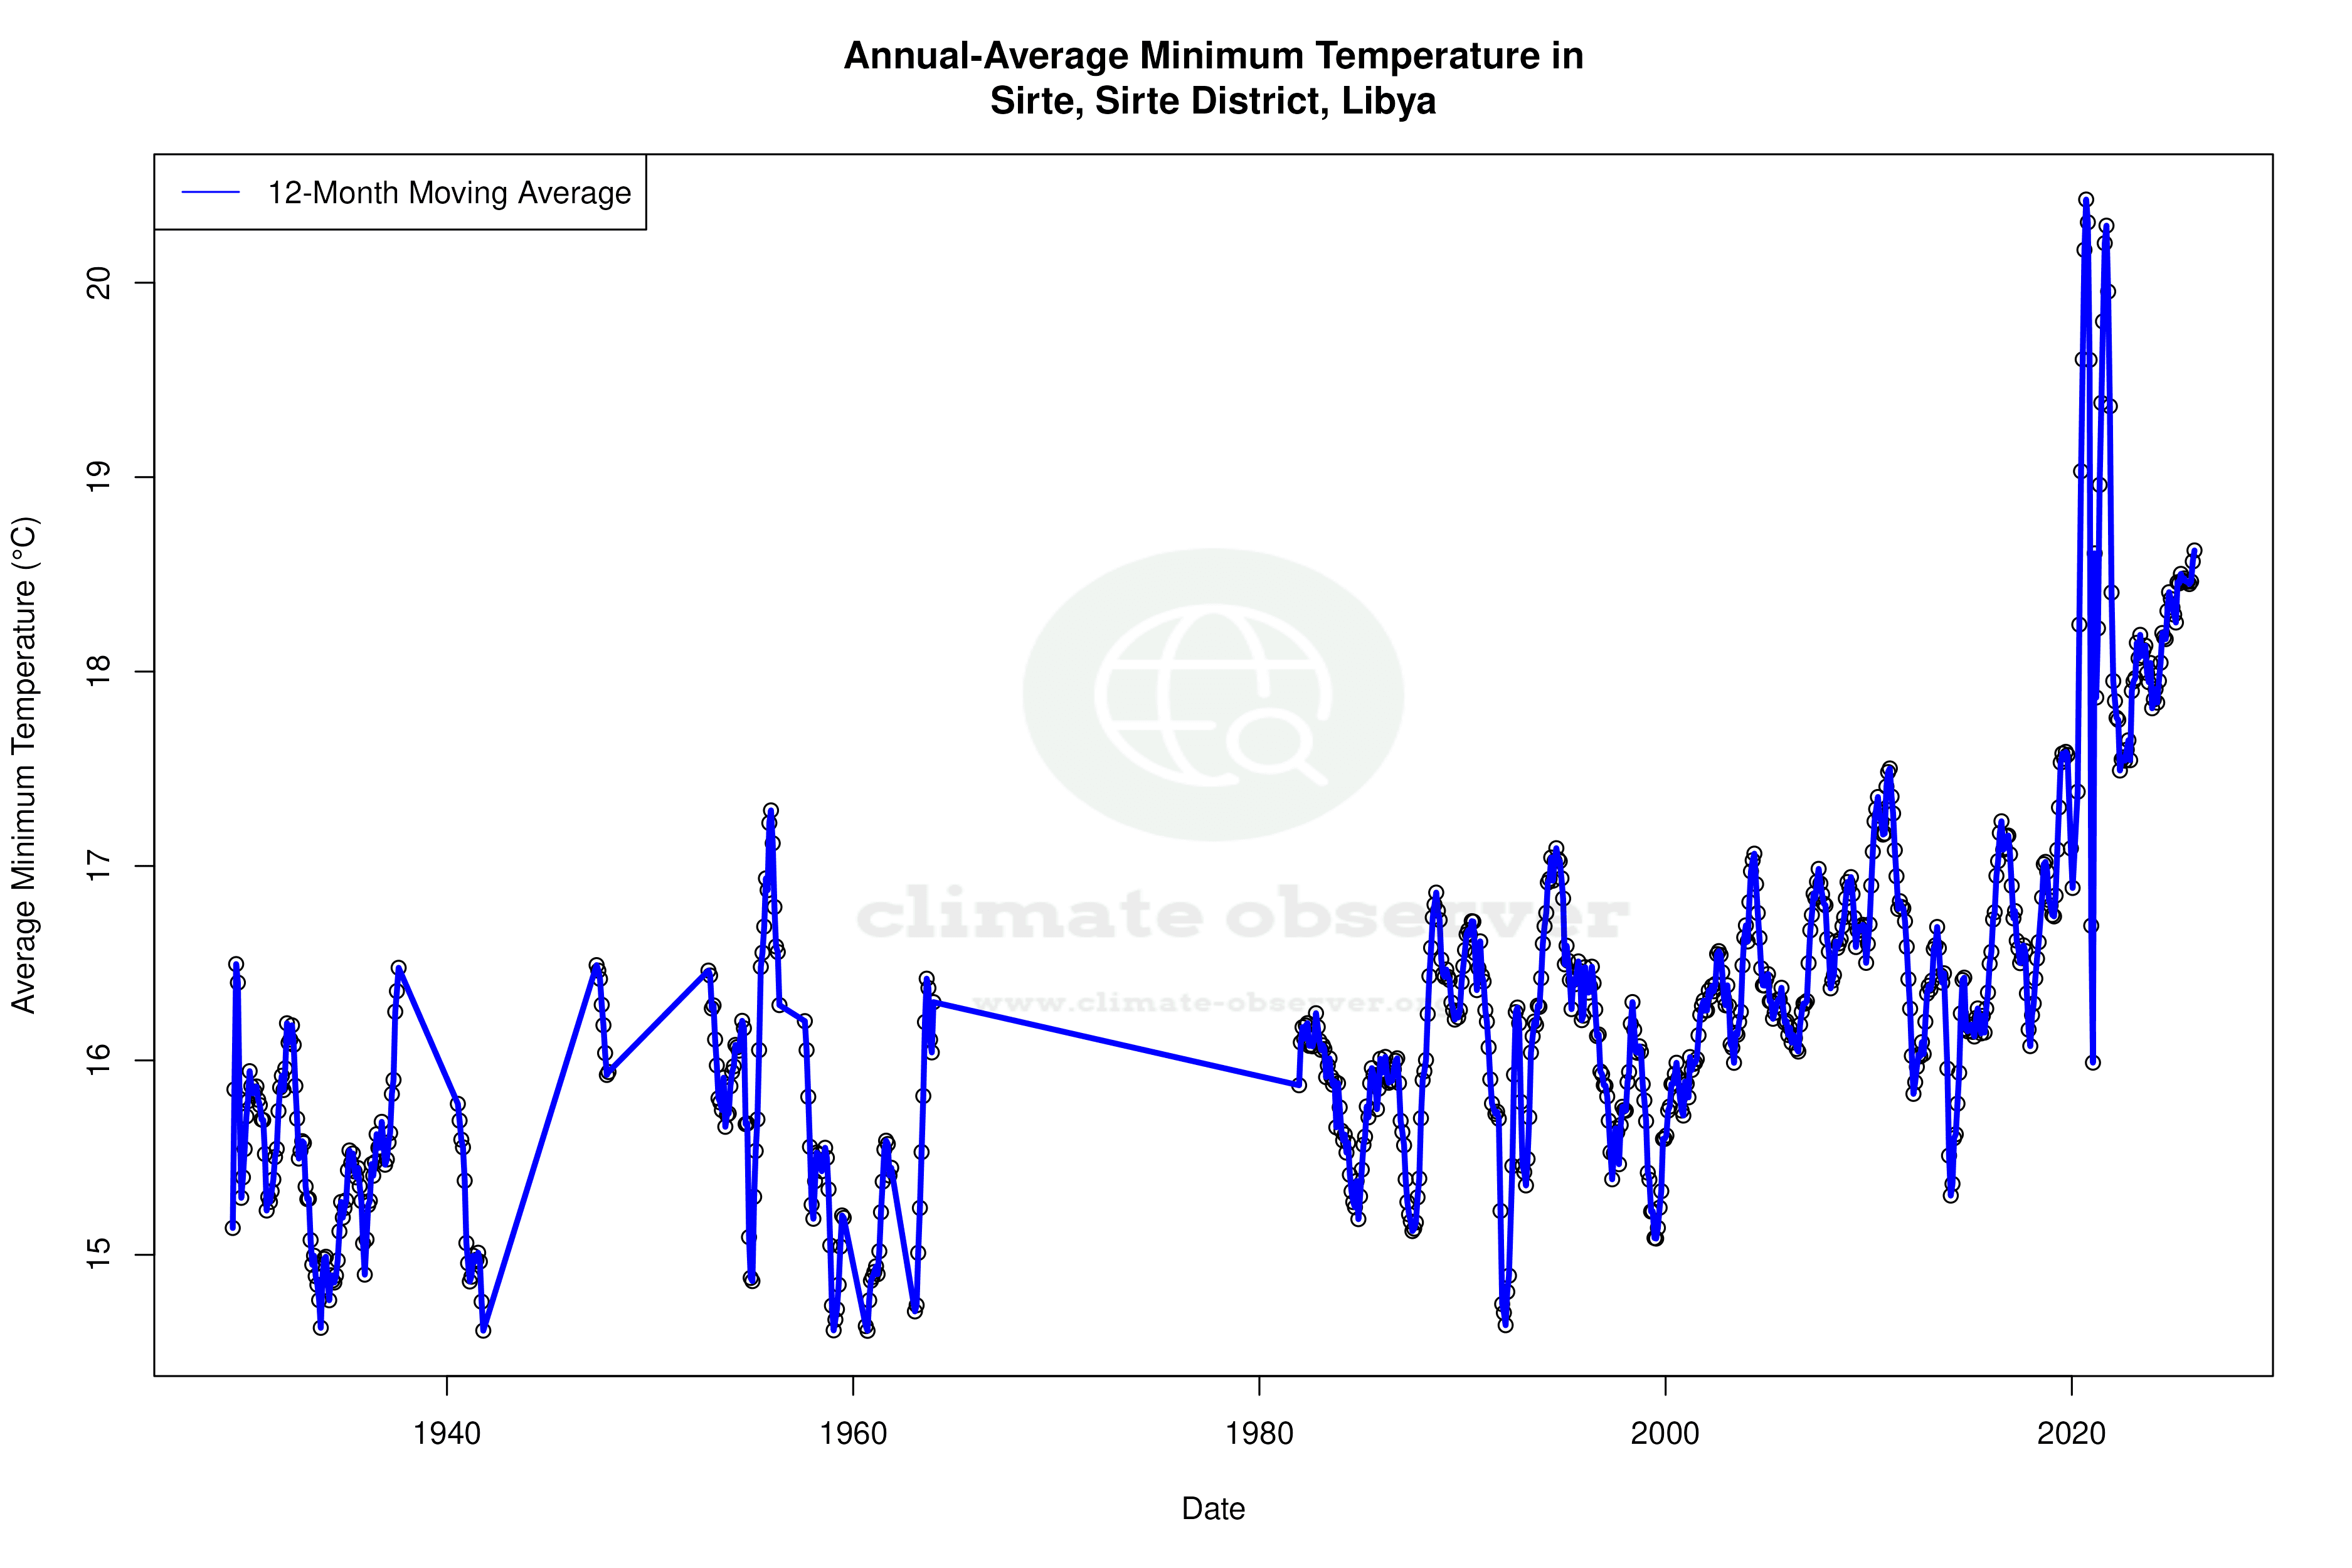


Max Temperature 12-Month MA | 1 of 6
Daily Data Points and Averages Throughout the Year
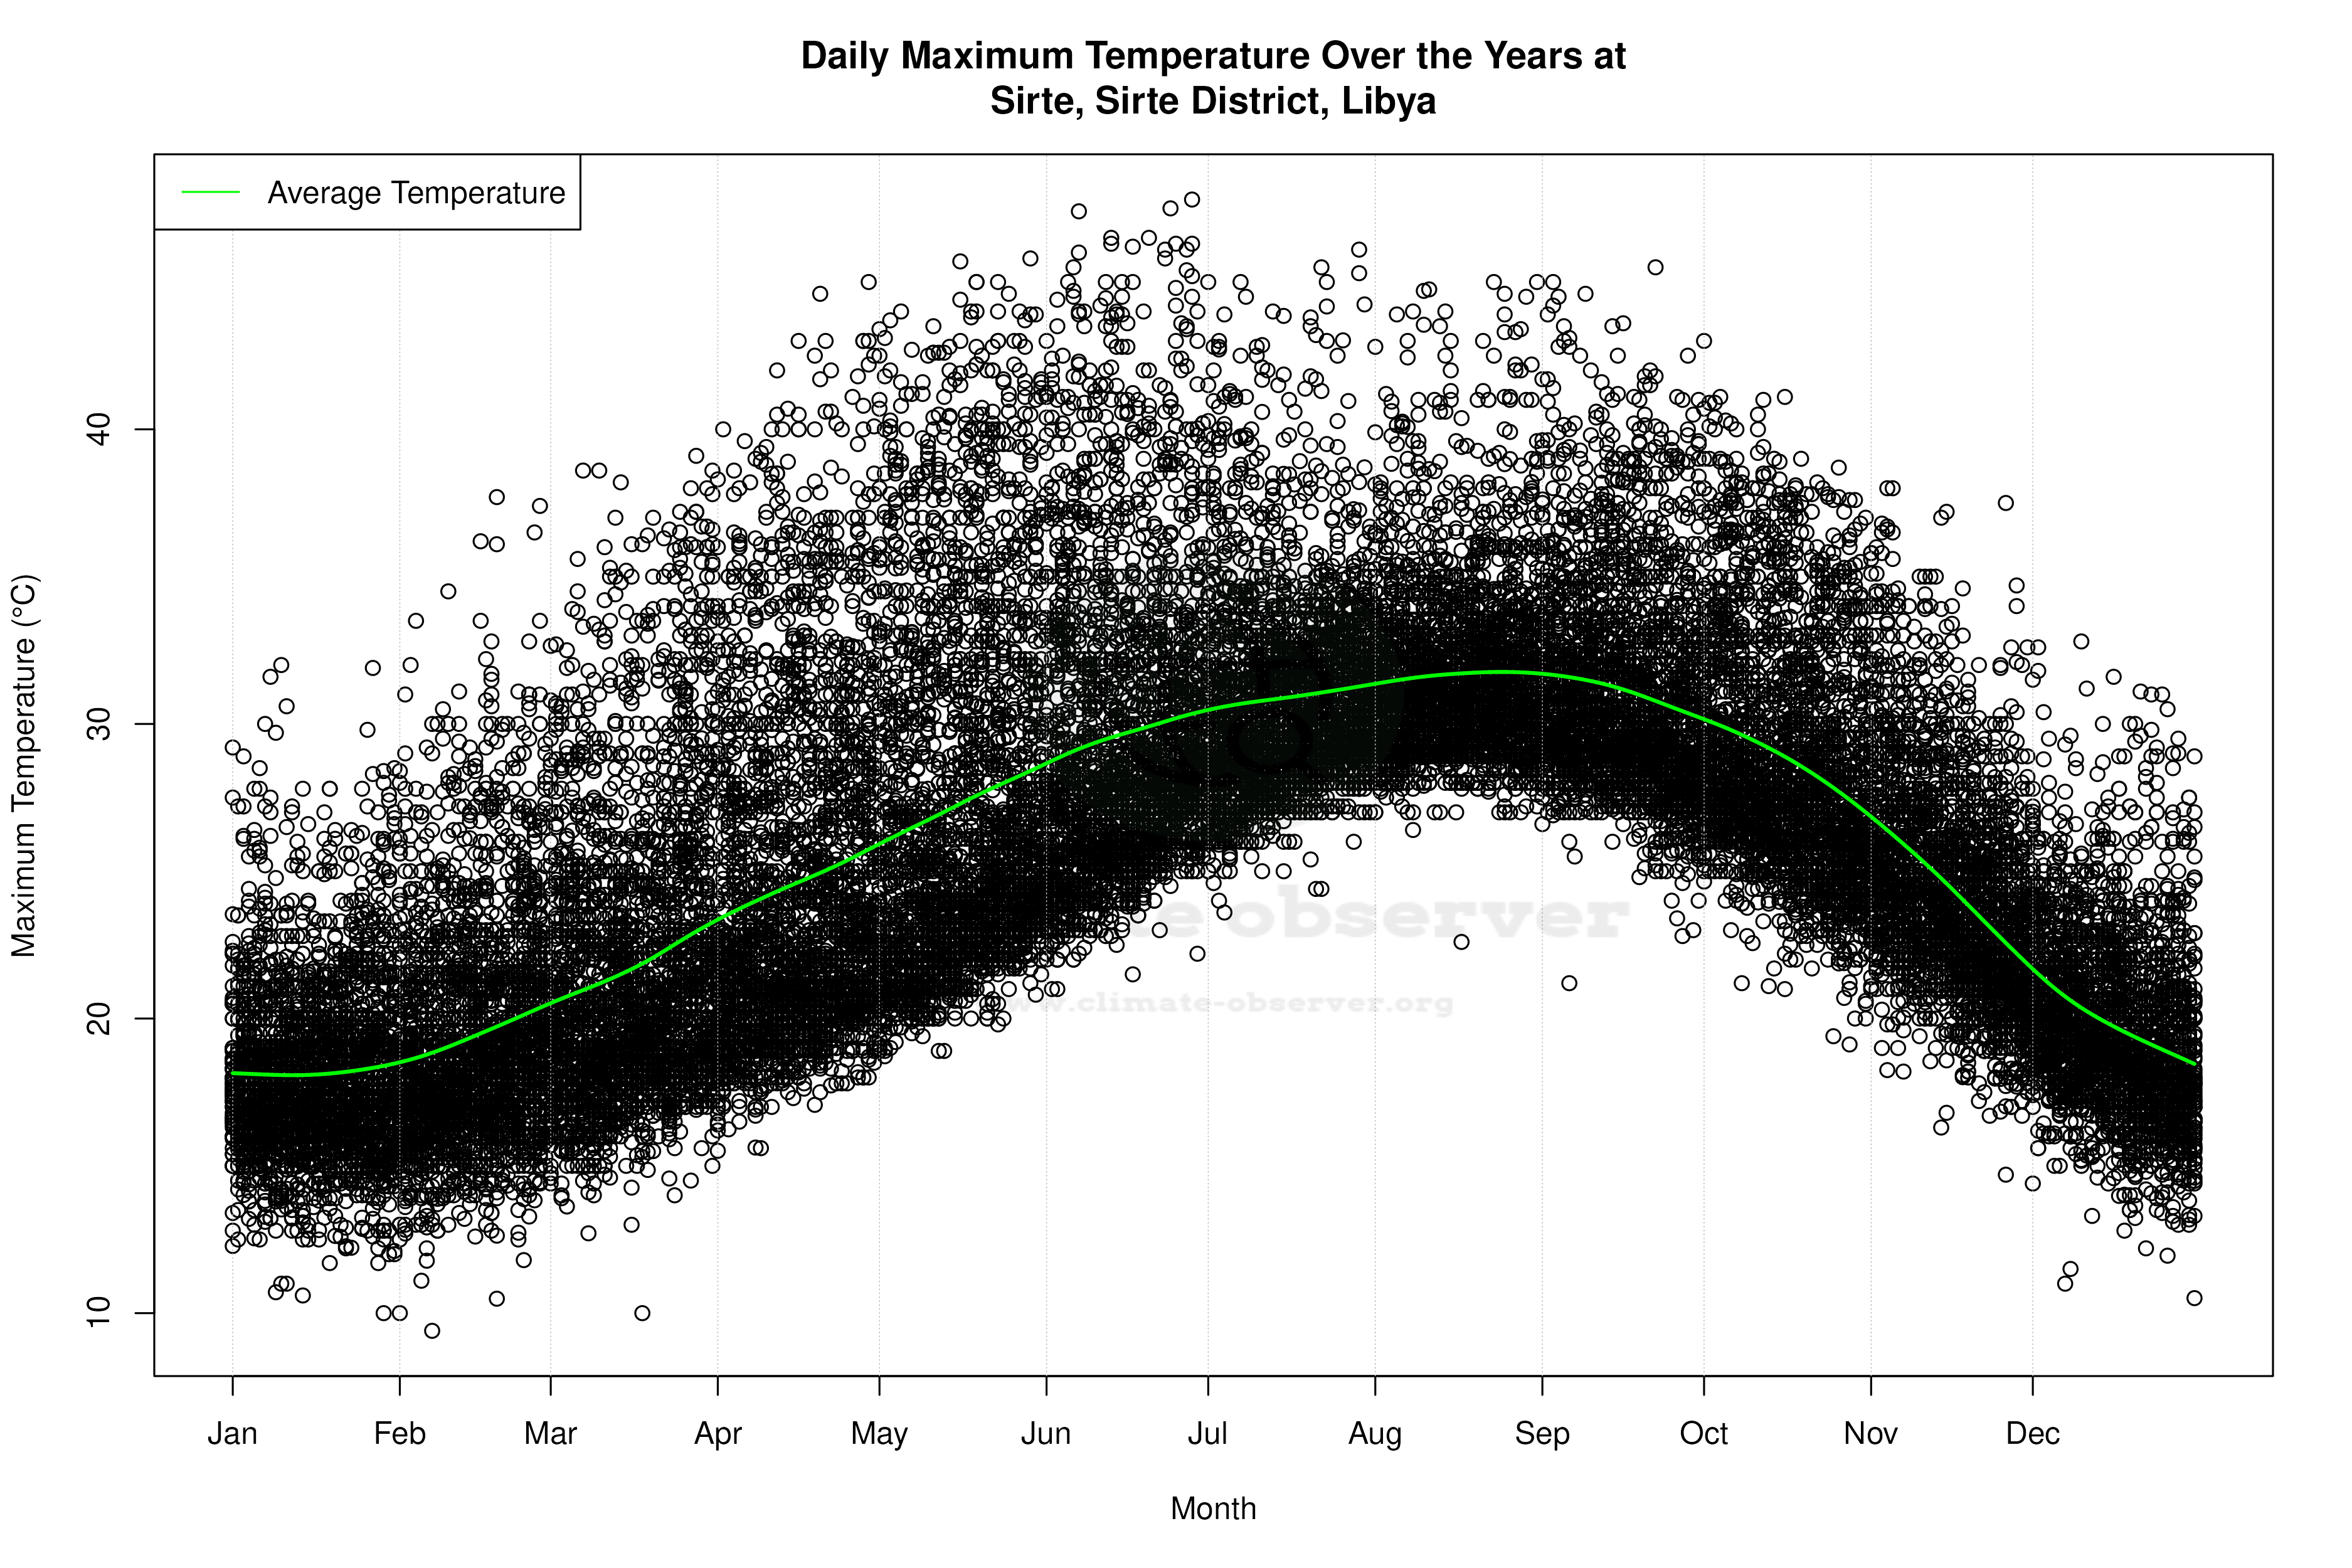
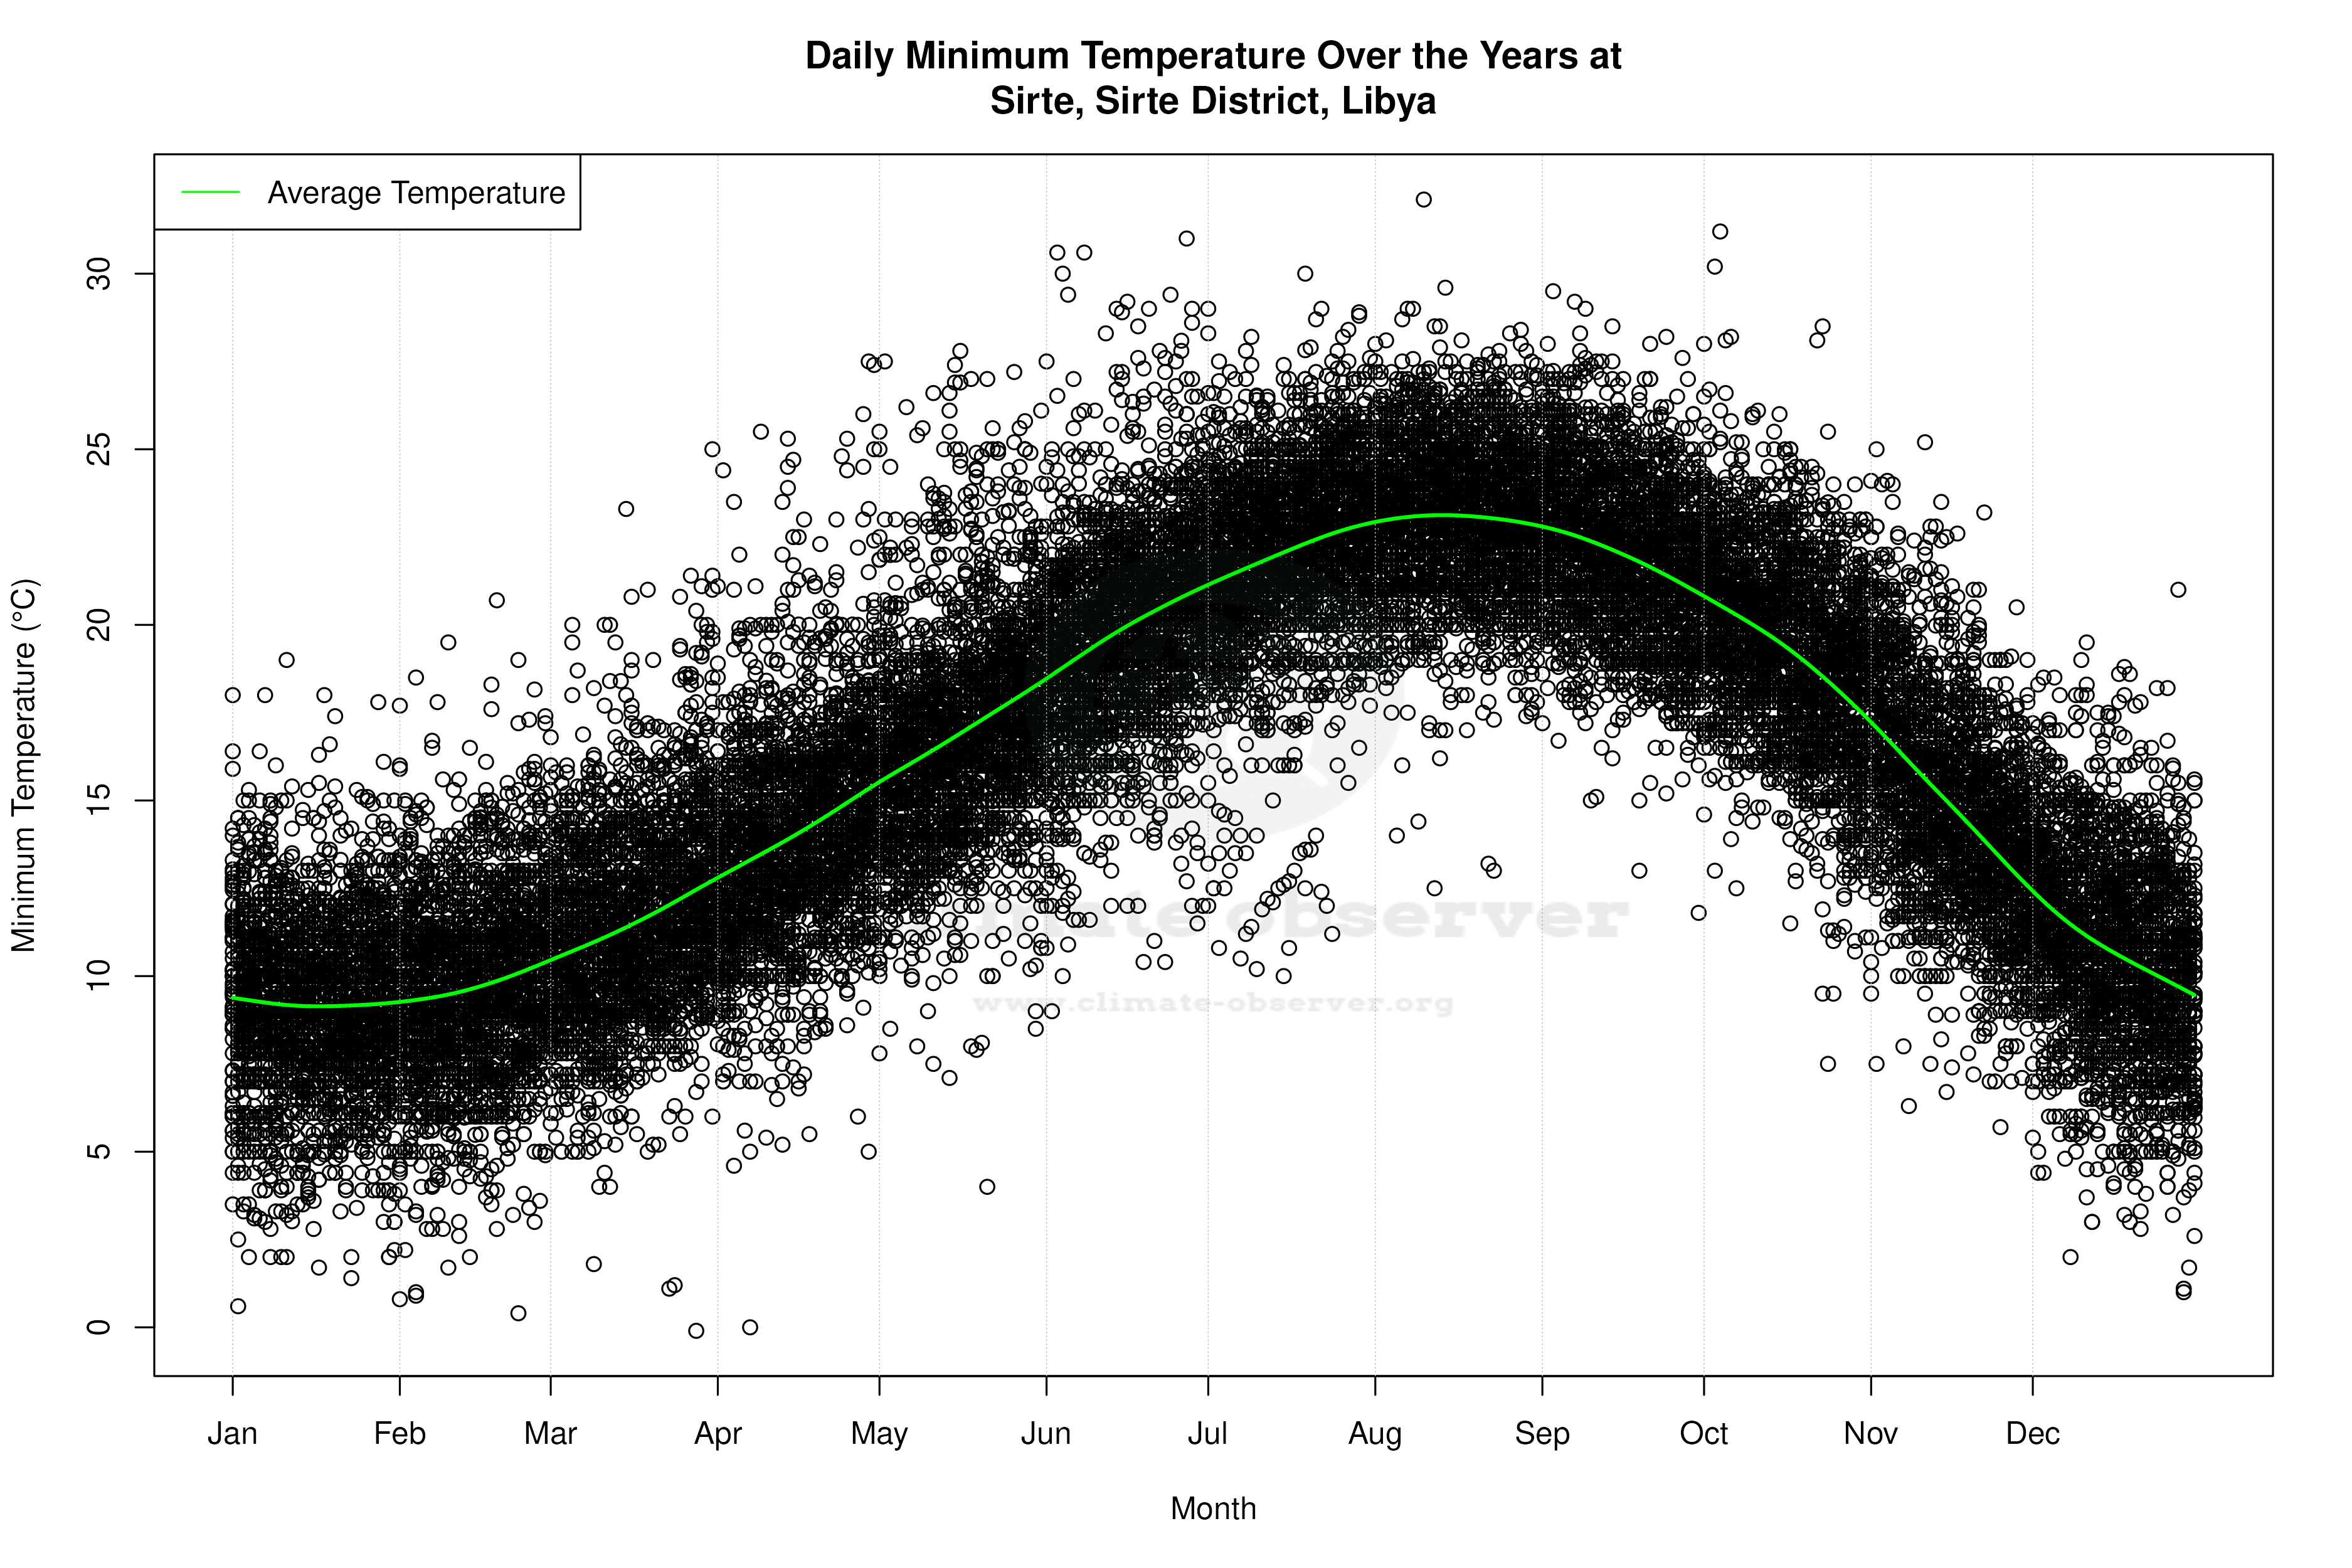
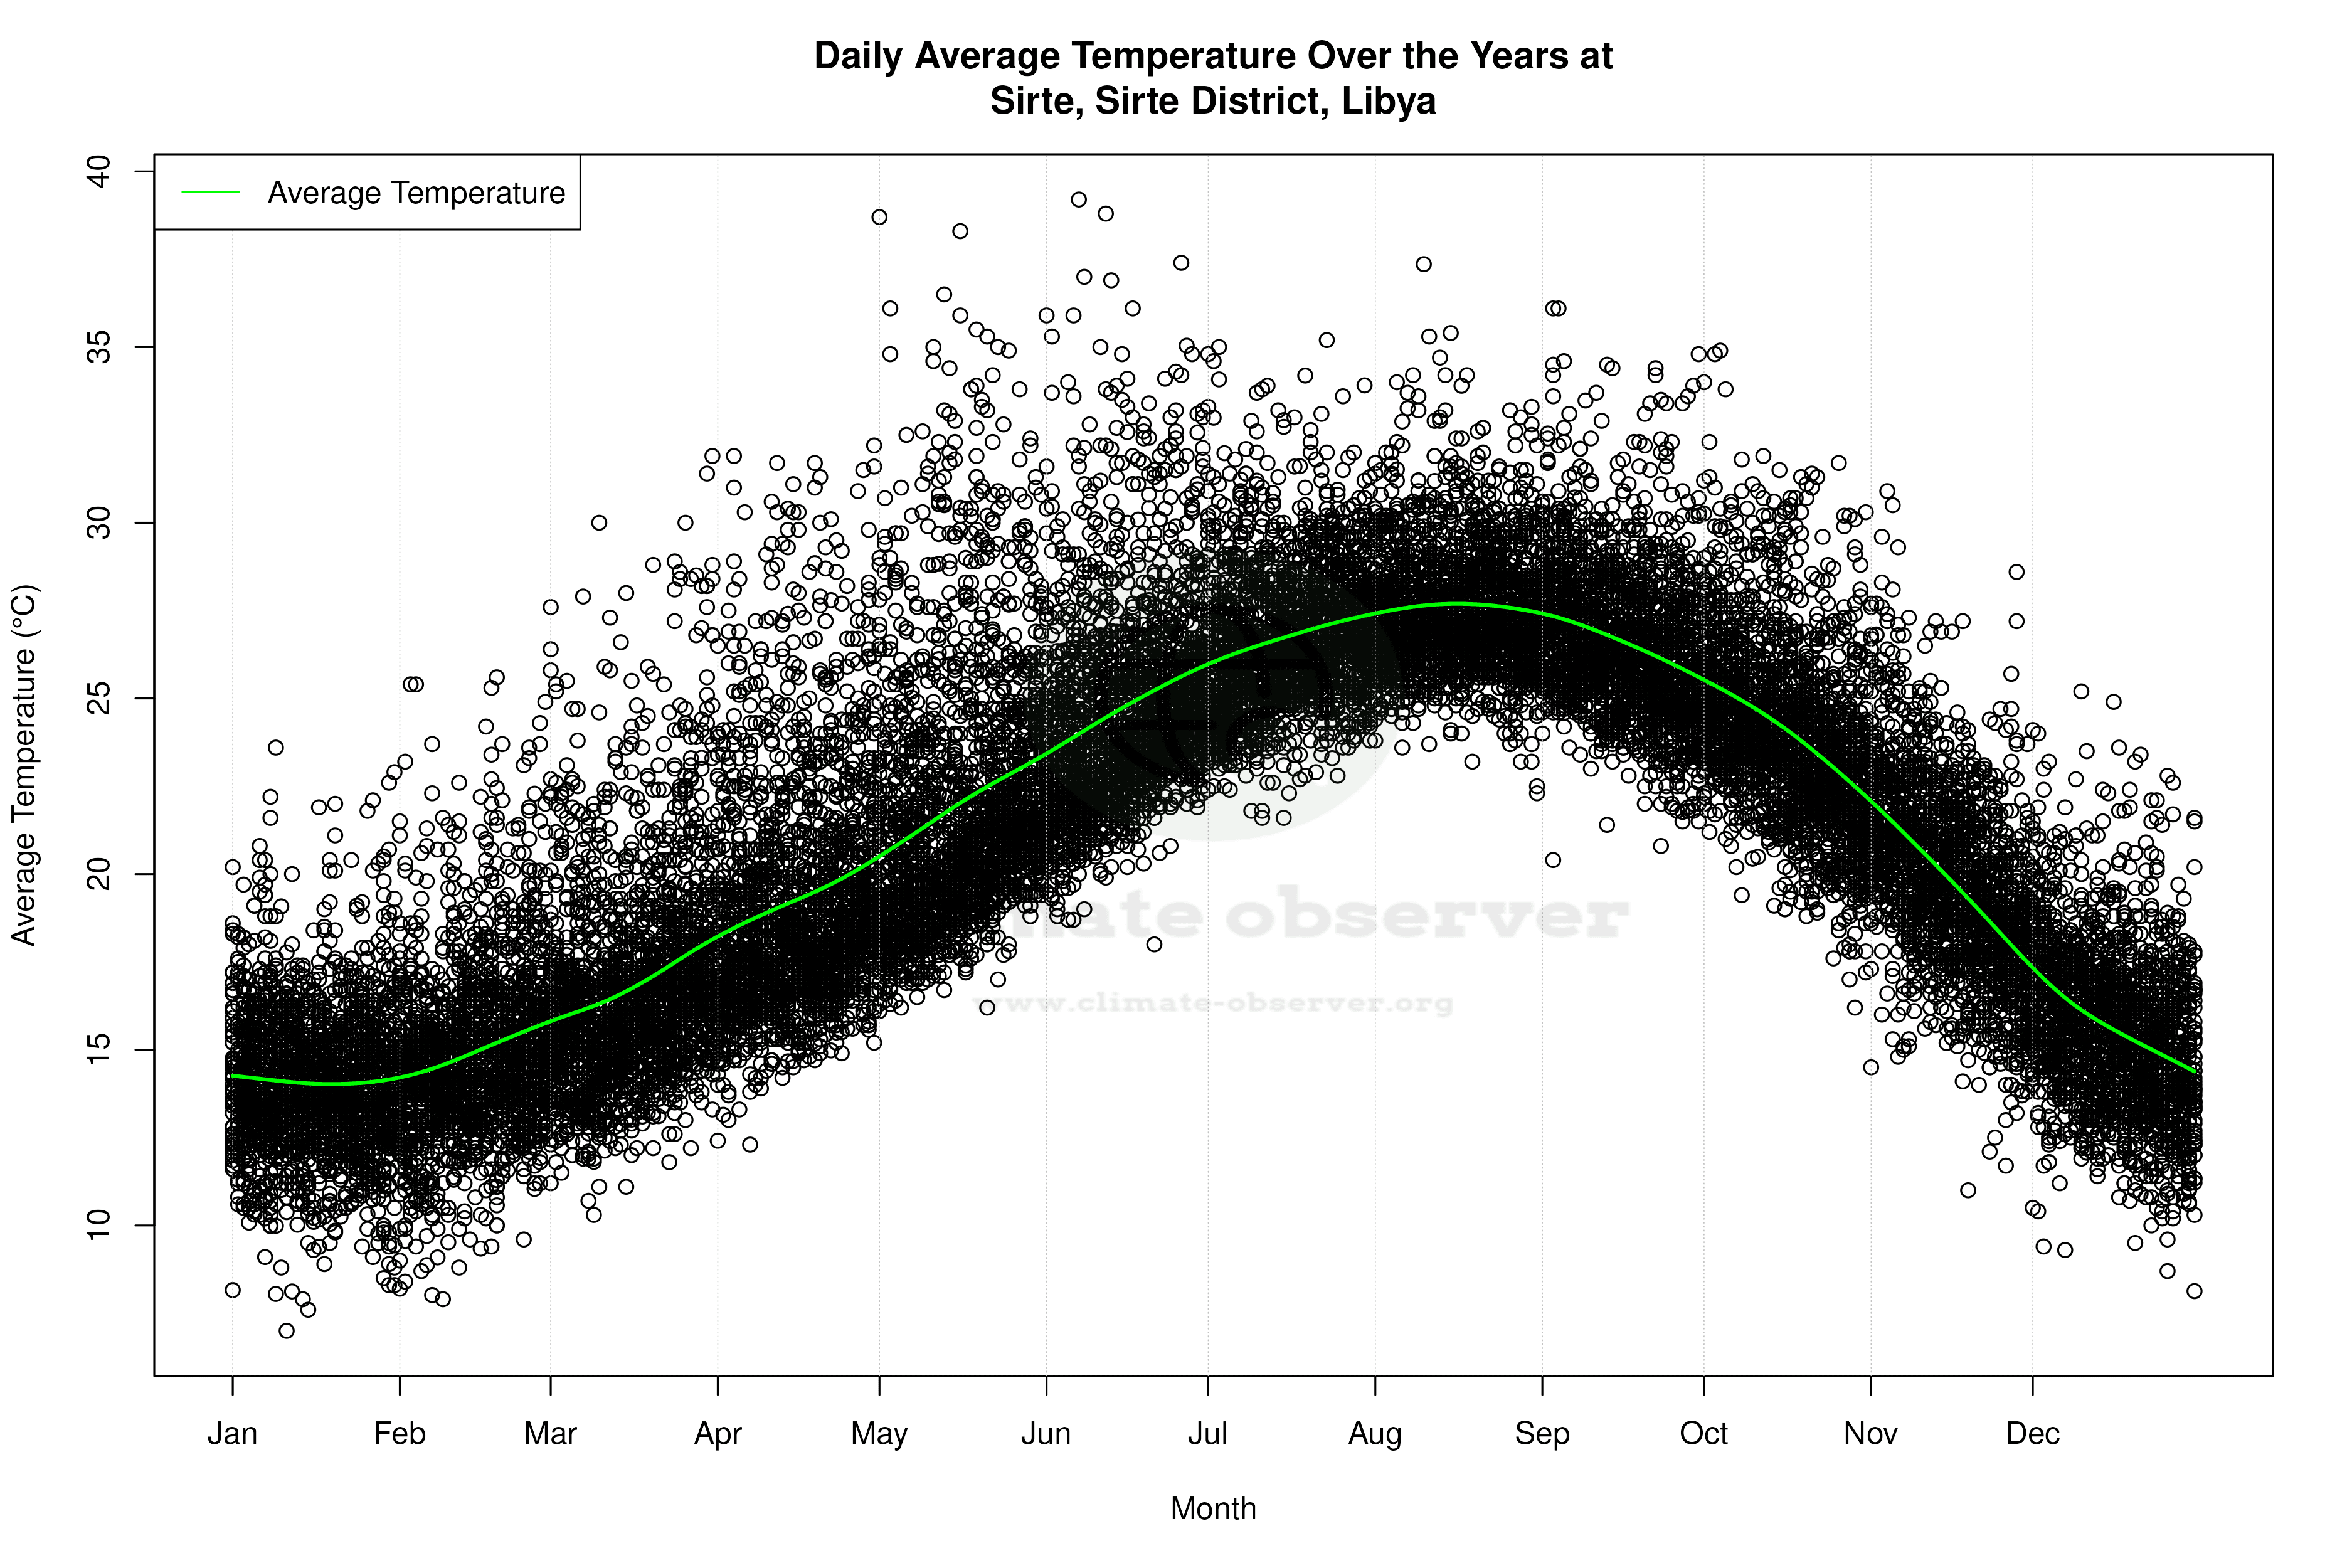


Average Max Temperature Throughout Year | 1 of 5
