Climate for Station: Shahat, Jabal al Akhdar District, Libya
Loading live weather...
Climate Analysis & Overview
Shahat, nestled in Libya's Green Mountain region, is experiencing a warming trend, with both highs and lows increasing over the past decade. The precipitation pattern has marginally shifted towards a more even distribution, suggesting subtle changes in the region's climate dynamics.
Warming Trends in Shahat
Shahat, located at 32.7997°N, 21.88°E, is characterised by a Mediterranean climate, influenced by its proximity to the Green Mountain range. Over the past decade, the region has experienced a warming trend, with average highs increasing by 0.83°C (1.49°F) and lows by 0.80°C (1.44°F). This recent trend is more pronounced than the all-time warming, where highs have risen by 0.19°C (0.34°F) and lows by 0.84°C (1.51°F). These figures indicate a significant warming of nighttime temperatures, which could have implications for local agriculture and water resources.
Temperature Extremes: A Historical Perspective
Shahat's climate history records a maximum temperature of 42.2°C (108.0°F) and a minimum of -5.6°C (21.9°F). These extremes highlight the region's capacity for significant thermal variation, a characteristic of its Mediterranean climate. The warming trend observed over the years suggests that such extremes may become more frequent, impacting both human and ecological systems.
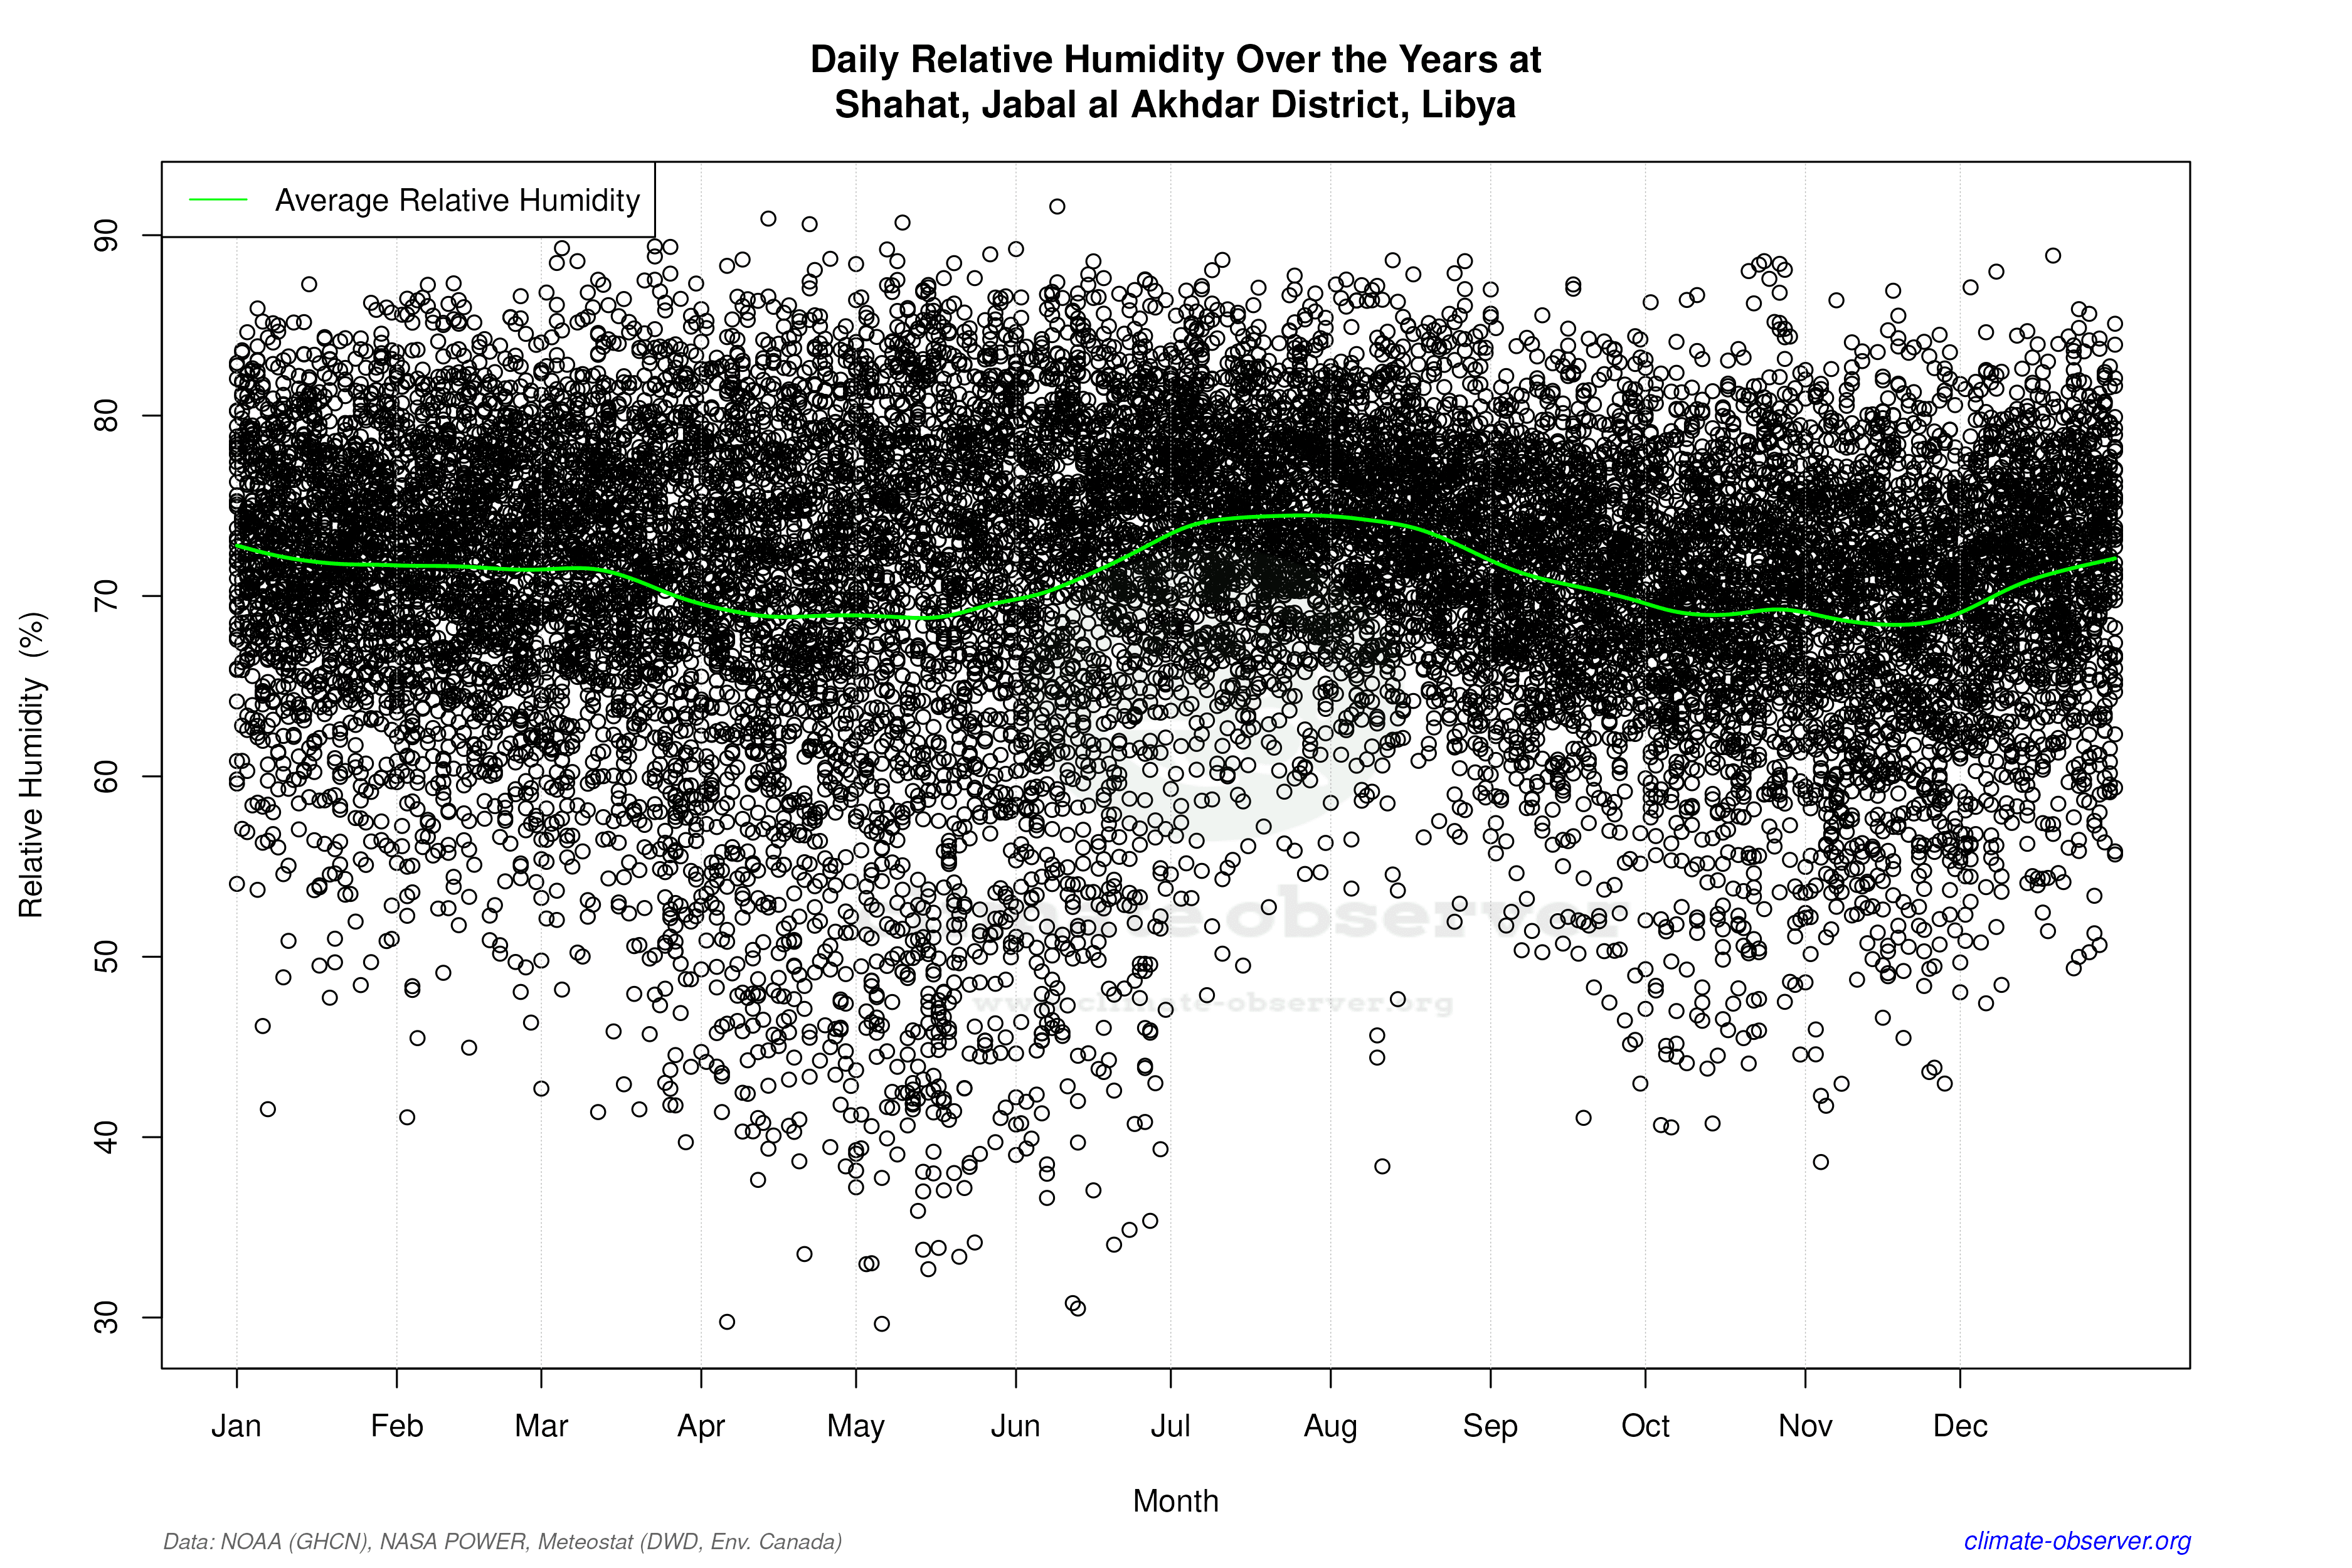
Precipitation Patterns: A Subtle Shift
The Precipitation Concentration Index (PCI) for Shahat has shown a slight decrease from a baseline of 24.1 to a current value of 23.8. This marginal change indicates a more even distribution of rainfall events, although the PCI remains high, suggesting that precipitation is still concentrated in fewer events. Such a pattern can lead to challenges in water management, especially in a region where water resources are critical for sustaining agriculture and local ecosystems.
Regional Climate Goals and Implications
Libya's regional climate goals focus on adapting to and mitigating the impacts of climate change. The warming trends in Shahat, particularly the significant rise in nighttime temperatures, align with broader regional patterns of climate change. As Libya works towards enhancing its resilience, understanding these localised trends is crucial. The slight shift towards more evenly distributed precipitation could offer some relief in terms of water availability, but the overall warming trend underscores the need for adaptive strategies.
Geographical Influence on Climate Dynamics
Shahat's unique geographical setting, with its elevation and proximity to the Mediterranean Sea, plays a significant role in shaping its climate. The Green Mountain range acts as a barrier, influencing wind patterns and precipitation distribution. This geographical context is vital for interpreting the observed climate data and understanding the potential impacts of ongoing climatic changes on the region's environmental and socio-economic systems.
Station Statistics
10-Year Trend
High: +0.82 °C/decade
Low: +0.81 °C/decade
Rain: -0.03 mm/decade
25-Year Trend
High: +0.60 °C/decade
Low: +1.82 °C/decade
Rain: -0.04 mm/decade
50-Year Trend
High: +0.38 °C/decade
Low: +1.00 °C/decade
Rain: -0.06 mm/decade
All-Time Trend
High: +0.19 °C/decade
Low: +0.85 °C/decade
Rain: -0.12 mm/decade
Percentage Above-Average Days
Last 12 Months: 54.8%
This Year: 57.8%
Precipitation Concentration Index (PCI) ℹ️
Last 12 Months: 18.5
Historical Average: 23.0
Percentile Rank of Last 12 Months ℹ️
High: 95th percentile
Low: 97th percentile
Rain: 3rd percentile
Change in Variance ℹ️
High: -36.5%
Low: -36.1%
Intraday: -82.8%
Data Coverage
68.9%
First Year of Data
1921
Station Location
Historical Weather Records
| Max High | Avg High | Min High | Max Avg | Avg Avg | Min Avg | Max Low | Avg Low | Min Low | Max Precipitation | Avg Precipitation | Max Snow | Avg Snow | |
|---|---|---|---|---|---|---|---|---|---|---|---|---|---|
| Record | 42.2 °C | — | 1.9 °C | 38.8 °C | — | 1.4 °C | 30.8 °C | — | -5.6 °C | 182.7 mm | — | — | — |
| January | 25.0 °C | 14.0 °C | 3.9 °C | 20.1 °C | 11.6 °C | 1.4 °C | 18.6 °C | 8.7 °C | -3.4 °C | 182.7 mm | 3.5 mm | — | — |
| February | 28.0 °C | 14.4 °C | 1.9 °C | 20.7 °C | 11.3 °C | 1.5 °C | 17.1 °C | 8.5 °C | -3.0 °C | 68.8 mm | 2.4 mm | — | — |
| March | 33.9 °C | 16.6 °C | 4.5 °C | 26.4 °C | 13.1 °C | 2.1 °C | 19.4 °C | 9.3 °C | -5.6 °C | 105.7 mm | 1.5 mm | — | — |
| April | 39.5 °C | 20.0 °C | 8.0 °C | 29.6 °C | 15.8 °C | 6.8 °C | 24.2 °C | 11.4 °C | -2.6 °C | 25.9 mm | 0.5 mm | — | — |
| May | 42.2 °C | 24.0 °C | 12.4 °C | 30.9 °C | 19.5 °C | 9.5 °C | 25.9 °C | 14.5 °C | 1.0 °C | 70.6 mm | 0.3 mm | — | — |
| June | 41.2 °C | 27.1 °C | 15.8 °C | 38.8 °C | 22.7 °C | 14.0 °C | 30.3 °C | 17.9 °C | 1.3 °C | 24.6 mm | 0.1 mm | — | — |
| July | 40.6 °C | 27.9 °C | 18.9 °C | 33.7 °C | 24.0 °C | 17.1 °C | 27.7 °C | 19.8 °C | 6.8 °C | 7.1 mm | 0.0 mm | — | — |
| August | 40.5 °C | 28.2 °C | 20.0 °C | 33.8 °C | 24.4 °C | 15.5 °C | 30.8 °C | 20.4 °C | 8.7 °C | 42.1 mm | 0.0 mm | — | — |
| September | 40.6 °C | 26.7 °C | 17.0 °C | 32.6 °C | 22.8 °C | 14.6 °C | 27.5 °C | 19.0 °C | 5.0 °C | 66.6 mm | 0.3 mm | — | — |
| October | 38.8 °C | 24.1 °C | 9.2 °C | 30.9 °C | 20.3 °C | 10.0 °C | 27.4 °C | 16.7 °C | 3.2 °C | 108.4 mm | 1.2 mm | — | — |
| November | 32.9 °C | 20.0 °C | 7.8 °C | 27.5 °C | 16.6 °C | 6.3 °C | 23.5 °C | 13.5 °C | -1.3 °C | 71.1 mm | 1.8 mm | — | — |
| December | 28.9 °C | 15.9 °C | 6.0 °C | 22.0 °C | 13.3 °C | 4.9 °C | 19.4 °C | 10.4 °C | -2.9 °C | 104.4 mm | 3.3 mm | — | — |
Data Visualisations
Remove WatermarksCurrent Year Climate Trends vs Historical

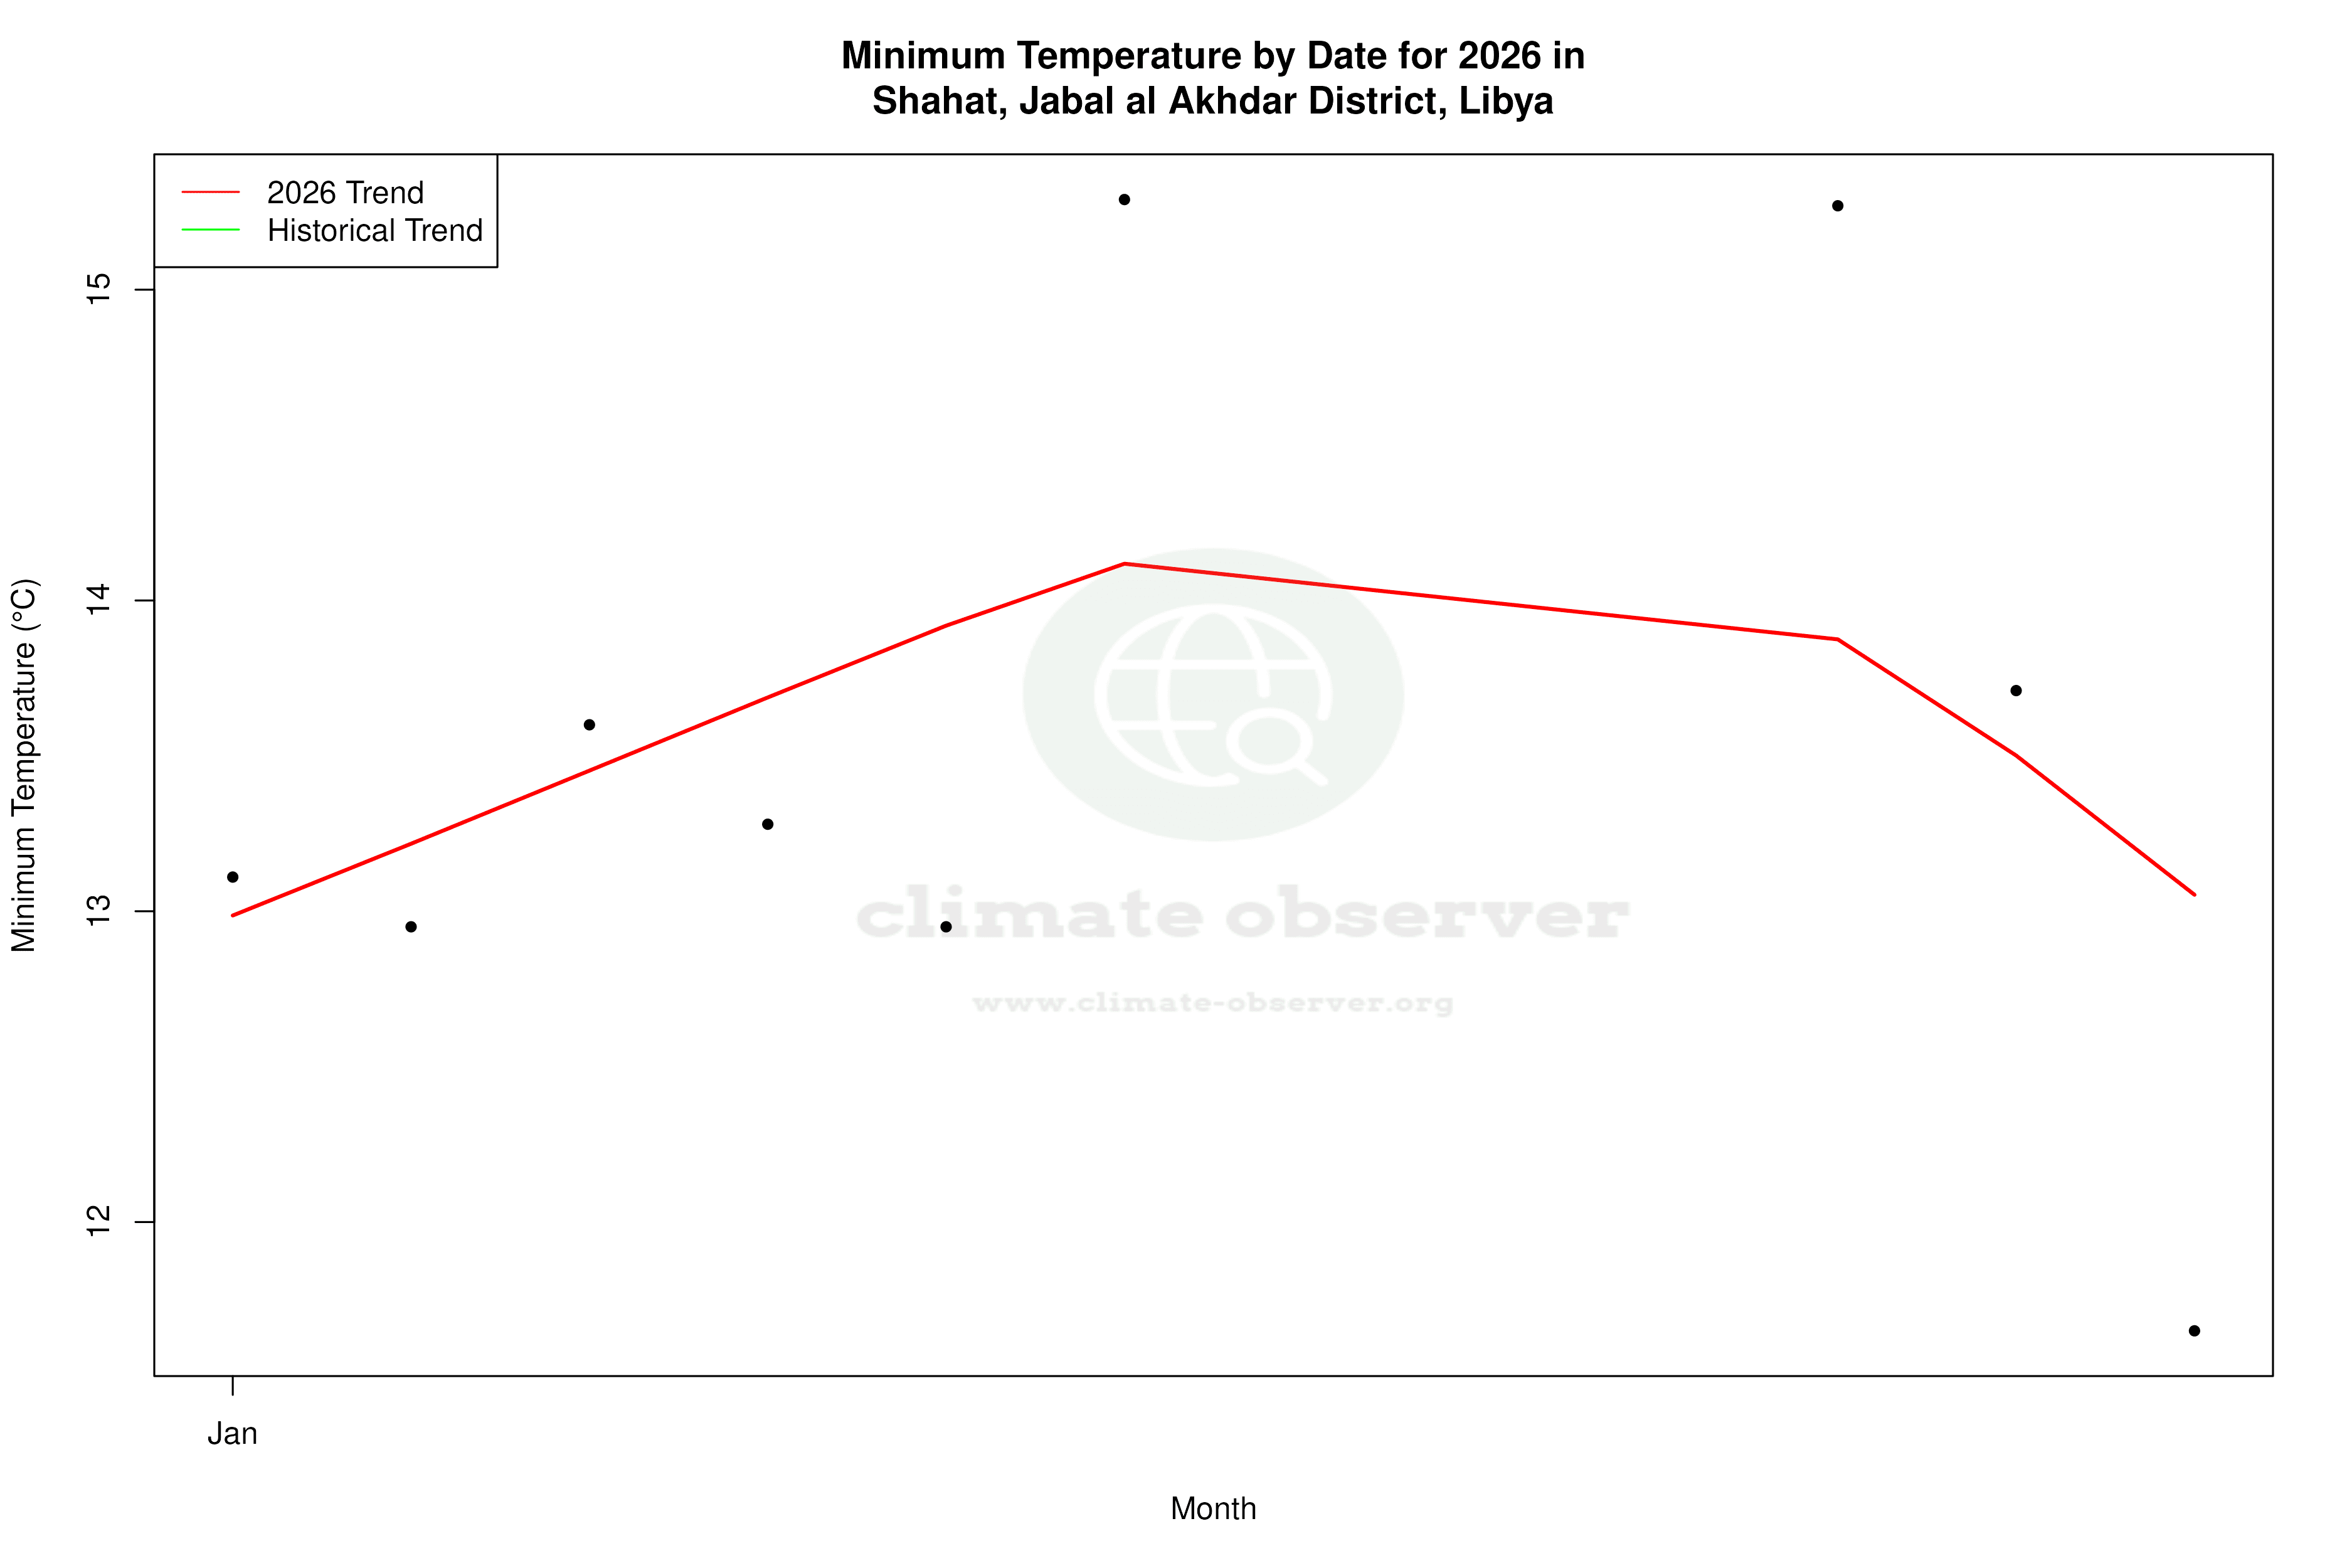


Max Temperature this Year | 1 of 6
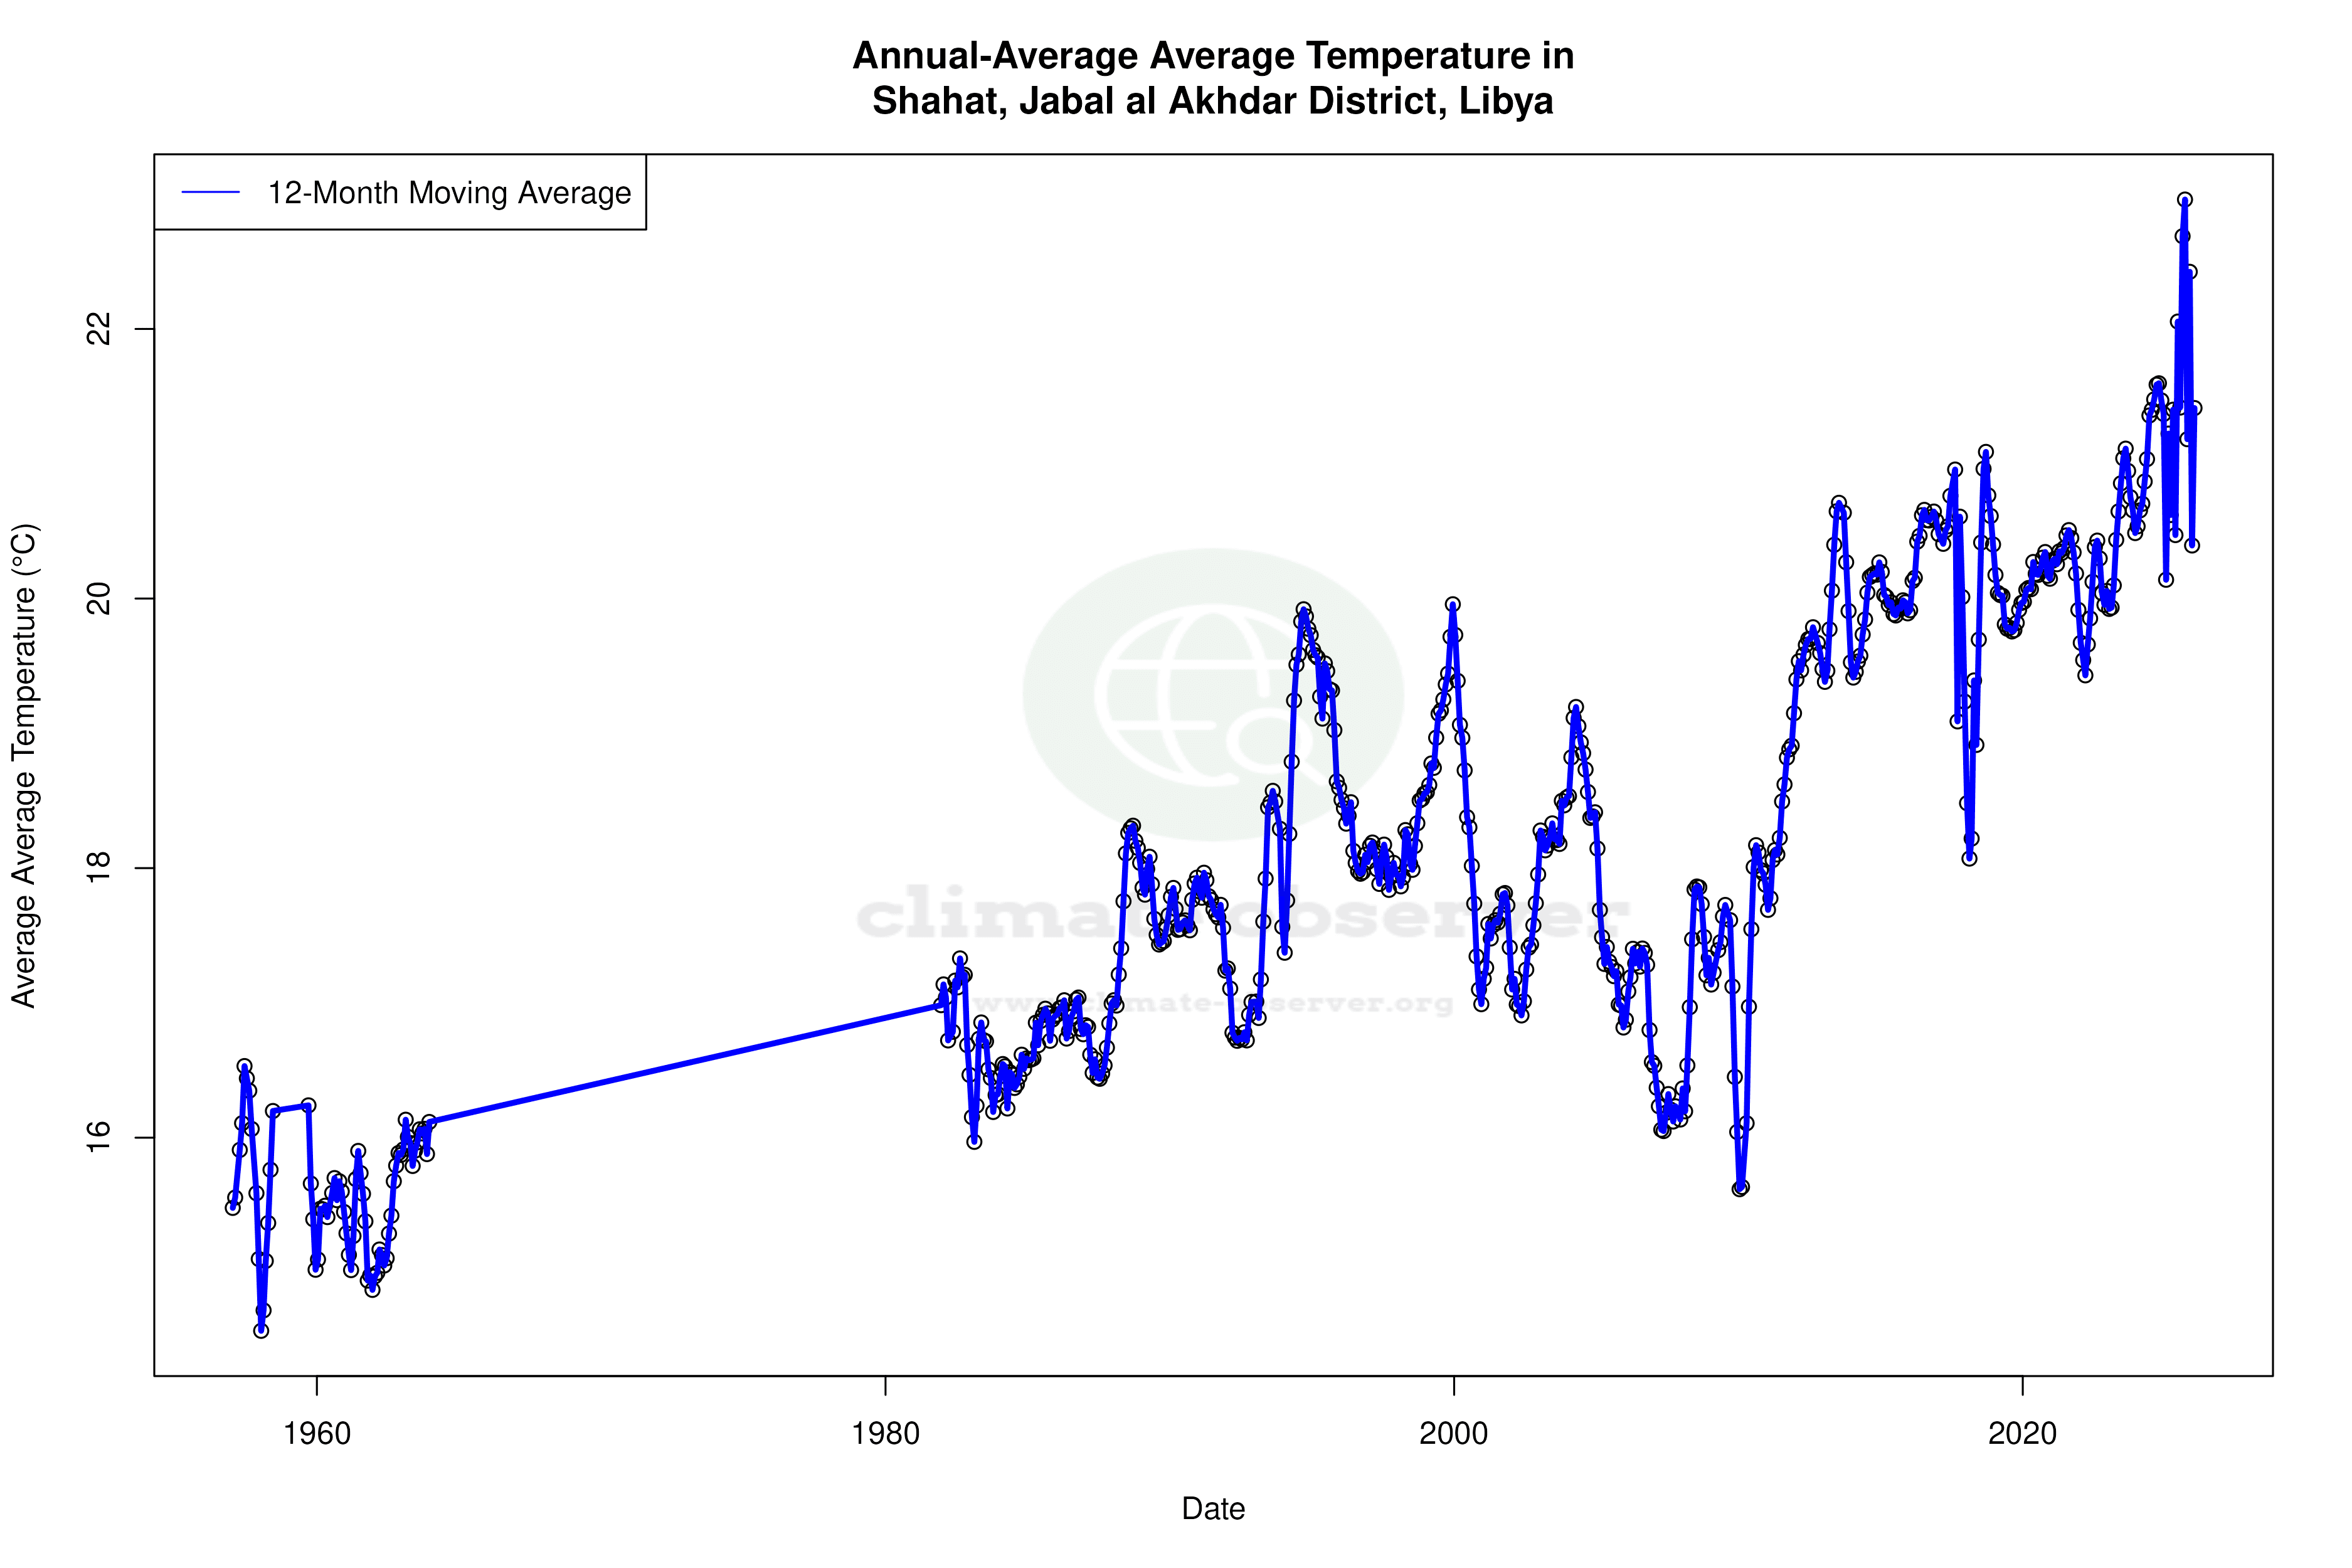
Climate 12-Month Moving Averages
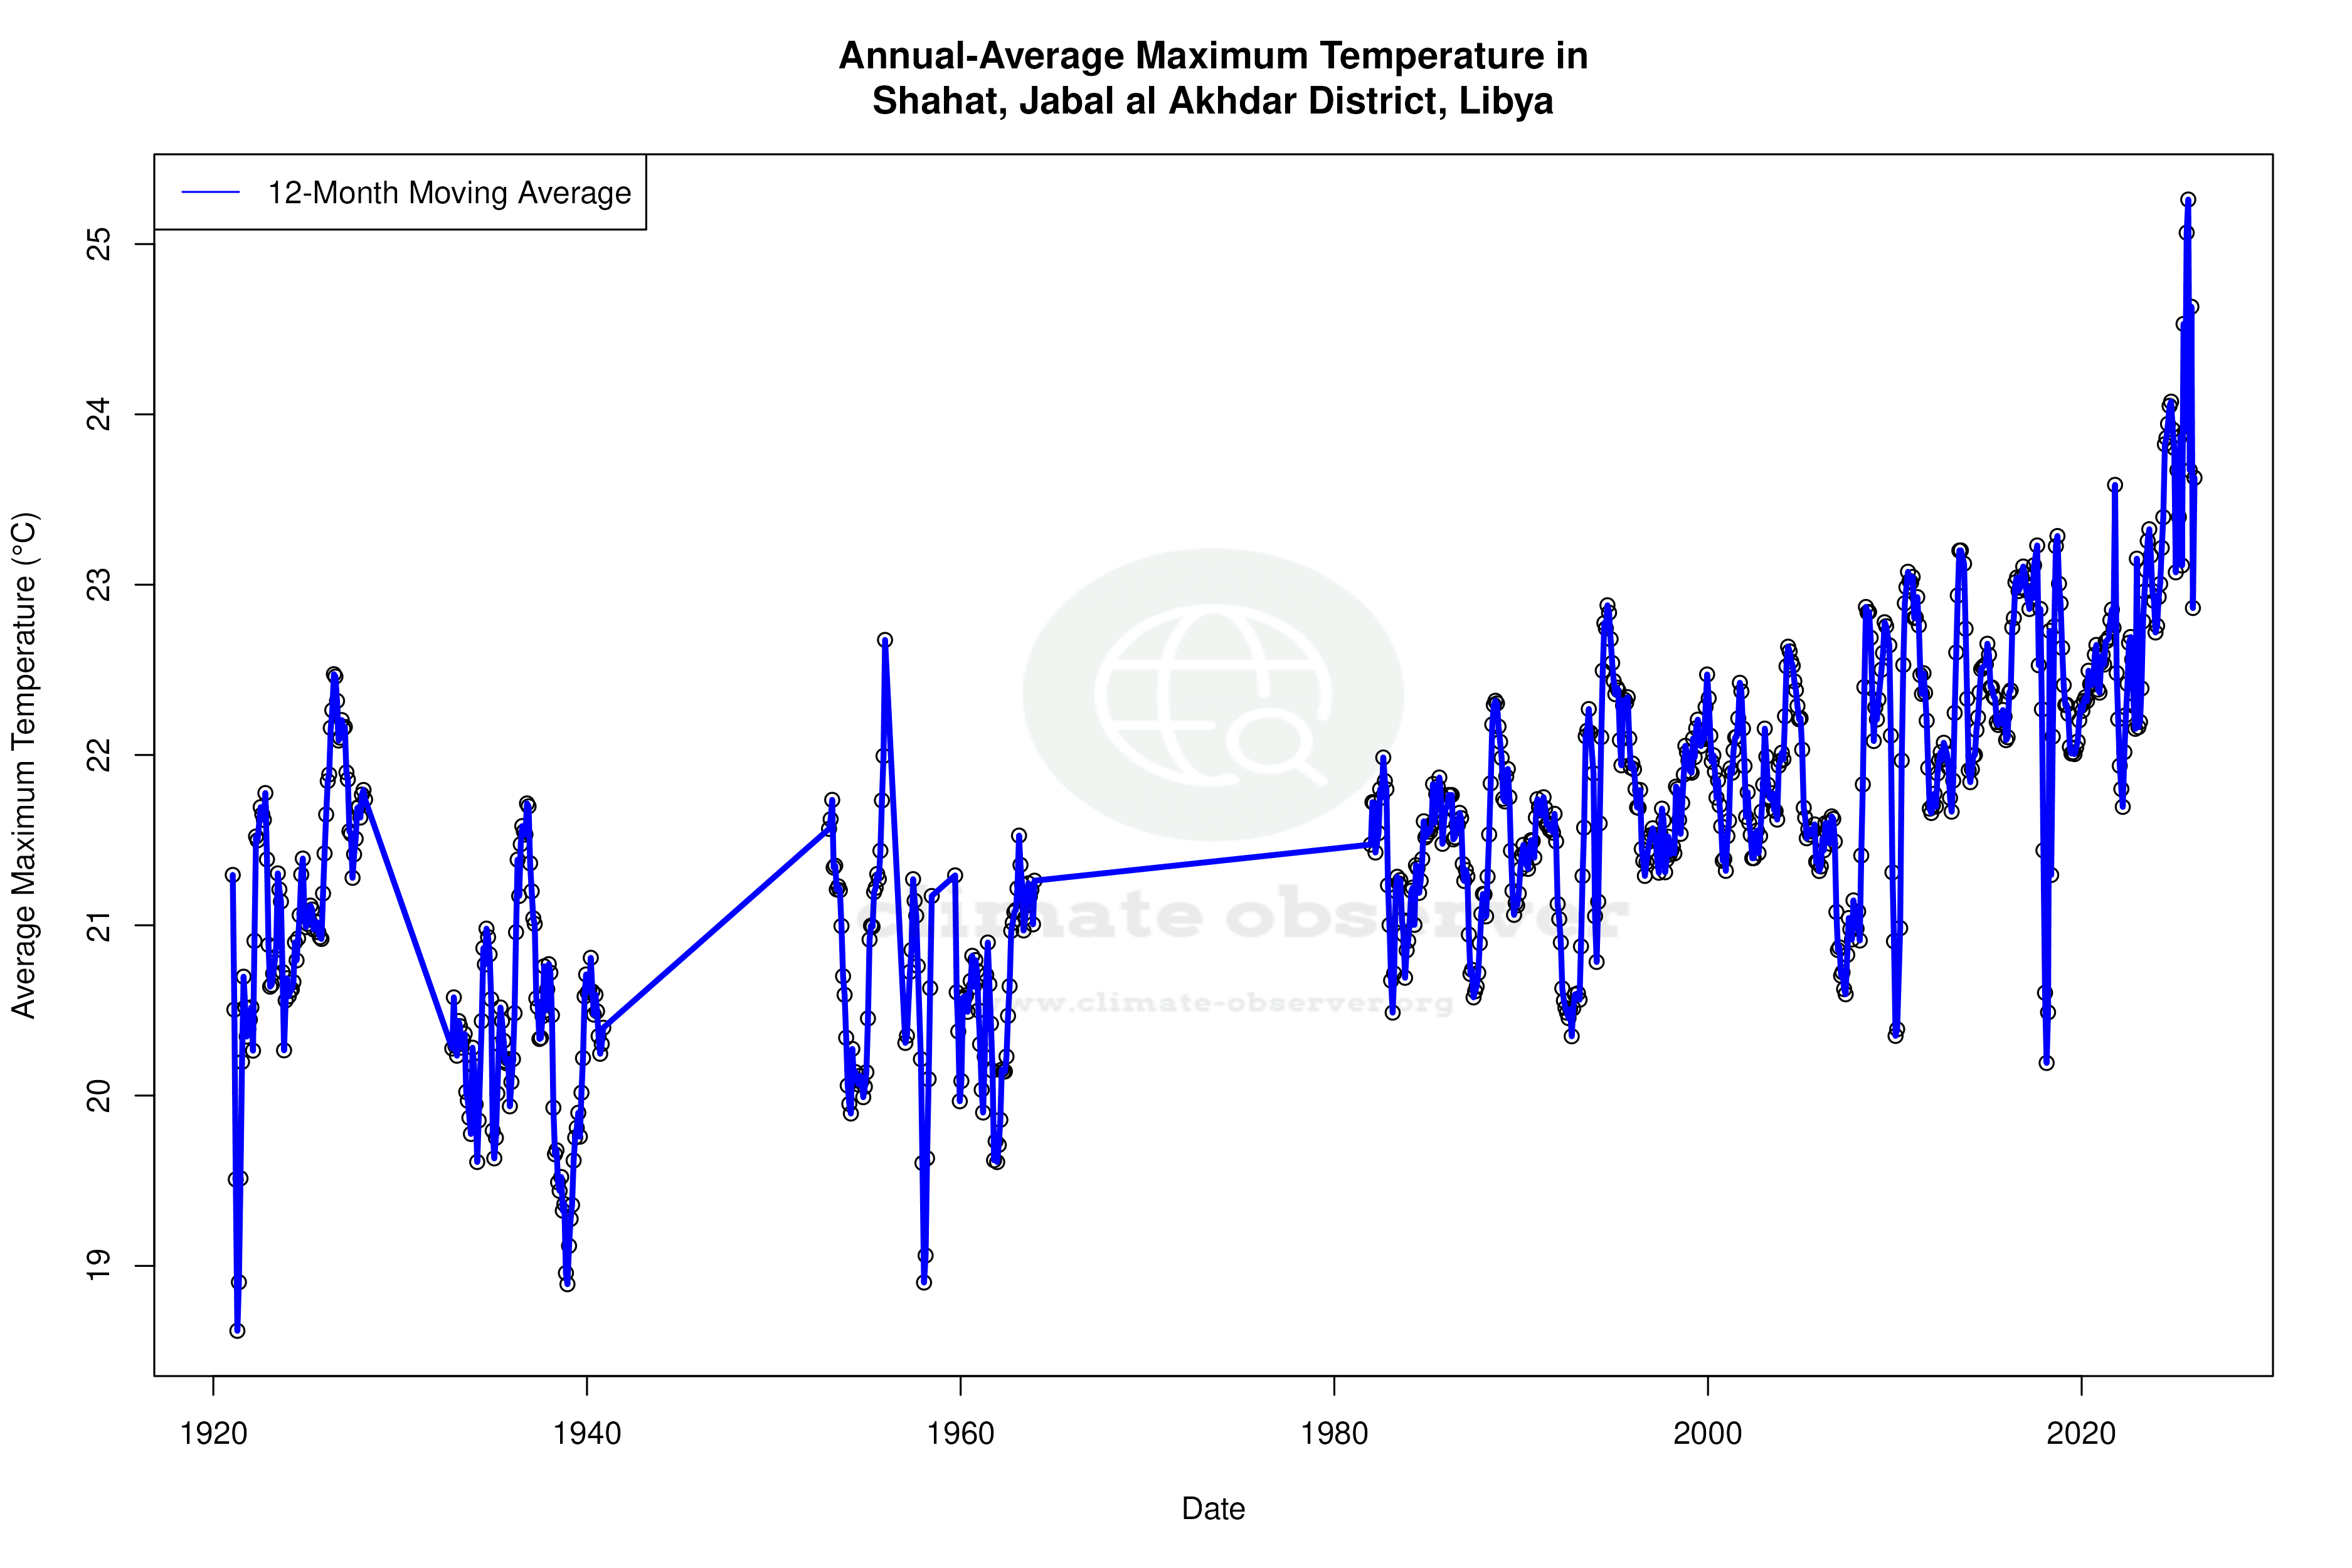
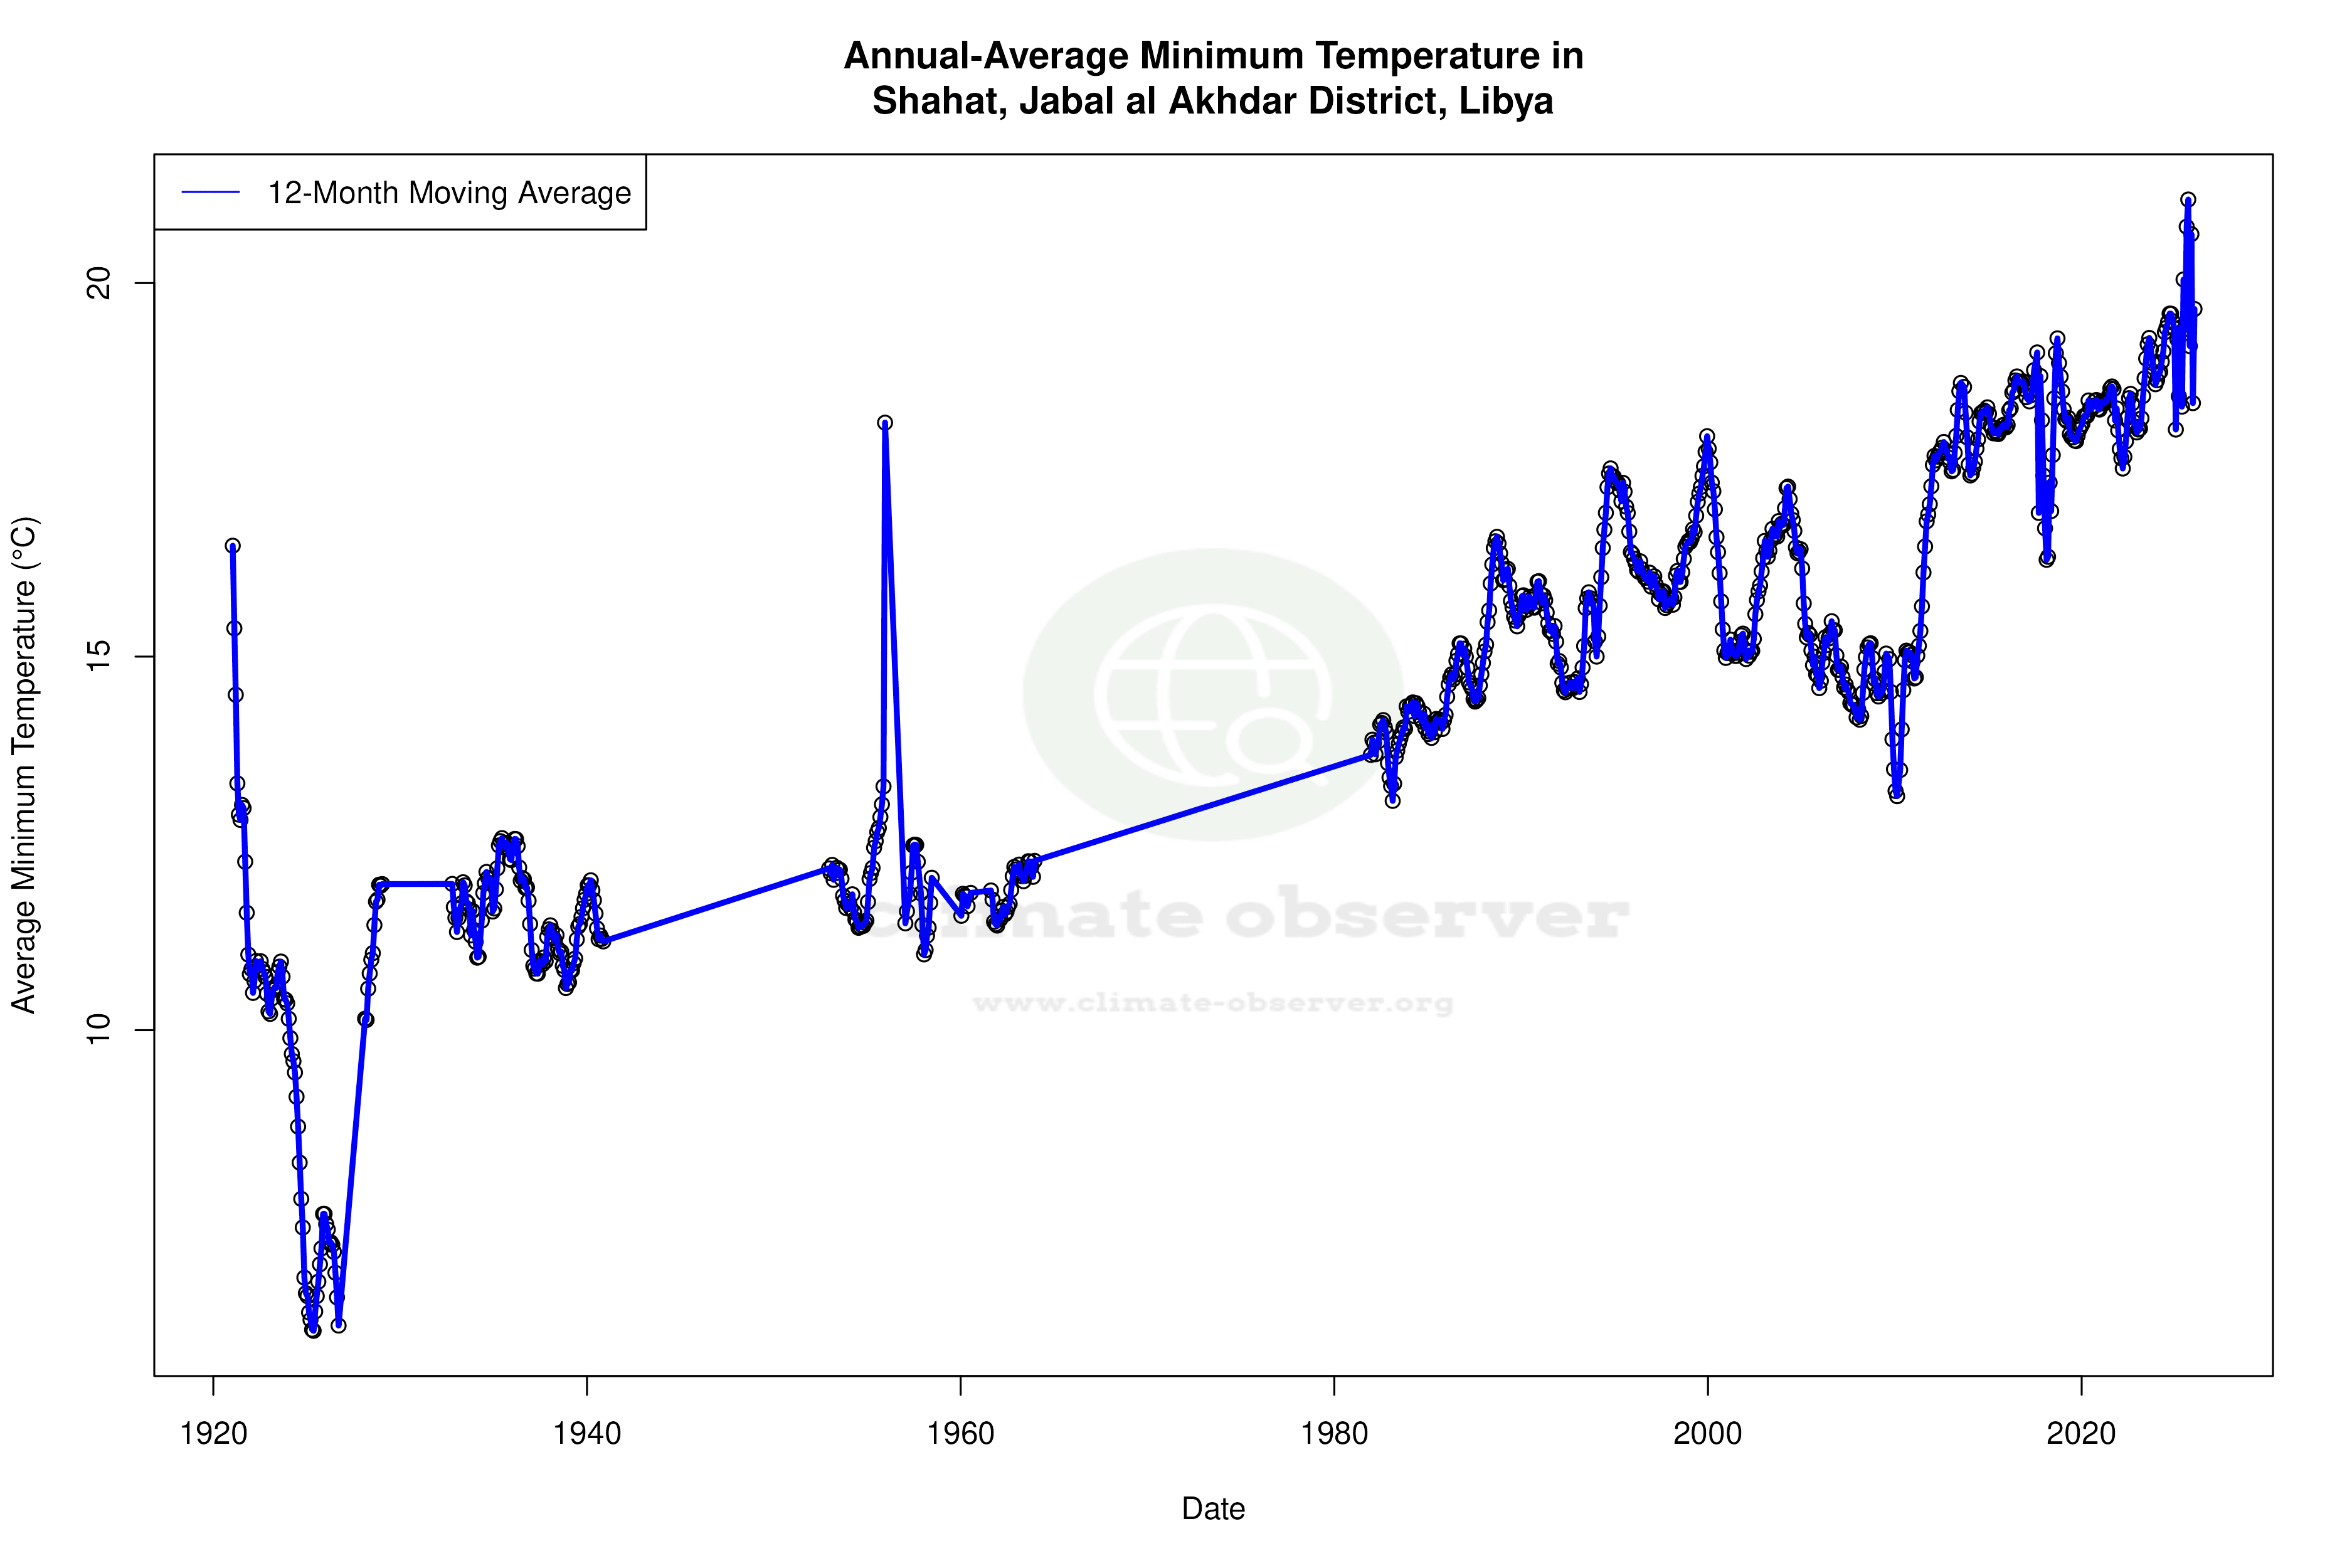


Max Temperature 12-Month MA | 1 of 6
Daily Data Points and Averages Throughout the Year


Average Max Temperature Throughout Year | 1 of 5
