Climate for Station: Ghadames East, Nalut District, Libya
Loading live weather...
Climate Analysis & Overview
Ghadames East exhibits a warming trend with temperatures rising significantly over the past decade. Precipitation events are becoming more concentrated, suggesting potential challenges for water management in this arid region. These changes are critical for Libya's climate resilience efforts.
Desert Climate Dynamics
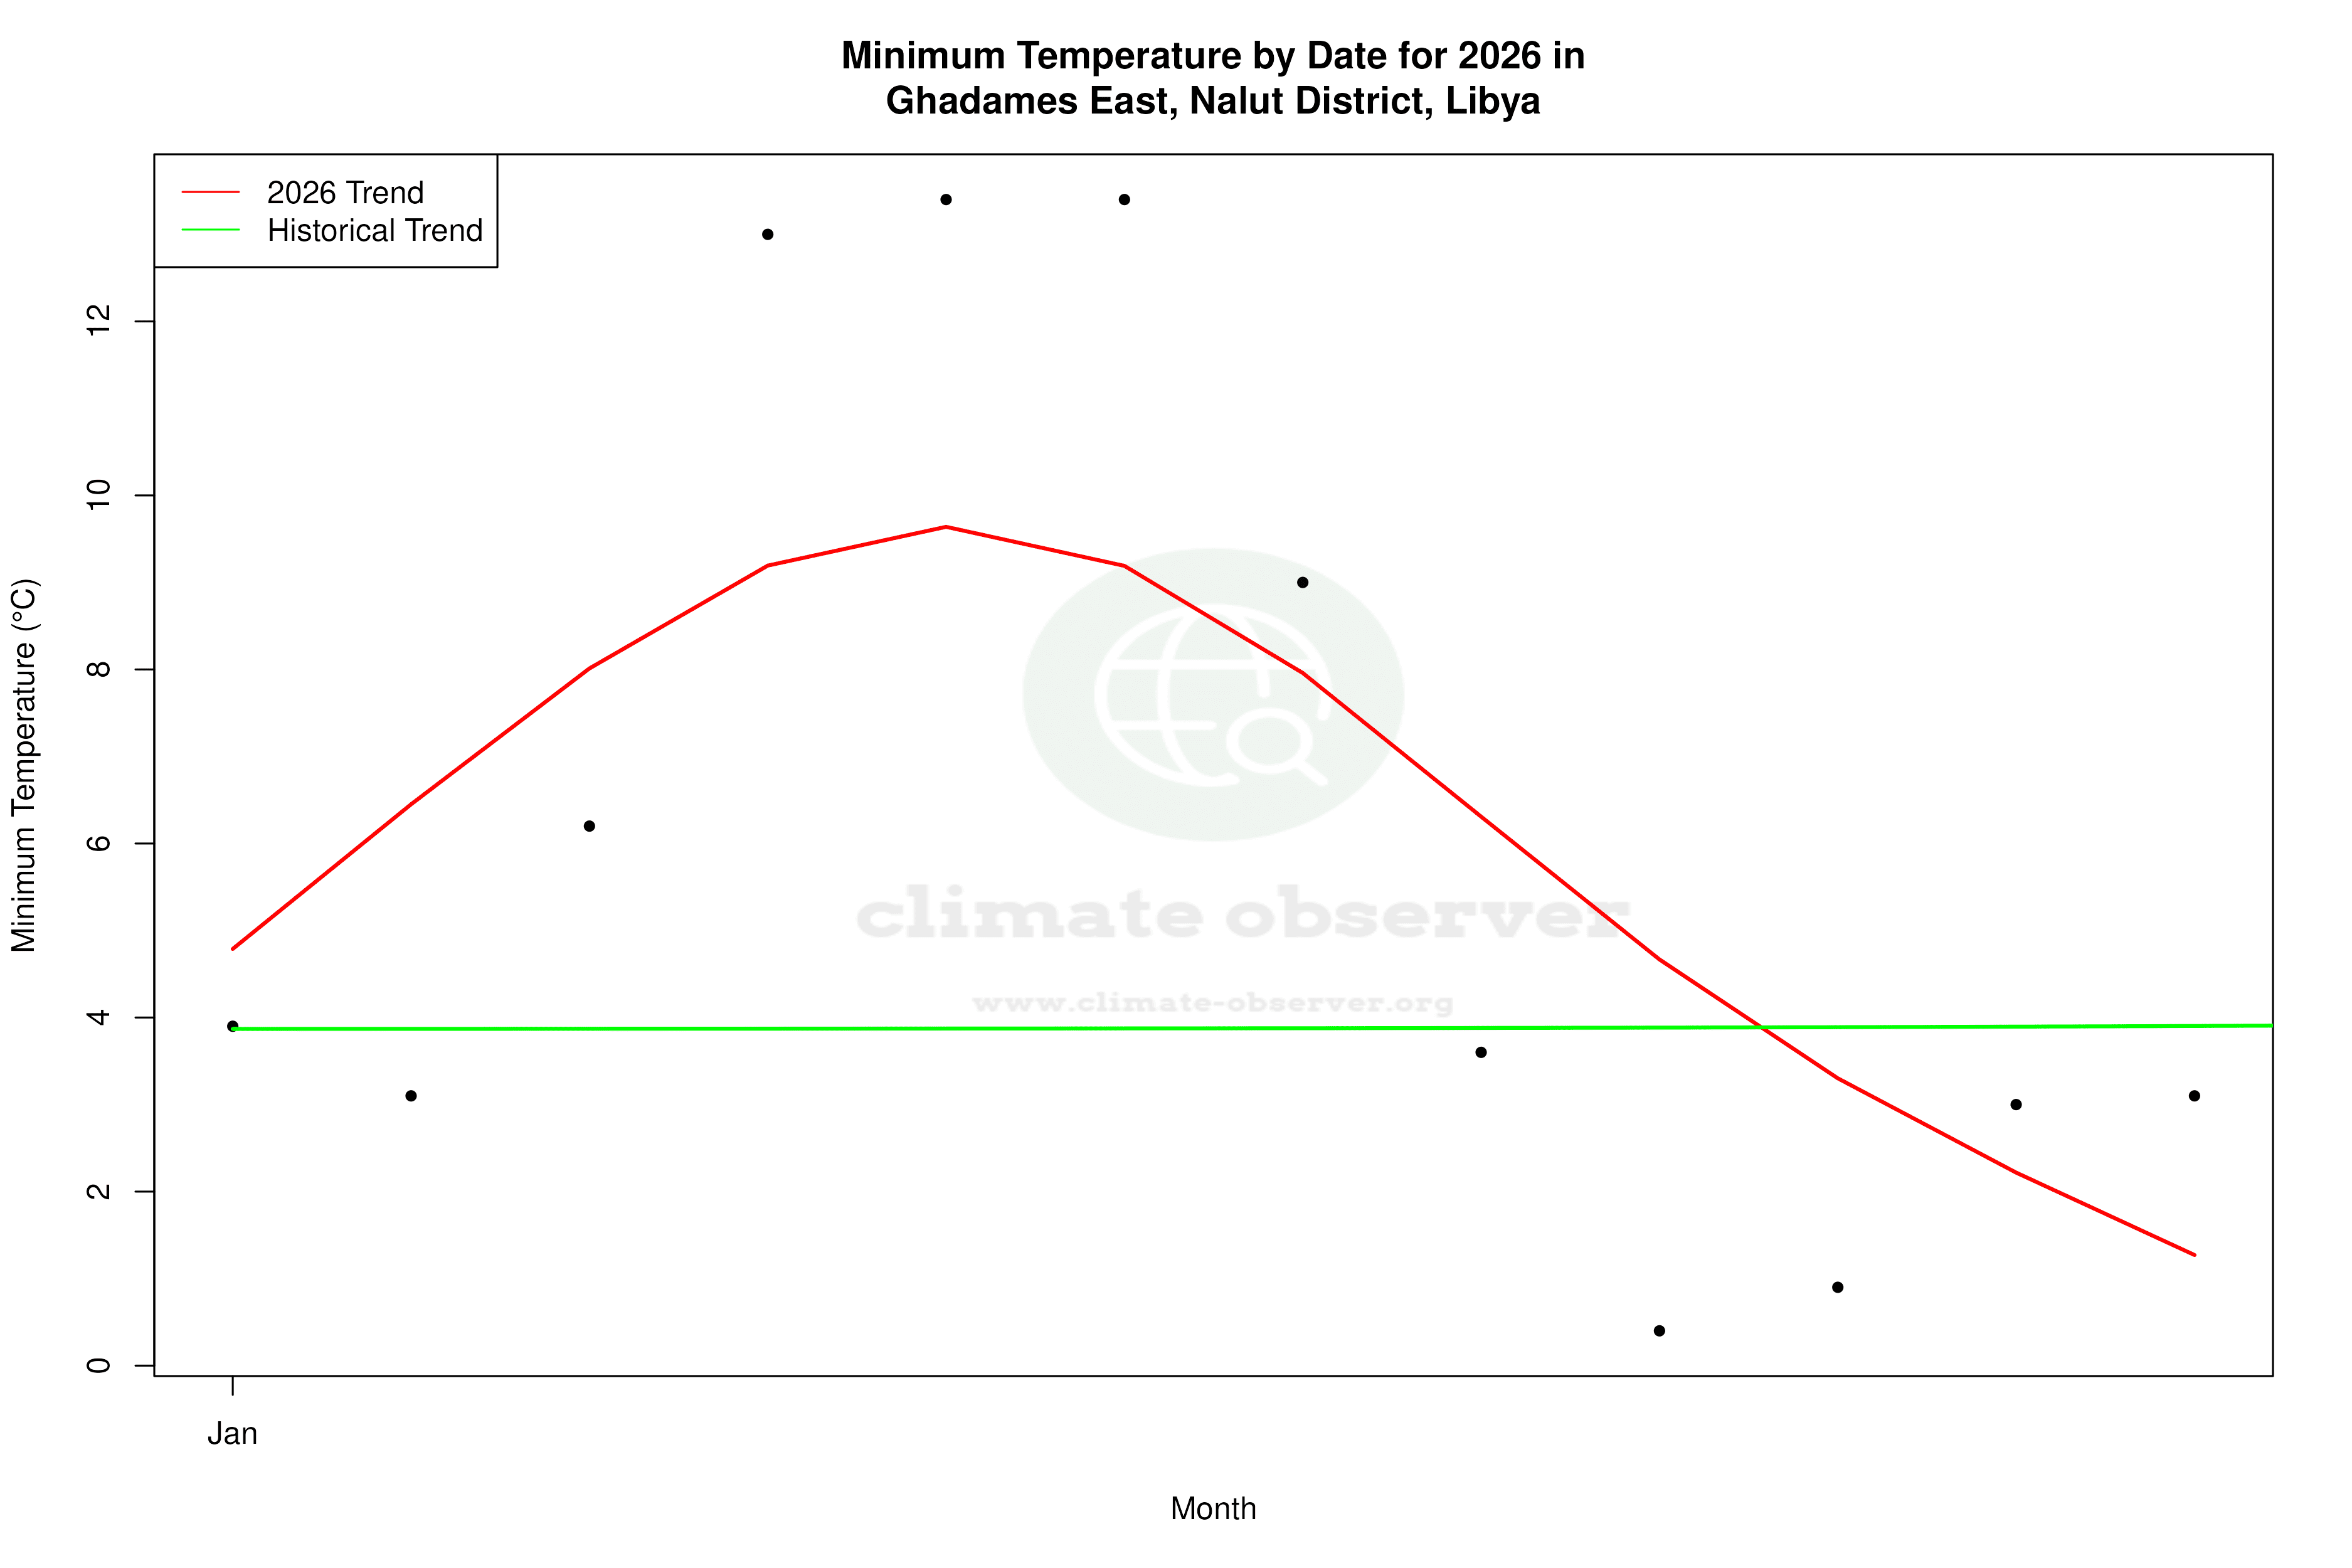
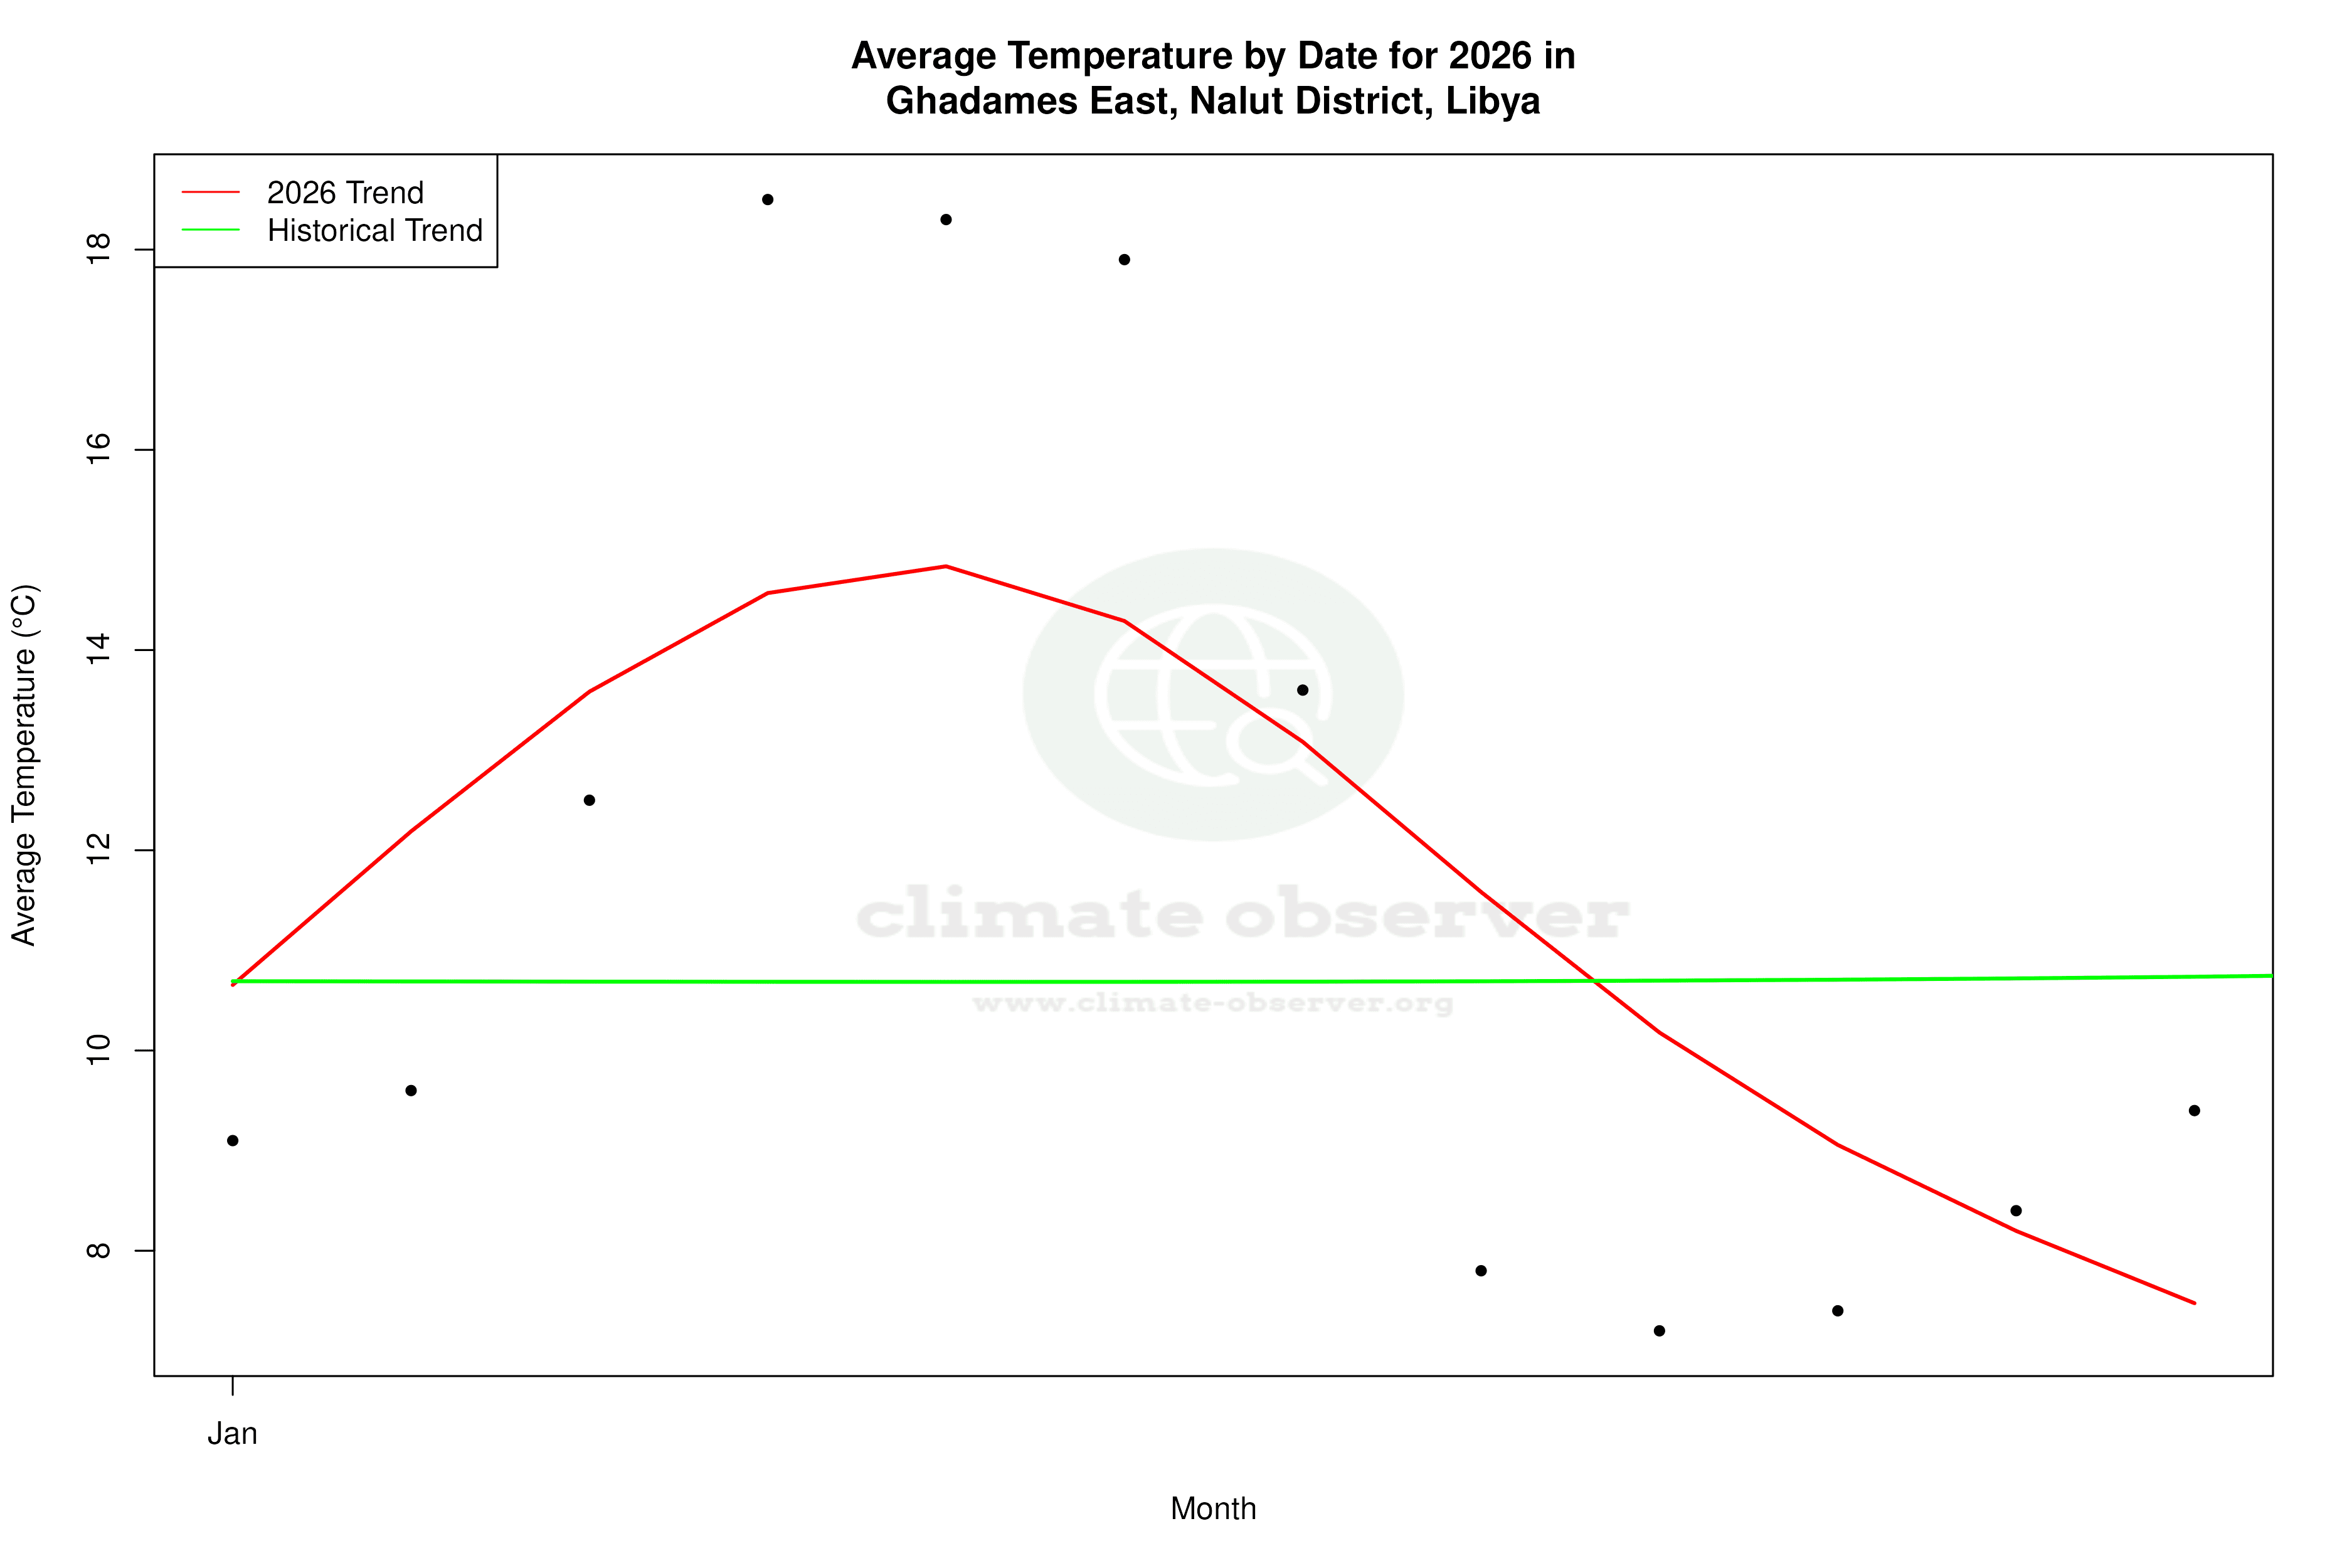
Ghadames East, located at 30.152, 9.715, is characterised by a desert climate under the Köppen classification. This region experiences extreme temperature variations, with recorded highs reaching 49.3°C (120.7°F) and lows plunging to -5.0°C (23.0°F). The vast desert landscape, with minimal vegetation and no significant water bodies, amplifies these temperature extremes. The all-time temperature trends indicate a warming, with highs increasing by 0.25°C (0.45°F) and lows by 0.41°C (0.74°F). This gradual rise suggests a long-term shift towards hotter conditions.
Decadal Warming Trends
Over the past decade, Ghadames East has seen a more pronounced warming trend. High temperatures have increased by 1.61°C (2.90°F), while low temperatures have risen by 2.33°C (4.19°F). This accelerated warming over the last ten years is significant when compared to the all-time trends. Such rapid changes may impact local ecosystems and human activities, necessitating adaptive measures in line with Libya's regional climate goals.
Precipitation Patterns Intensify
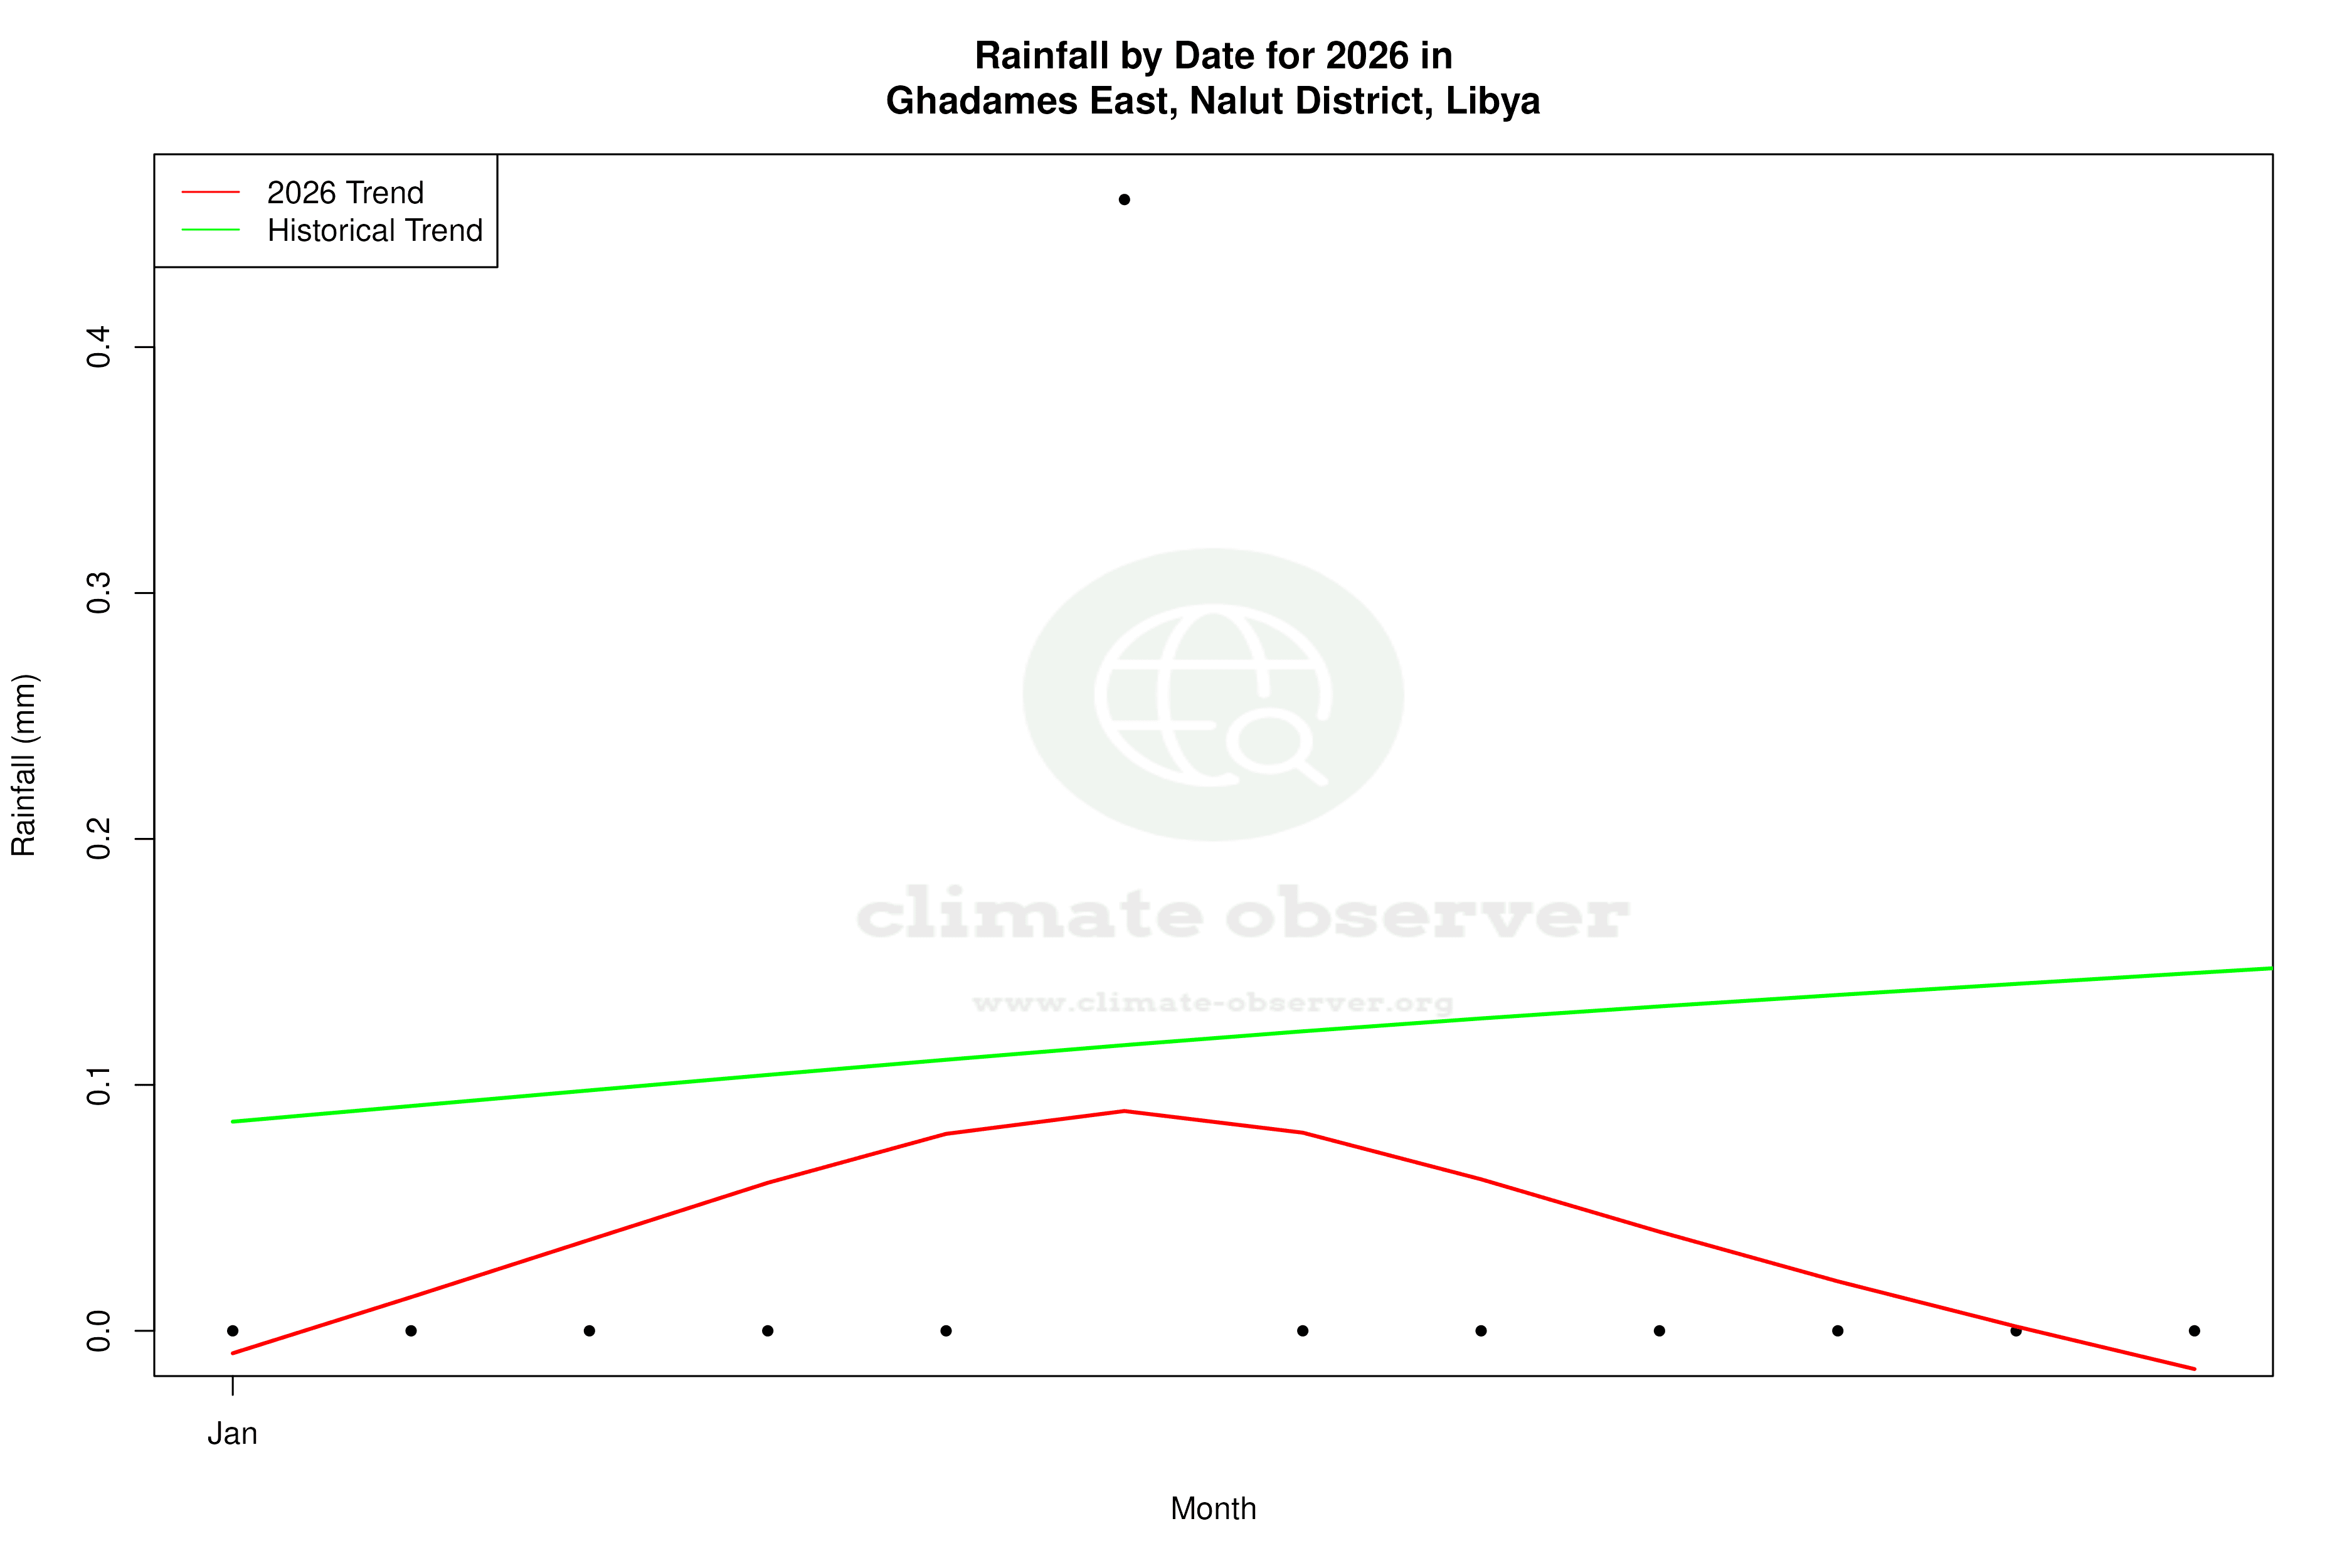
The Precipitation Concentration Index (PCI) for Ghadames East has risen from a baseline of 29.3 to a current value of 32.0. The PCI measures how precipitation is distributed over time, with higher values indicating more concentrated rainfall events. This increase suggests that rain is becoming more sporadic, occurring in fewer, more intense events. In a desert environment, such concentrated precipitation can lead to flash floods and challenges in water resource management, highlighting the need for improved infrastructure and planning.
Temperature Extremes and Implications
The extreme temperatures recorded in Ghadames East underscore the harshness of its desert climate. With highs reaching 49.3°C (120.7°F), the region faces severe heat stress, impacting both human health and local agriculture. The low of -5.0°C (23.0°F), though rare, illustrates the potential for cold snaps that can disrupt daily life. These extremes necessitate robust adaptation strategies to mitigate the impacts of such temperature fluctuations.
Regional Climate Considerations
Libya's broader climate strategy must account for the unique challenges faced by regions like Ghadames East. The observed trends in temperature and precipitation concentration are critical for informing policy and planning. As Libya seeks to enhance its climate resilience, understanding these localised patterns will be essential in crafting effective responses to the evolving climate landscape.
Station Statistics
10-Year Trend
High: +1.61 °C/decade
Low: +2.33 °C/decade
Rain: -0.12 mm/decade
25-Year Trend
High: +0.22 °C/decade
Low: +0.55 °C/decade
Rain: -0.03 mm/decade
50-Year Trend
High: +0.26 °C/decade
Low: +0.40 °C/decade
Rain: -0.00 mm/decade
All-Time Trend
High: +0.25 °C/decade
Low: +0.41 °C/decade
Rain: -0.00 mm/decade
Percentage Above-Average Days
Last 12 Months: 55.3%
This Year: 60.5%
Precipitation Concentration Index (PCI) ℹ️
Last 12 Months: 48.3
Historical Average: 35.2
Percentile Rank of Last 12 Months ℹ️
High: 85th percentile
Low: 99th percentile
Rain: 15th percentile
Change in Variance ℹ️
High: +0.2%
Low: +5.0%
Intraday: -20.8%
Data Coverage
83.1%
First Year of Data
1961
Station Location
Historical Weather Records
| Max High | Avg High | Min High | Max Avg | Avg Avg | Min Avg | Max Low | Avg Low | Min Low | Max Precipitation | Avg Precipitation | Max Snow | Avg Snow | |
|---|---|---|---|---|---|---|---|---|---|---|---|---|---|
| Record | 49.3 °C | — | 6.0 °C | 43.0 °C | — | 0.5 °C | 36.0 °C | — | -5.0 °C | 47.0 mm | — | — | — |
| January | 33.5 °C | 17.6 °C | 6.8 °C | 26.9 °C | 11.1 °C | 0.5 °C | 20.7 °C | 4.1 °C | -4.8 °C | 21.9 mm | 0.1 mm | — | — |
| February | 37.9 °C | 20.3 °C | 6.0 °C | 28.0 °C | 13.8 °C | 2.9 °C | 19.6 °C | 6.0 °C | -3.5 °C | 10.2 mm | 0.1 mm | — | — |
| March | 38.8 °C | 24.8 °C | 10.7 °C | 31.7 °C | 18.0 °C | 4.7 °C | 24.0 °C | 9.7 °C | -1.1 °C | 36.3 mm | 0.2 mm | — | — |
| April | 42.5 °C | 30.2 °C | 14.0 °C | 34.6 °C | 23.0 °C | 9.6 °C | 29.9 °C | 14.4 °C | 2.0 °C | 11.7 mm | 0.1 mm | — | — |
| May | 48.0 °C | 35.0 °C | 16.5 °C | 41.4 °C | 28.0 °C | 13.9 °C | 32.0 °C | 19.1 °C | 7.2 °C | 37.7 mm | 0.1 mm | — | — |
| June | 48.2 °C | 39.7 °C | 22.2 °C | 43.0 °C | 32.6 °C | 19.9 °C | 36.0 °C | 23.3 °C | 12.8 °C | 6.4 mm | 0.0 mm | — | — |
| July | 47.9 °C | 41.0 °C | 31.0 °C | 42.7 °C | 33.8 °C | 23.9 °C | 32.6 °C | 24.3 °C | 14.3 °C | 0.3 mm | 0.0 mm | — | — |
| August | 49.3 °C | 40.3 °C | 31.6 °C | 42.1 °C | 33.3 °C | 24.2 °C | 32.2 °C | 24.1 °C | 15.0 °C | 4.1 mm | 0.0 mm | — | — |
| September | 46.0 °C | 37.2 °C | 25.0 °C | 40.3 °C | 30.3 °C | 18.8 °C | 31.0 °C | 22.1 °C | 10.0 °C | 47.0 mm | 0.1 mm | — | — |
| October | 43.6 °C | 31.2 °C | 18.0 °C | 33.4 °C | 24.4 °C | 13.4 °C | 27.4 °C | 16.8 °C | 2.2 °C | 33.9 mm | 0.2 mm | — | — |
| November | 38.0 °C | 24.1 °C | 10.0 °C | 31.3 °C | 17.4 °C | 7.8 °C | 23.6 °C | 10.3 °C | -2.2 °C | 14.1 mm | 0.1 mm | — | — |
| December | 33.0 °C | 18.5 °C | 8.7 °C | 23.3 °C | 12.0 °C | 2.7 °C | 18.6 °C | 5.5 °C | -5.0 °C | 18.6 mm | 0.2 mm | — | — |
Data Visualisations
Remove WatermarksCurrent Year Climate Trends vs Historical


Max Temperature this Year | 1 of 6
Climate 12-Month Moving Averages


Max Temperature 12-Month MA | 1 of 6
Daily Data Points and Averages Throughout the Year
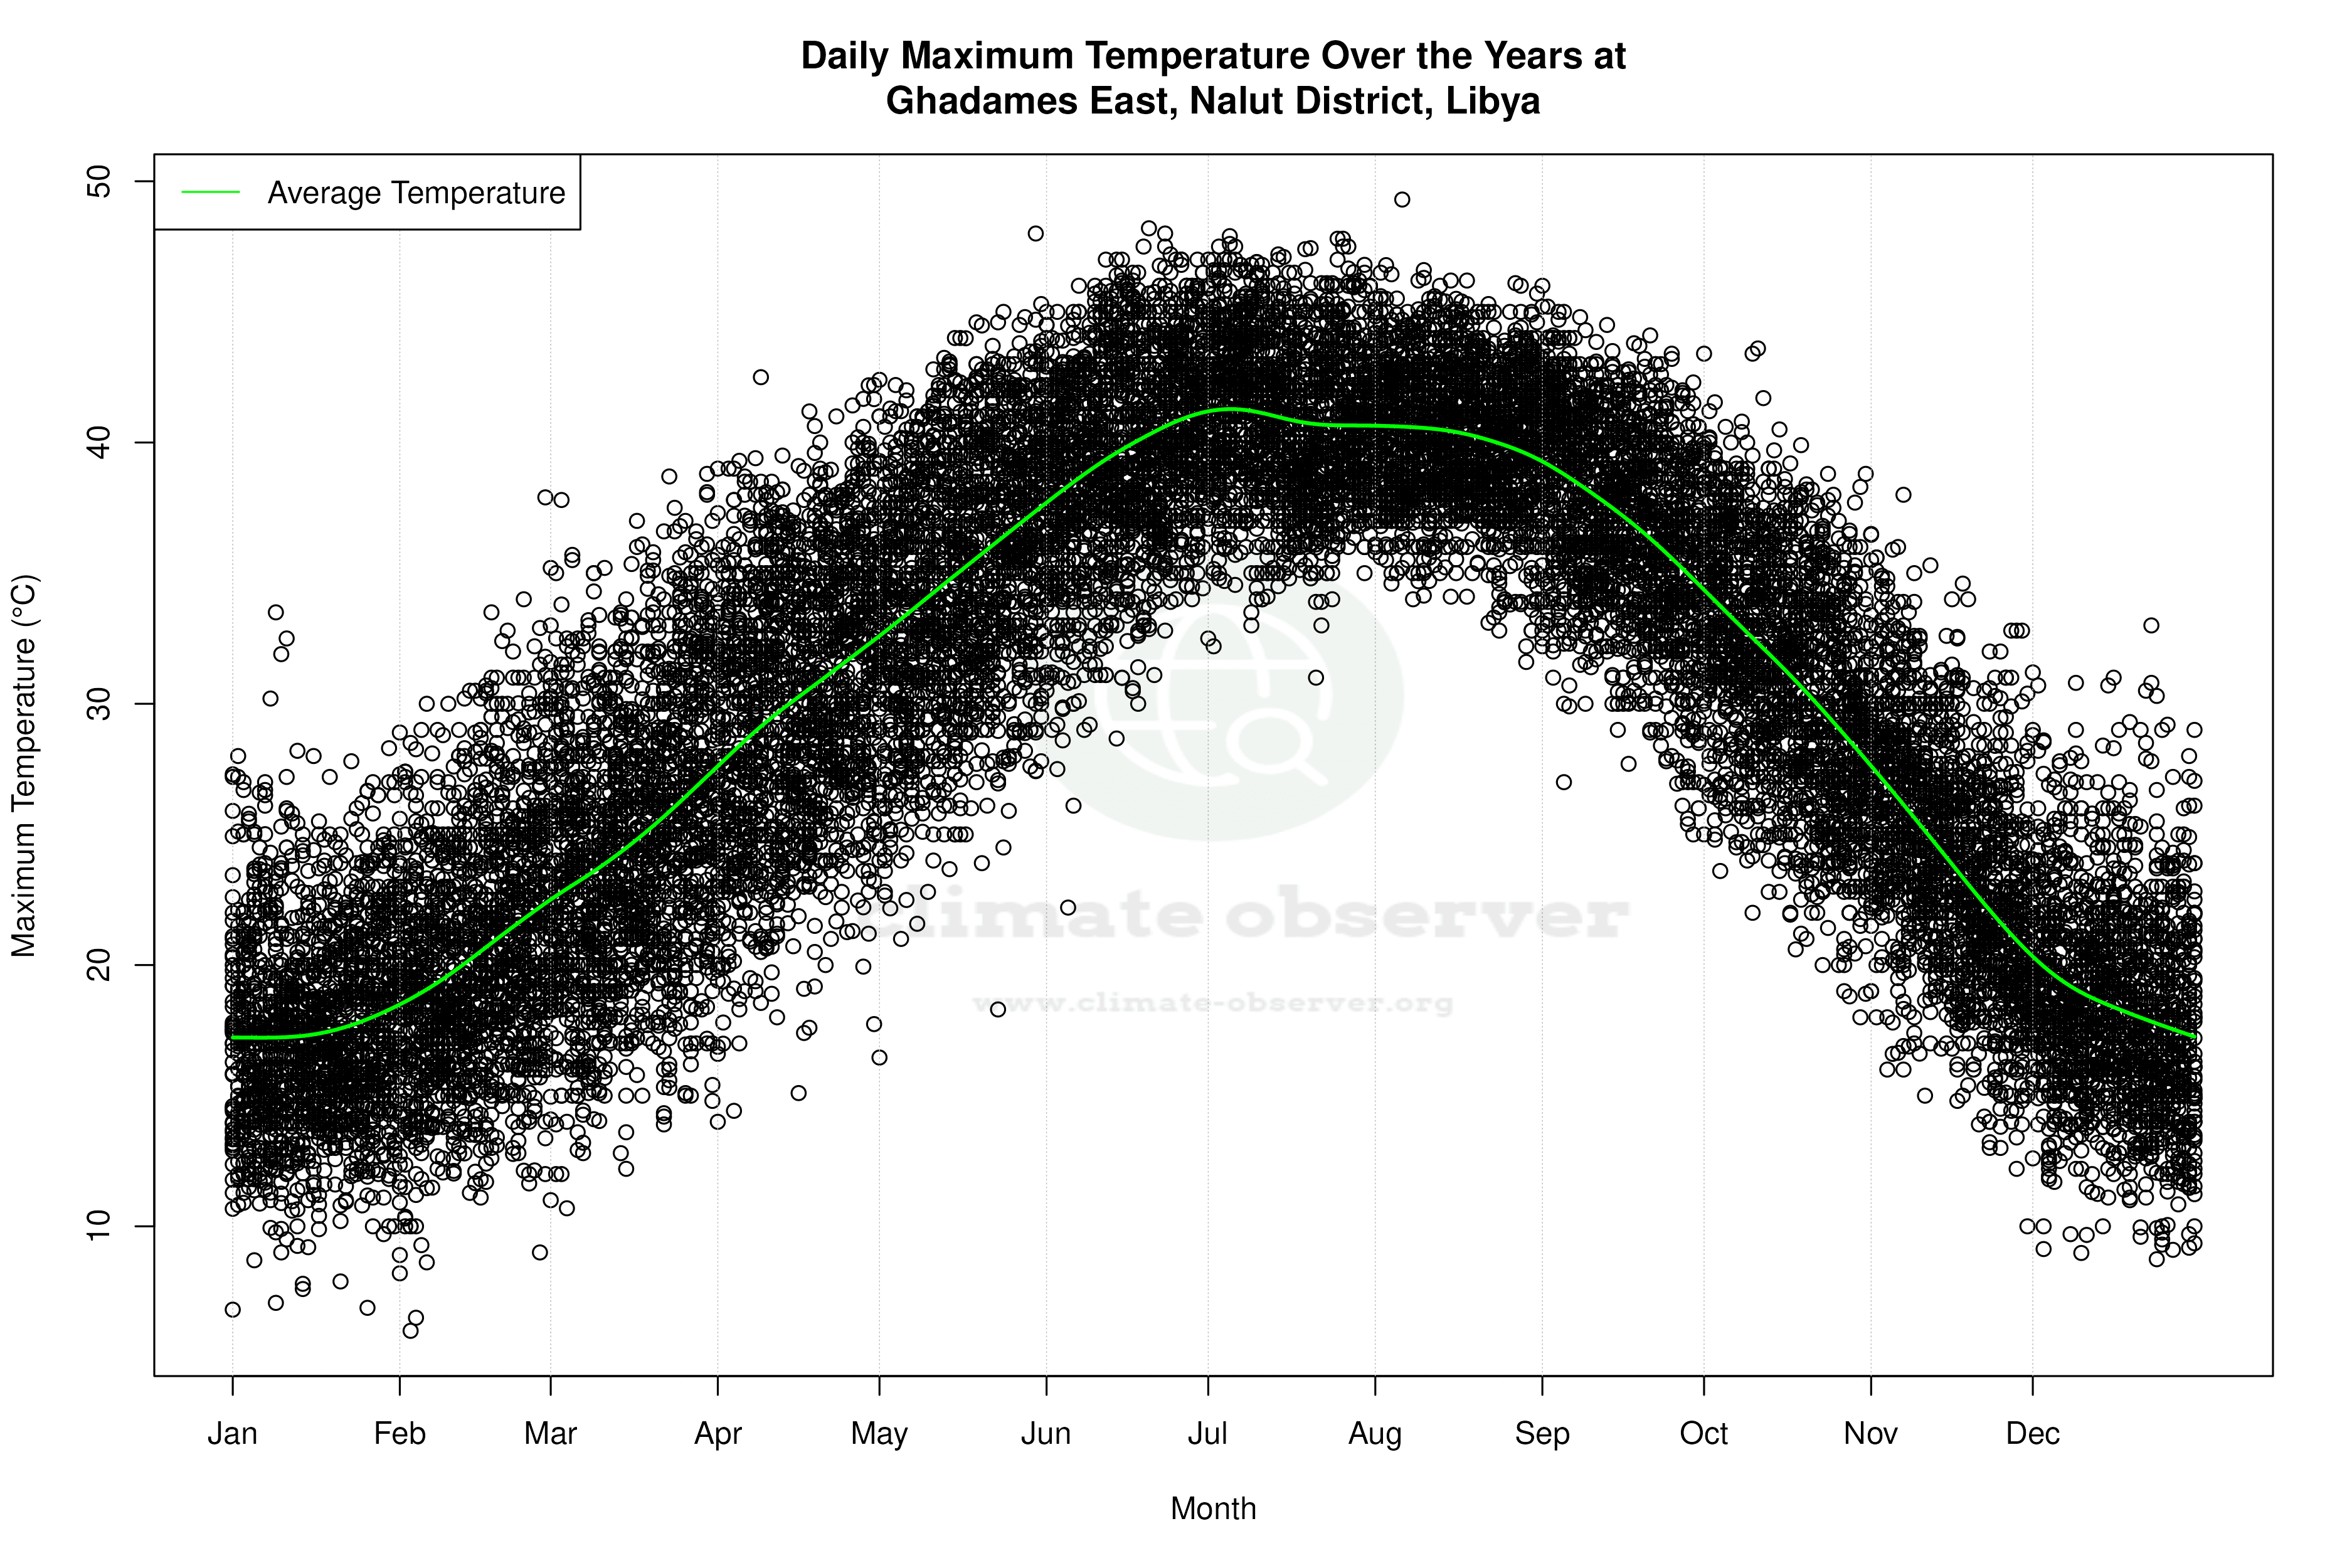


Average Max Temperature Throughout Year | 1 of 5
