Climate for Station: Gariat El-Sharghia, Al Jabal al Gharbi District, Libya
Loading live weather...
Climate Analysis & Overview
Gariat El-Sharghia, located in the western mountains of Libya, is experiencing a nuanced climate evolution. Over the past decade, the region has seen a cooling in high temperatures while low temperatures have risen. Precipitation patterns are becoming slightly more evenly distributed, indicating shifts in local weather dynamics.
Geographical and Climatic Context
Situated at 30.383°N, 13.583°E, Gariat El-Sharghia is nestled within the Western Mountain range of Libya, a region characterised by its arid desert climate, classified as BWh under the Köppen climate classification. The local geography, dominated by rugged terrain and limited vegetation, plays a significant role in shaping the area's climate, often resulting in extreme temperature variations between day and night.
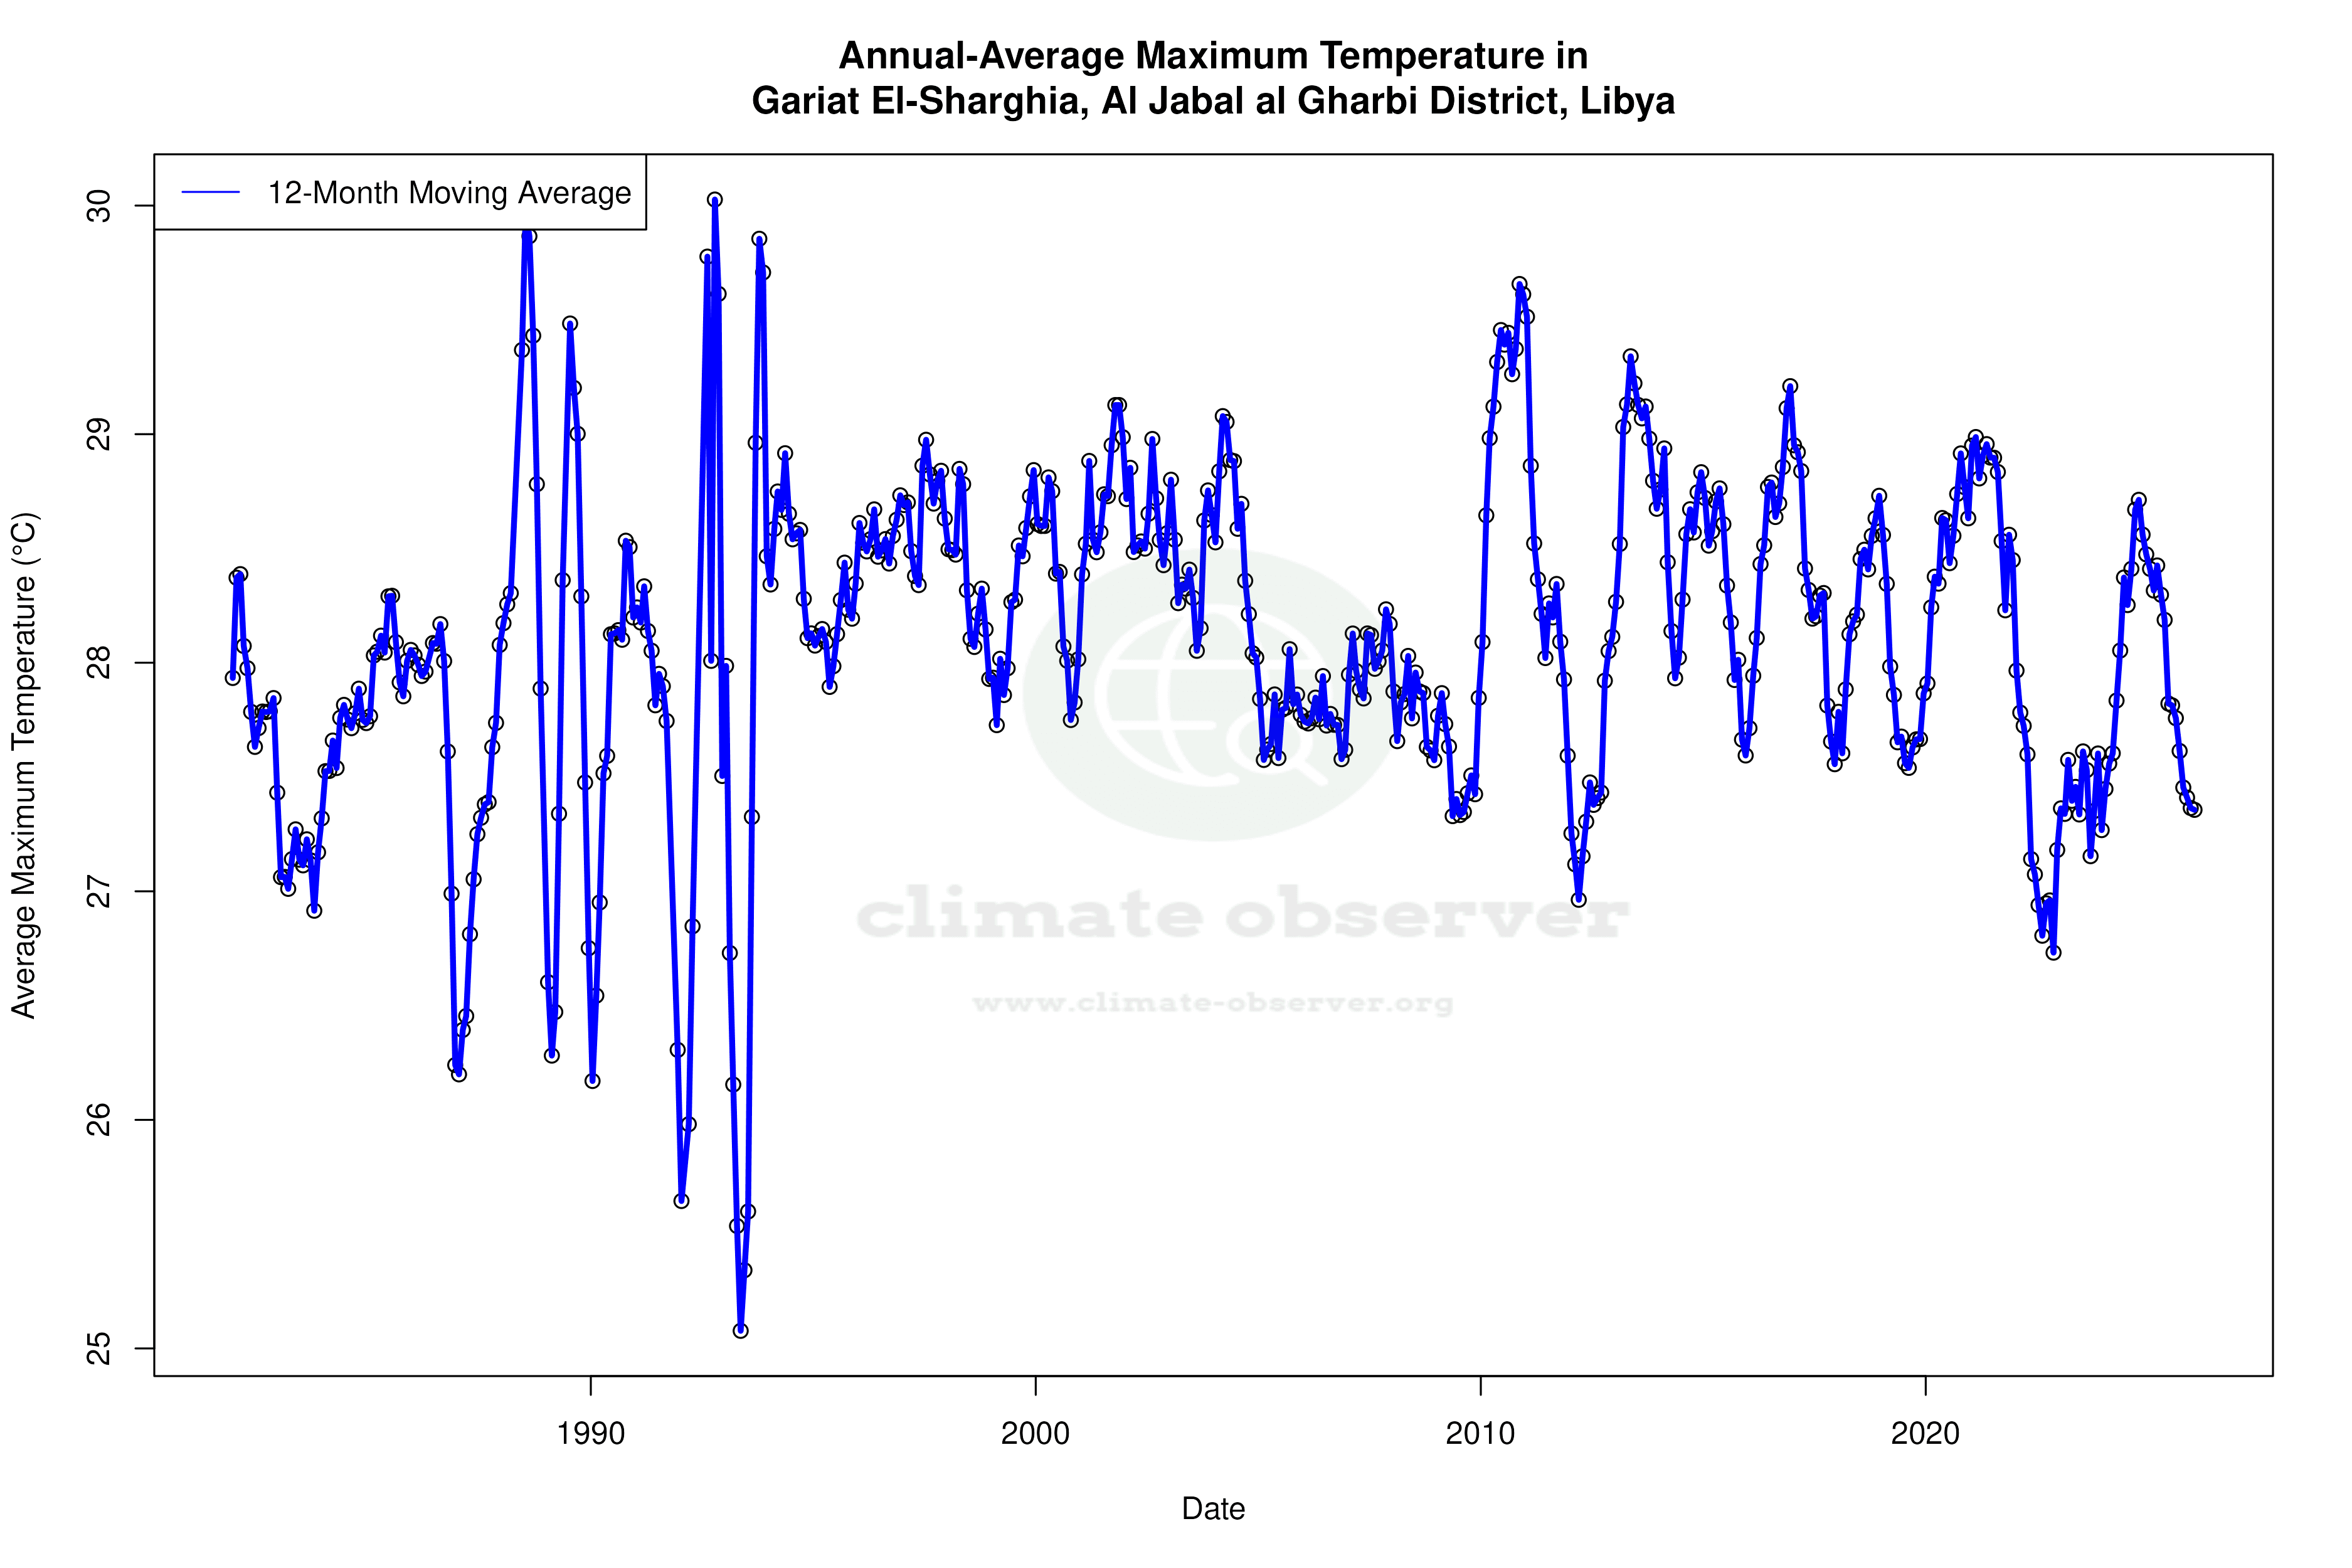
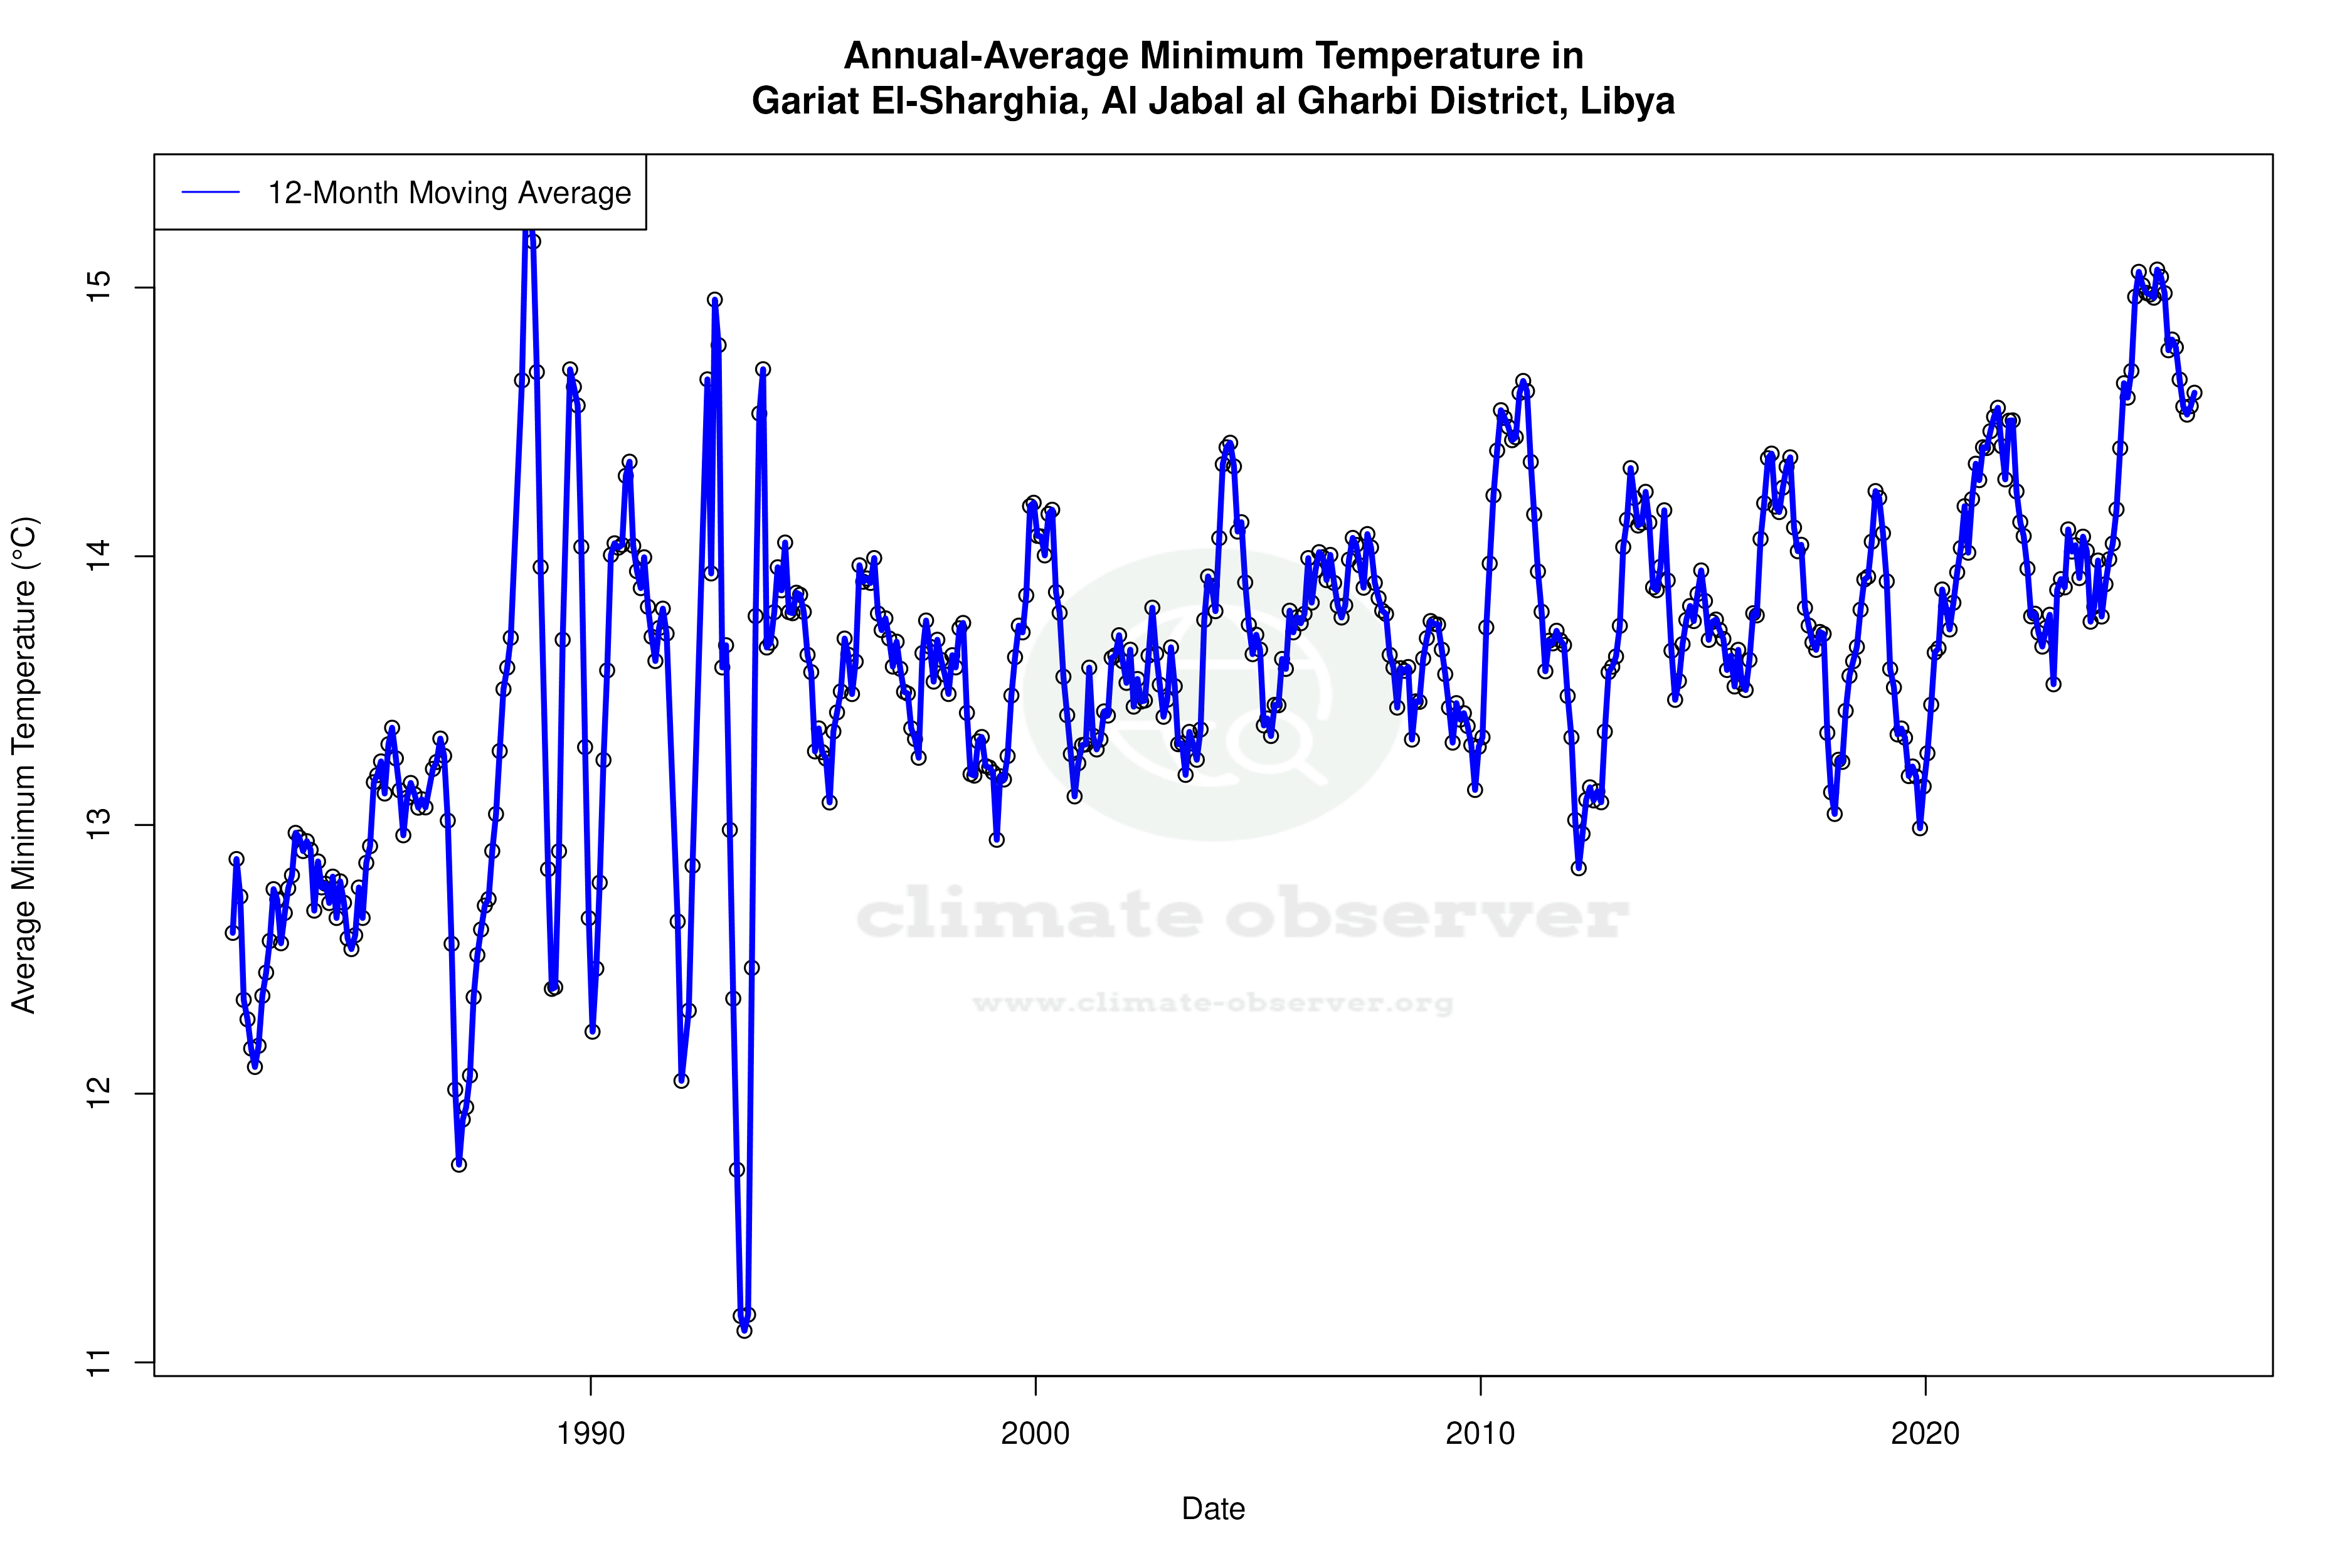
Temperature Trends: A Decade of Change
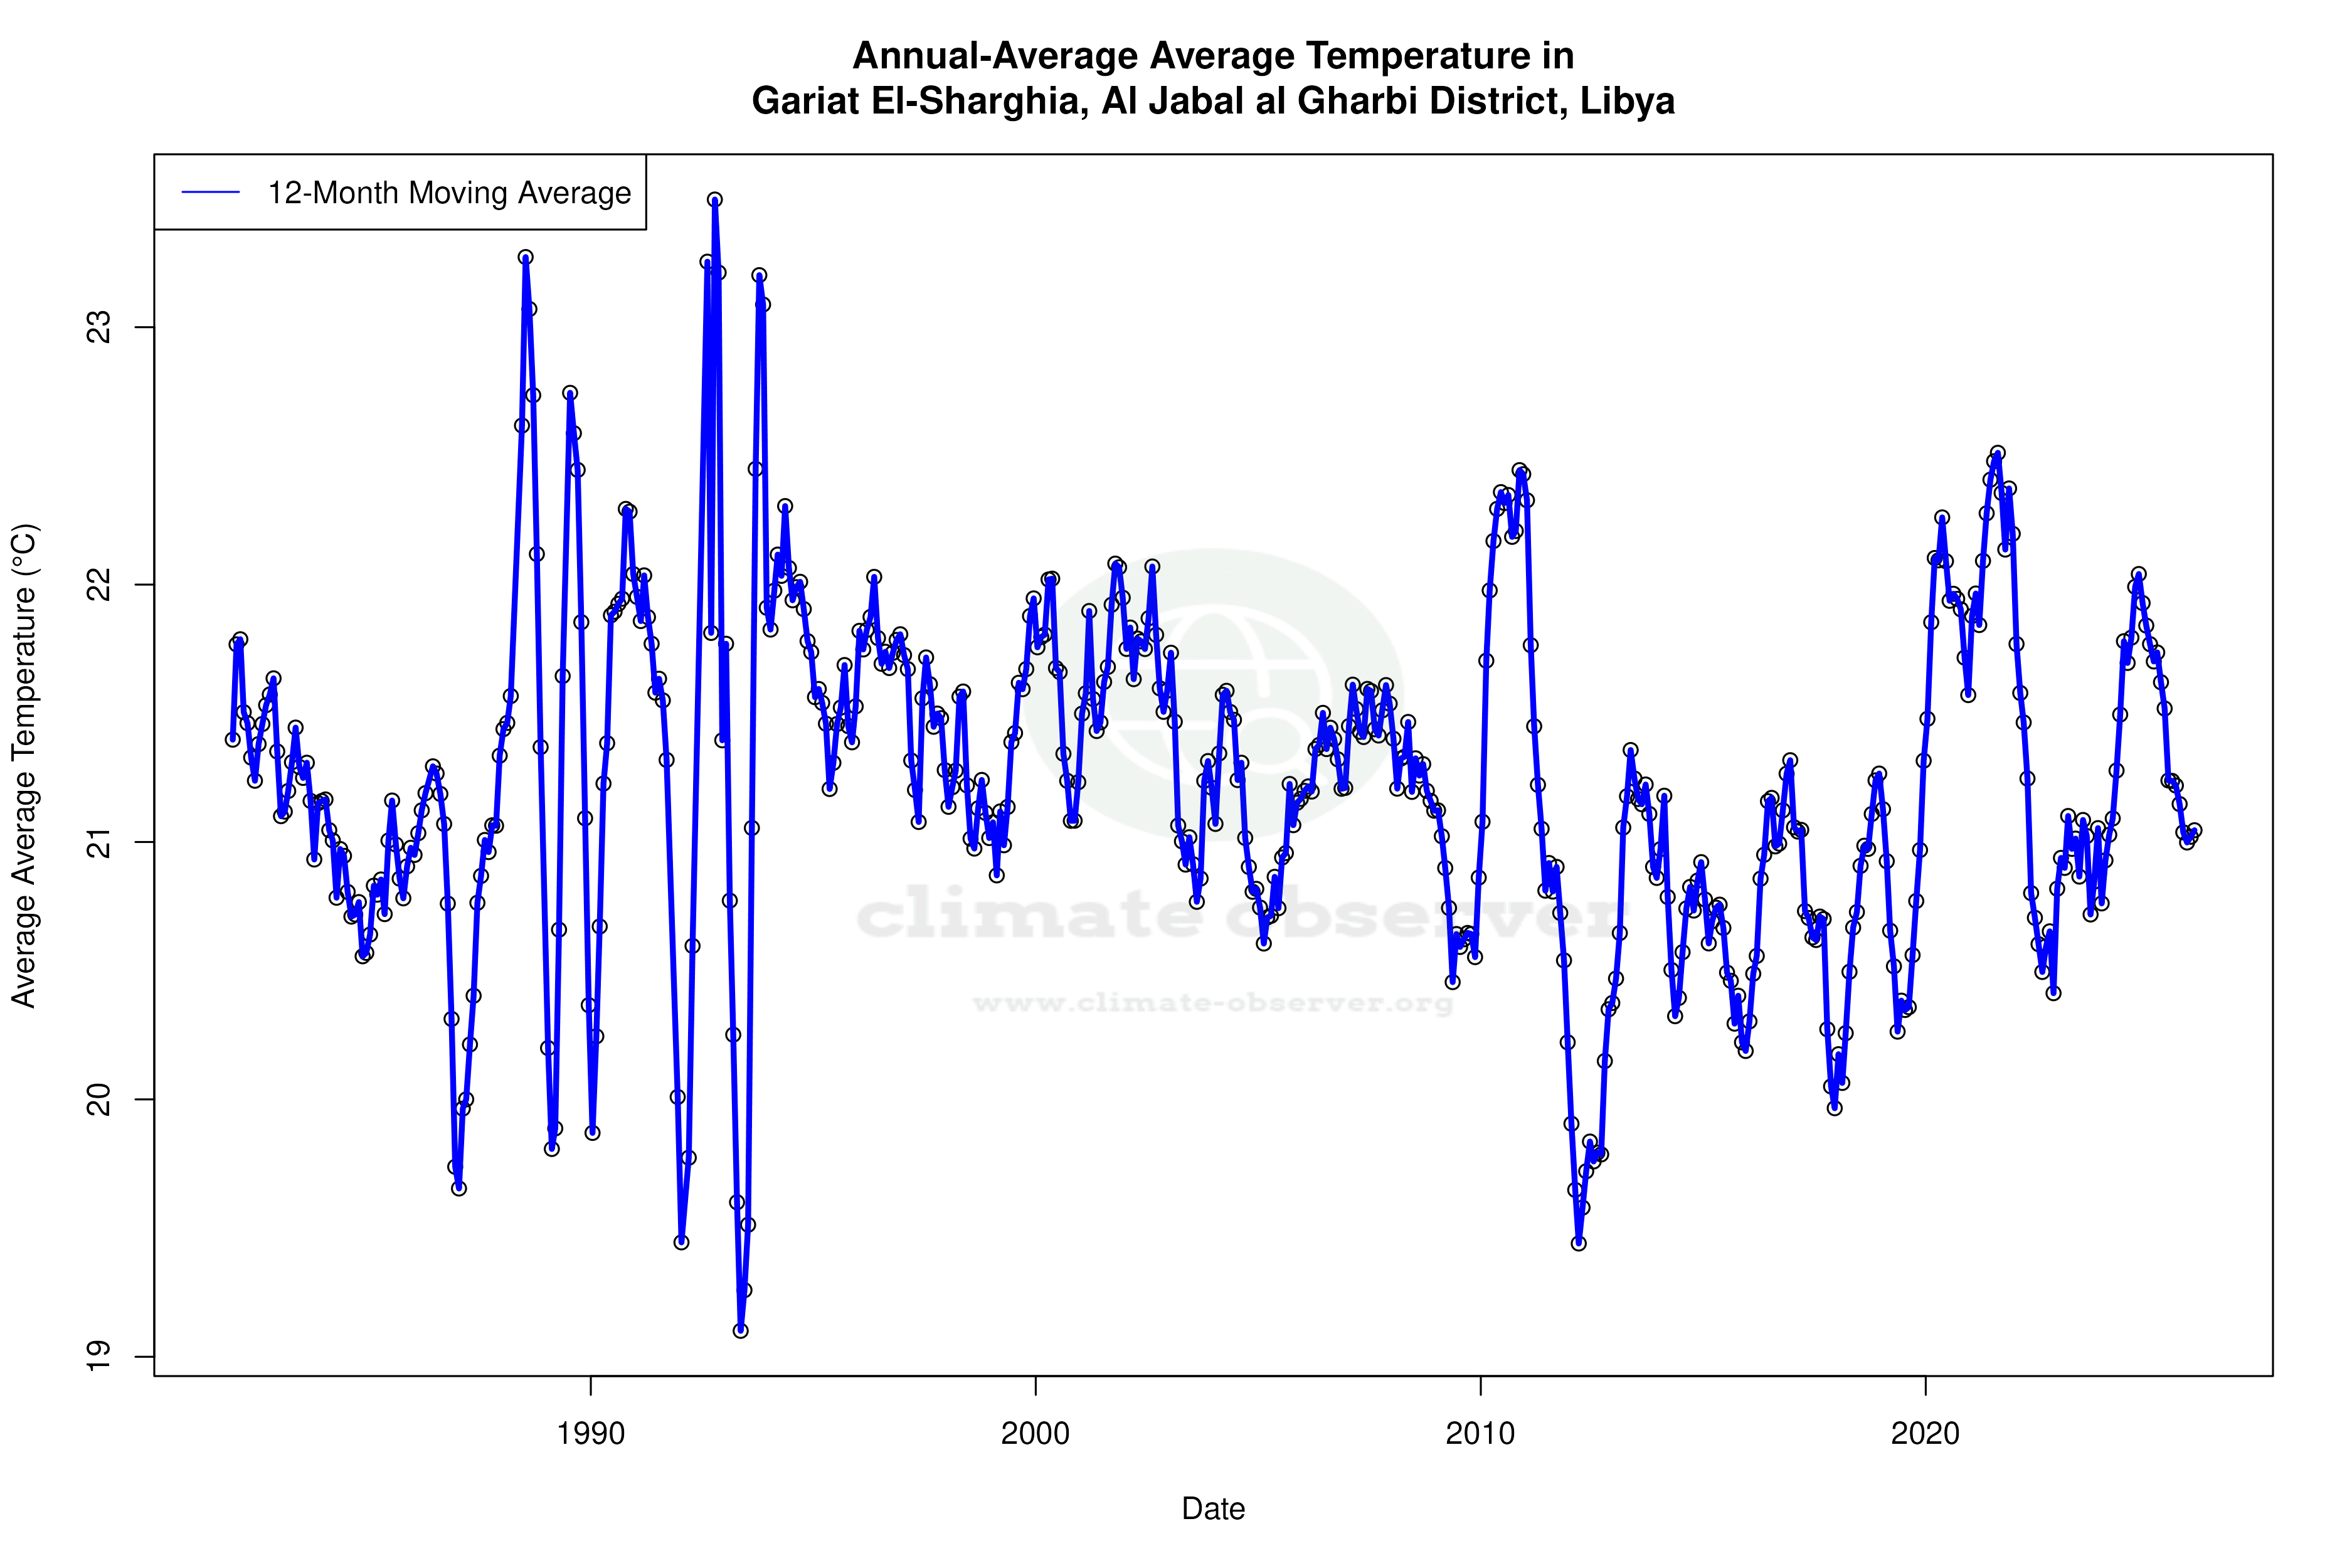
Over the past ten years, Gariat El-Sharghia has experienced a cooling trend in high temperatures, with a decrease of 0.85°C (1.53°F). In contrast, low temperatures have shown a warming trend, rising by 0.96°C (1.73°F). This divergence suggests a narrowing of the temperature range, potentially affecting local ecosystems and human activities. When considering the all-time trends, high temperatures have seen a slight warming of 0.07°C (0.13°F), while low temperatures have increased by 0.26°C (0.47°F), indicating a long-term warming trend for the region.
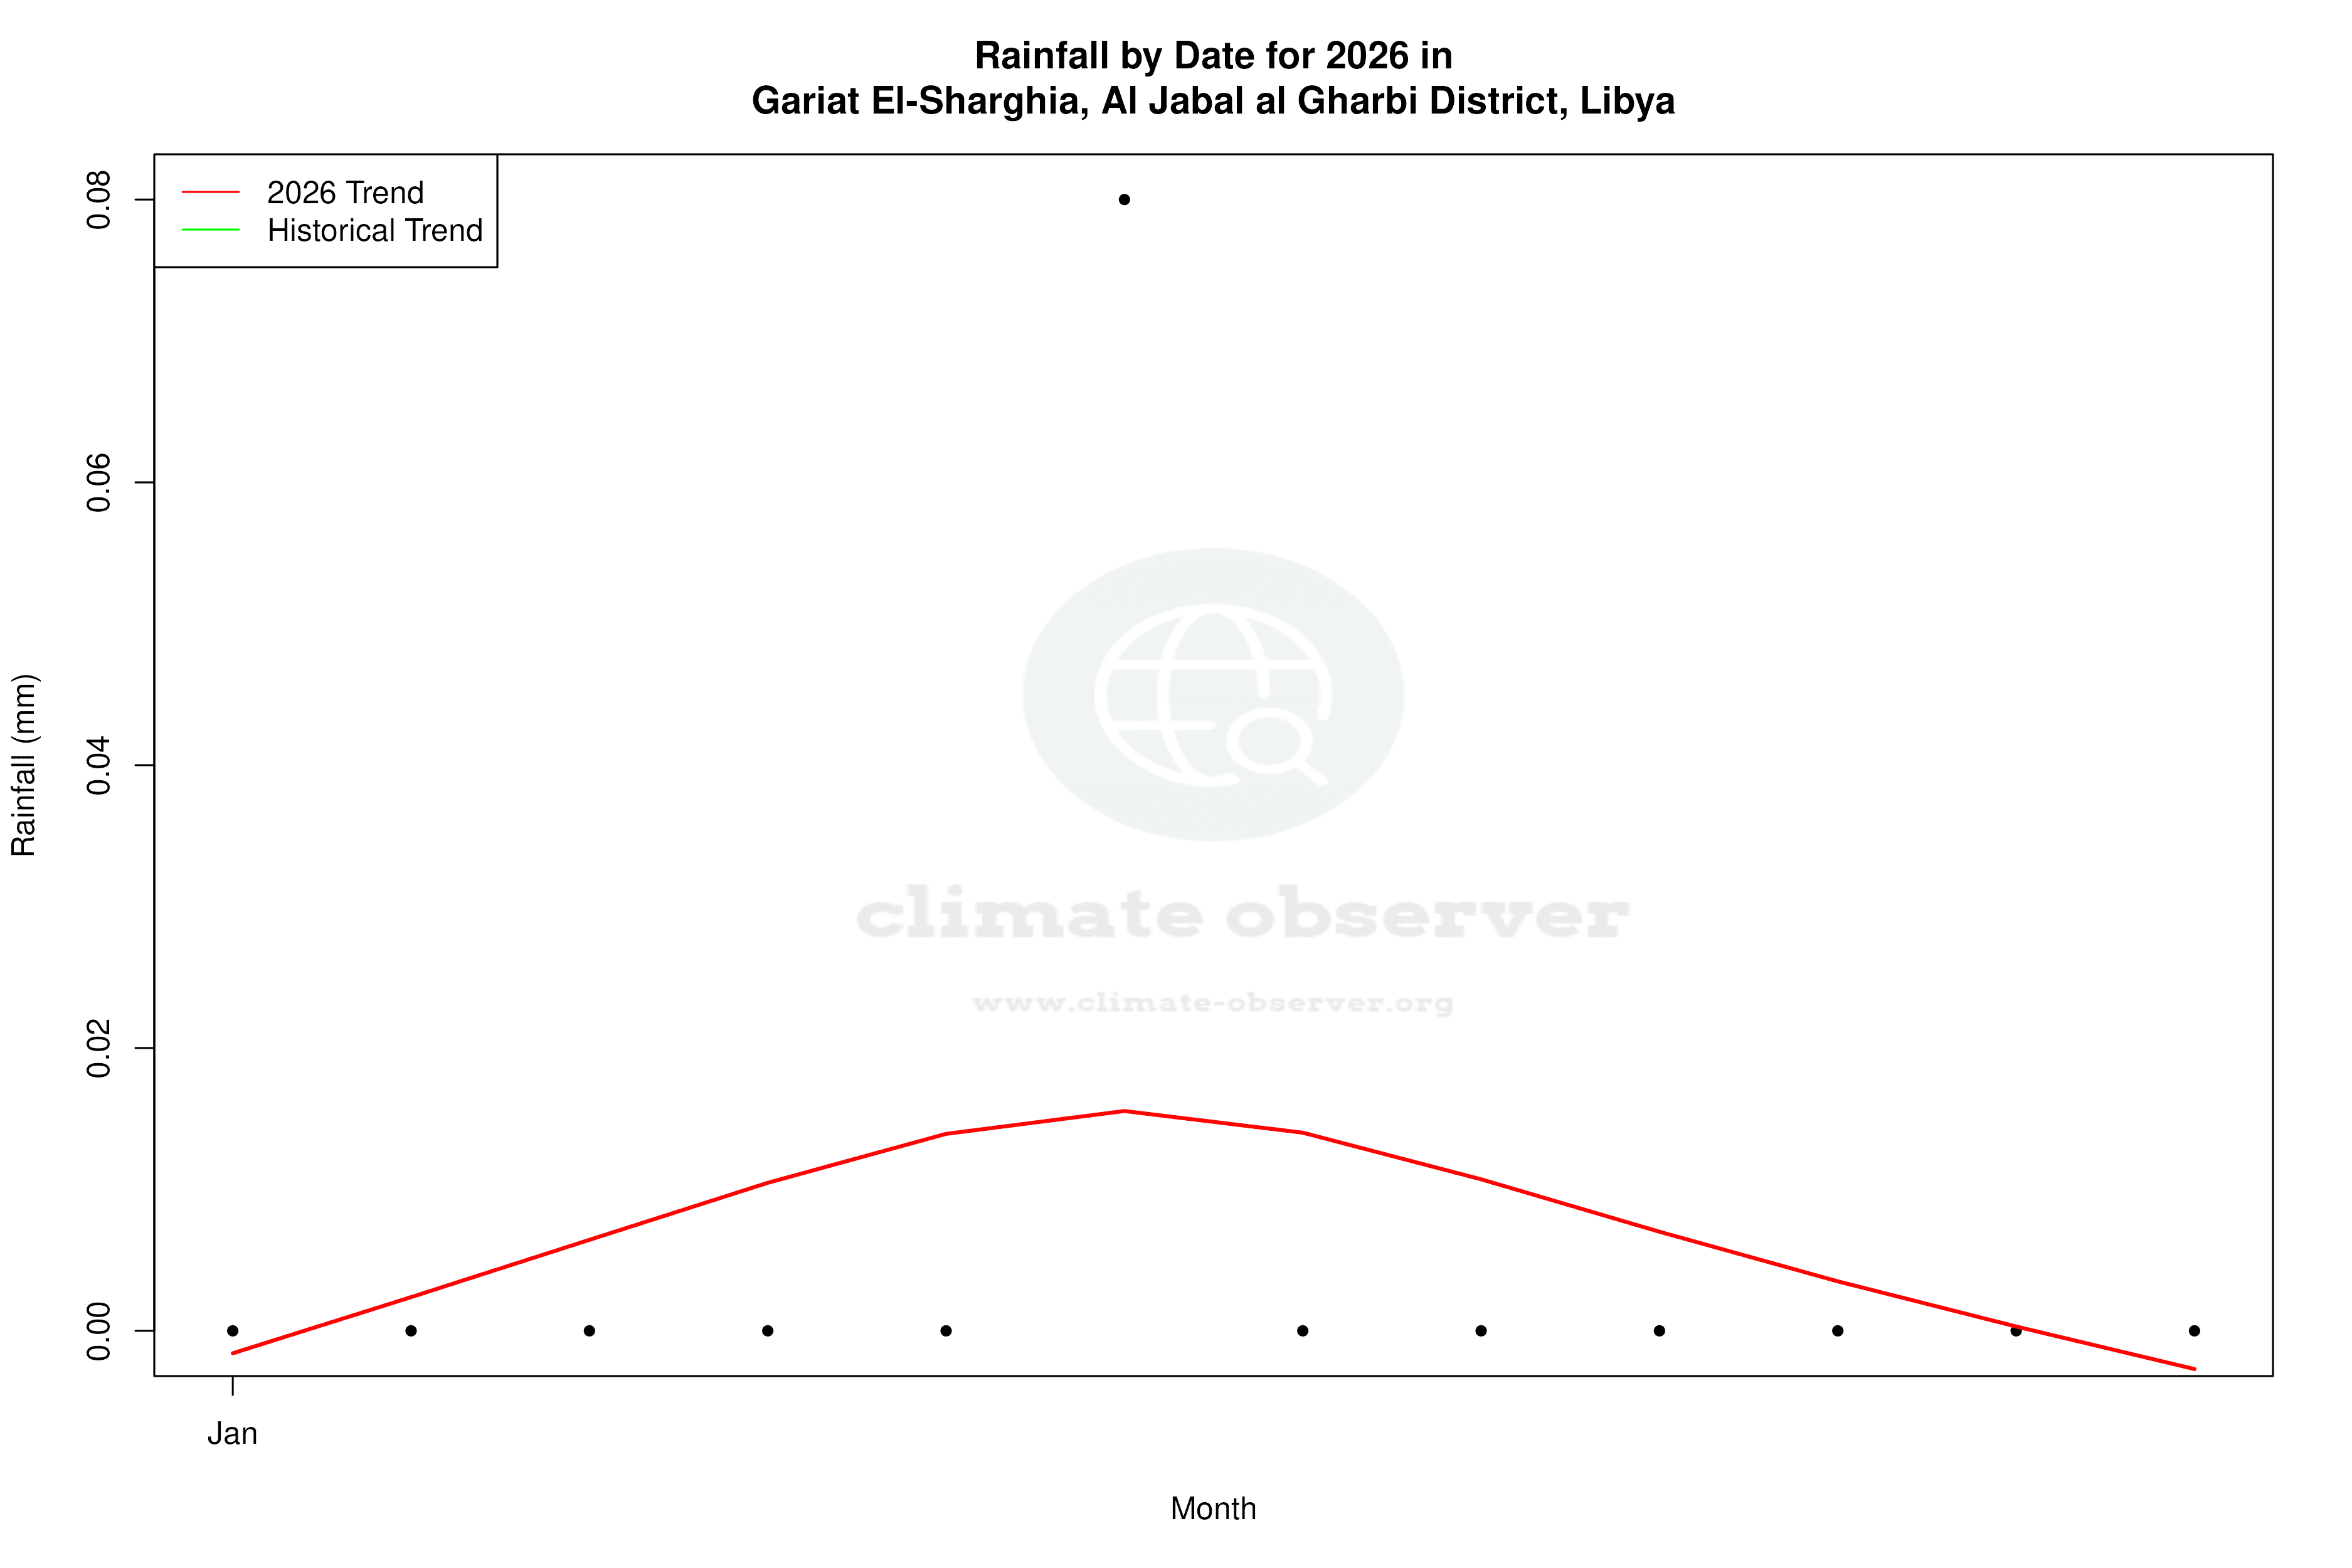
Precipitation Patterns: Subtle Shifts
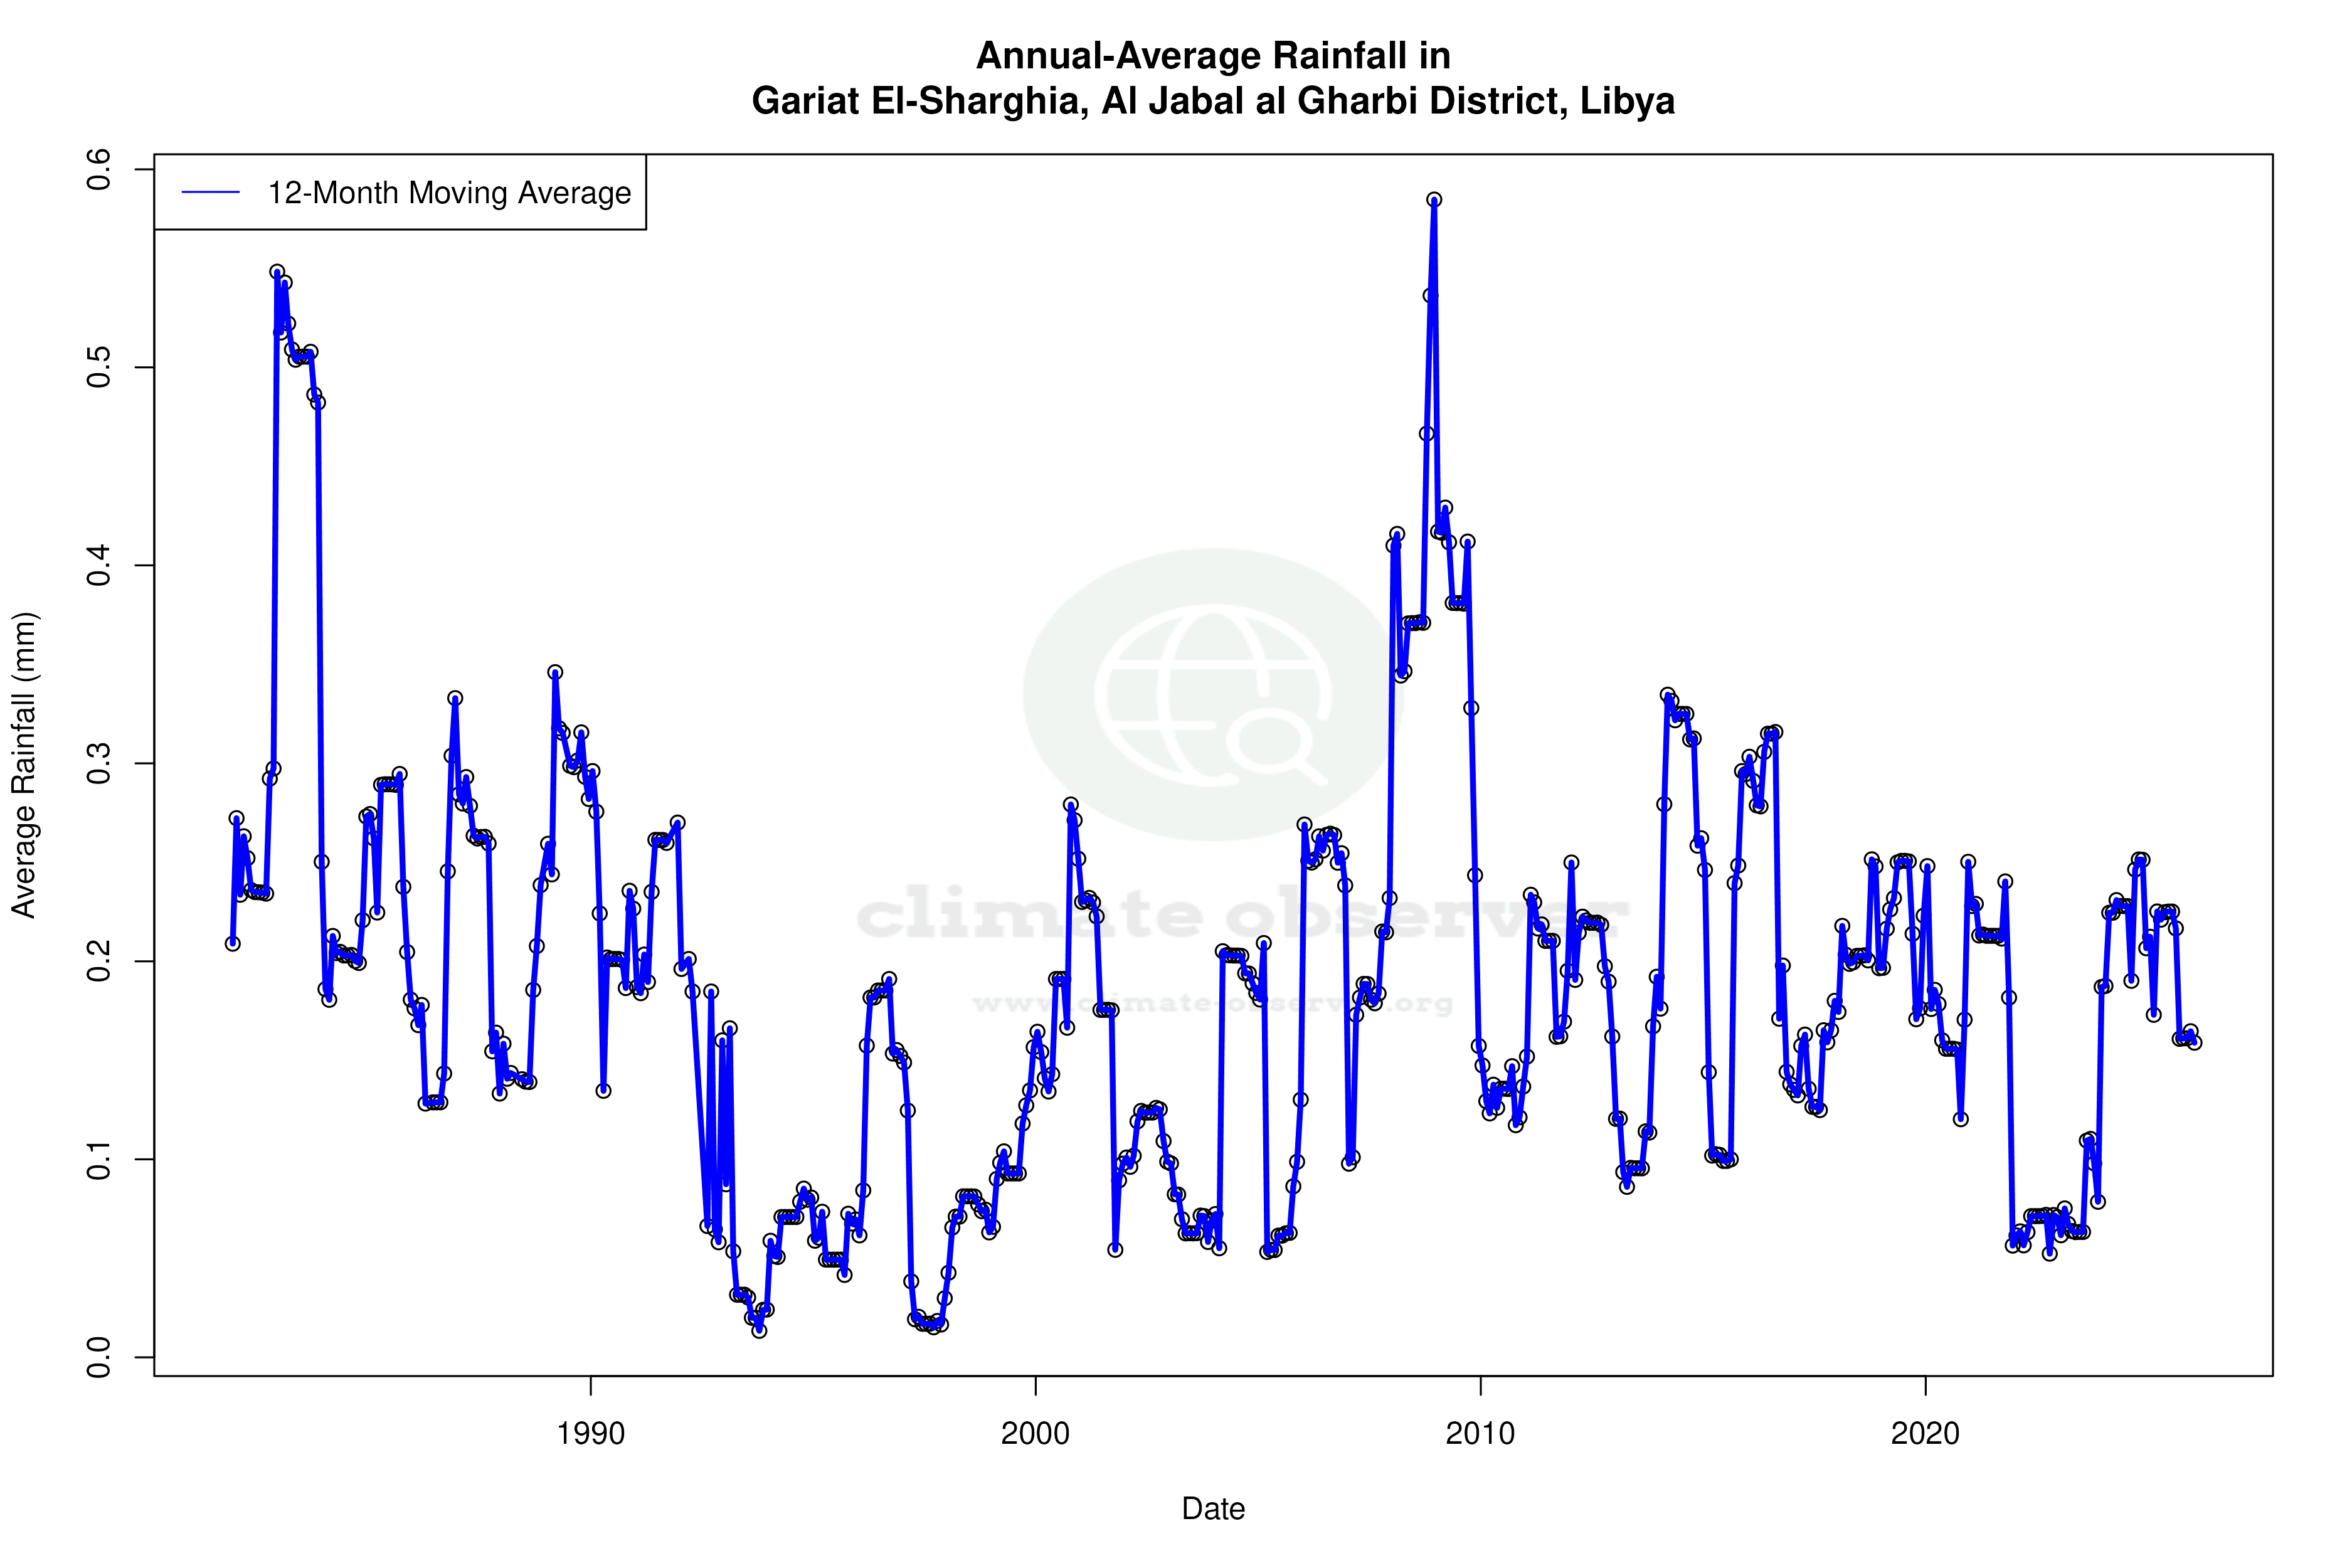
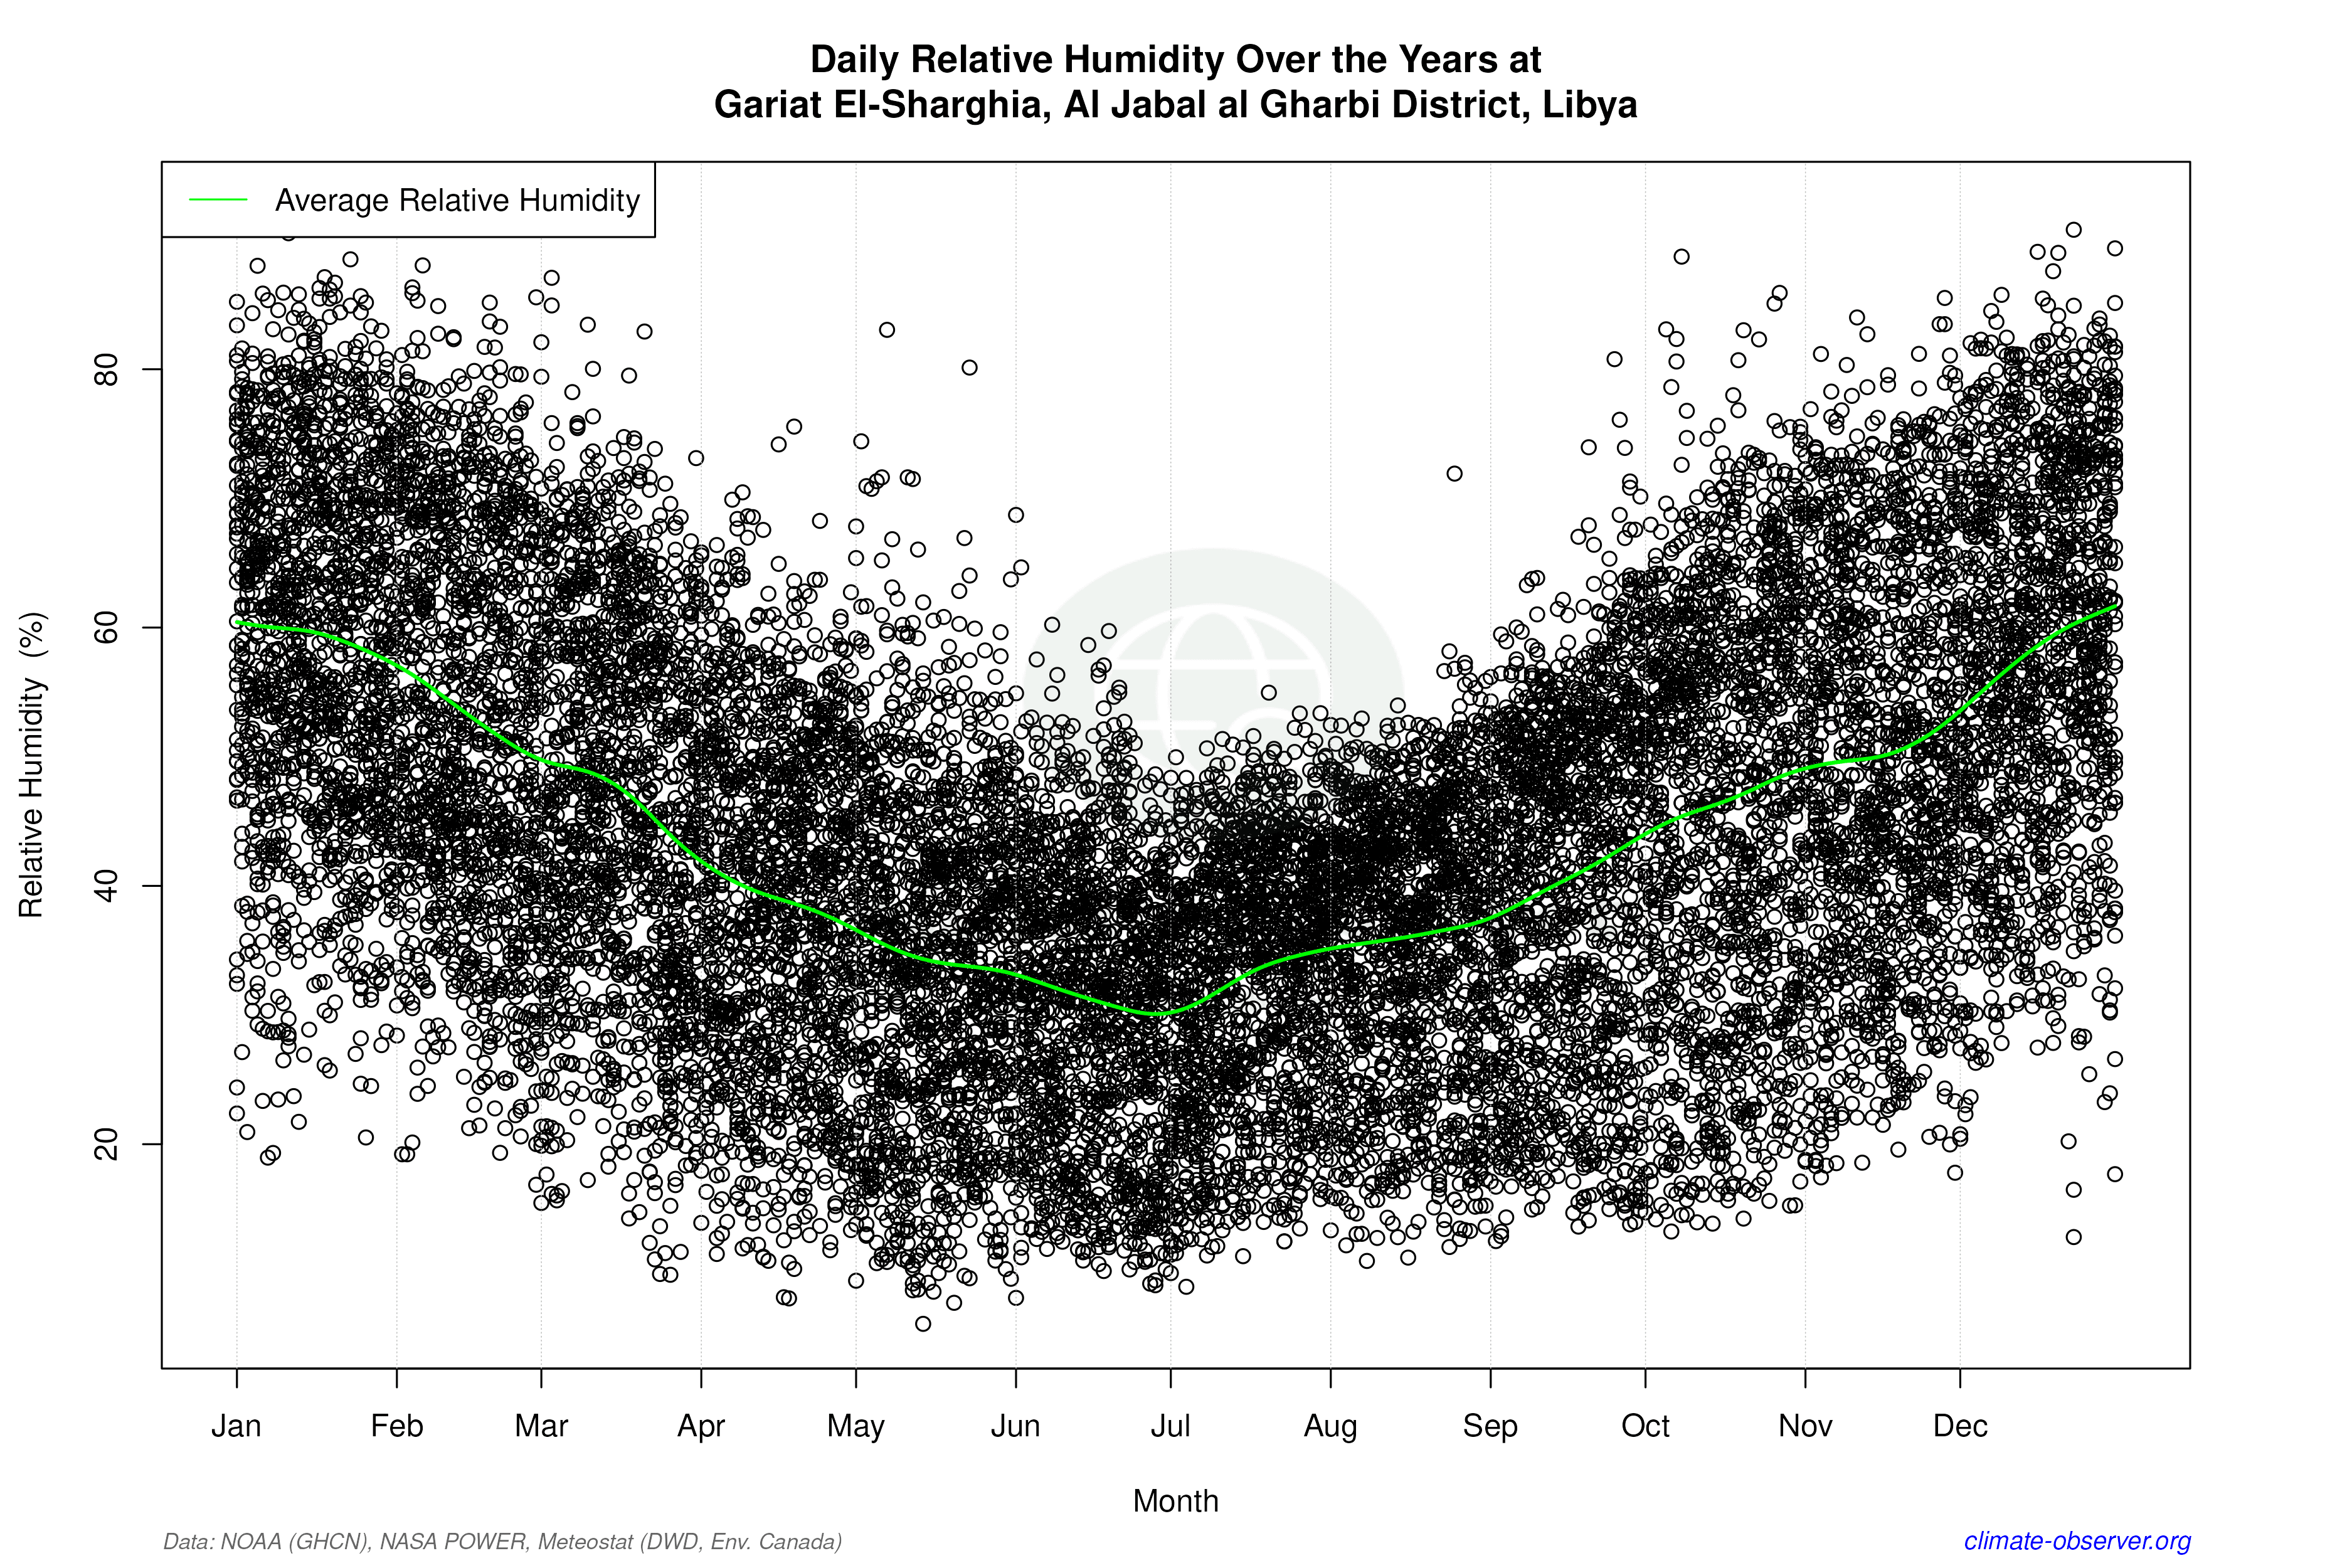
The Precipitation Concentration Index (PCI), which measures the distribution of rainfall over time, has shown a marginal decrease from a baseline of 26.89 to 26.32. This suggests that rainfall is becoming slightly more evenly distributed throughout the year, although it remains highly concentrated. Such changes could influence water availability and agricultural practices, crucial for a region where water is a precious resource.
Temperature Extremes: Record Highs and Lows
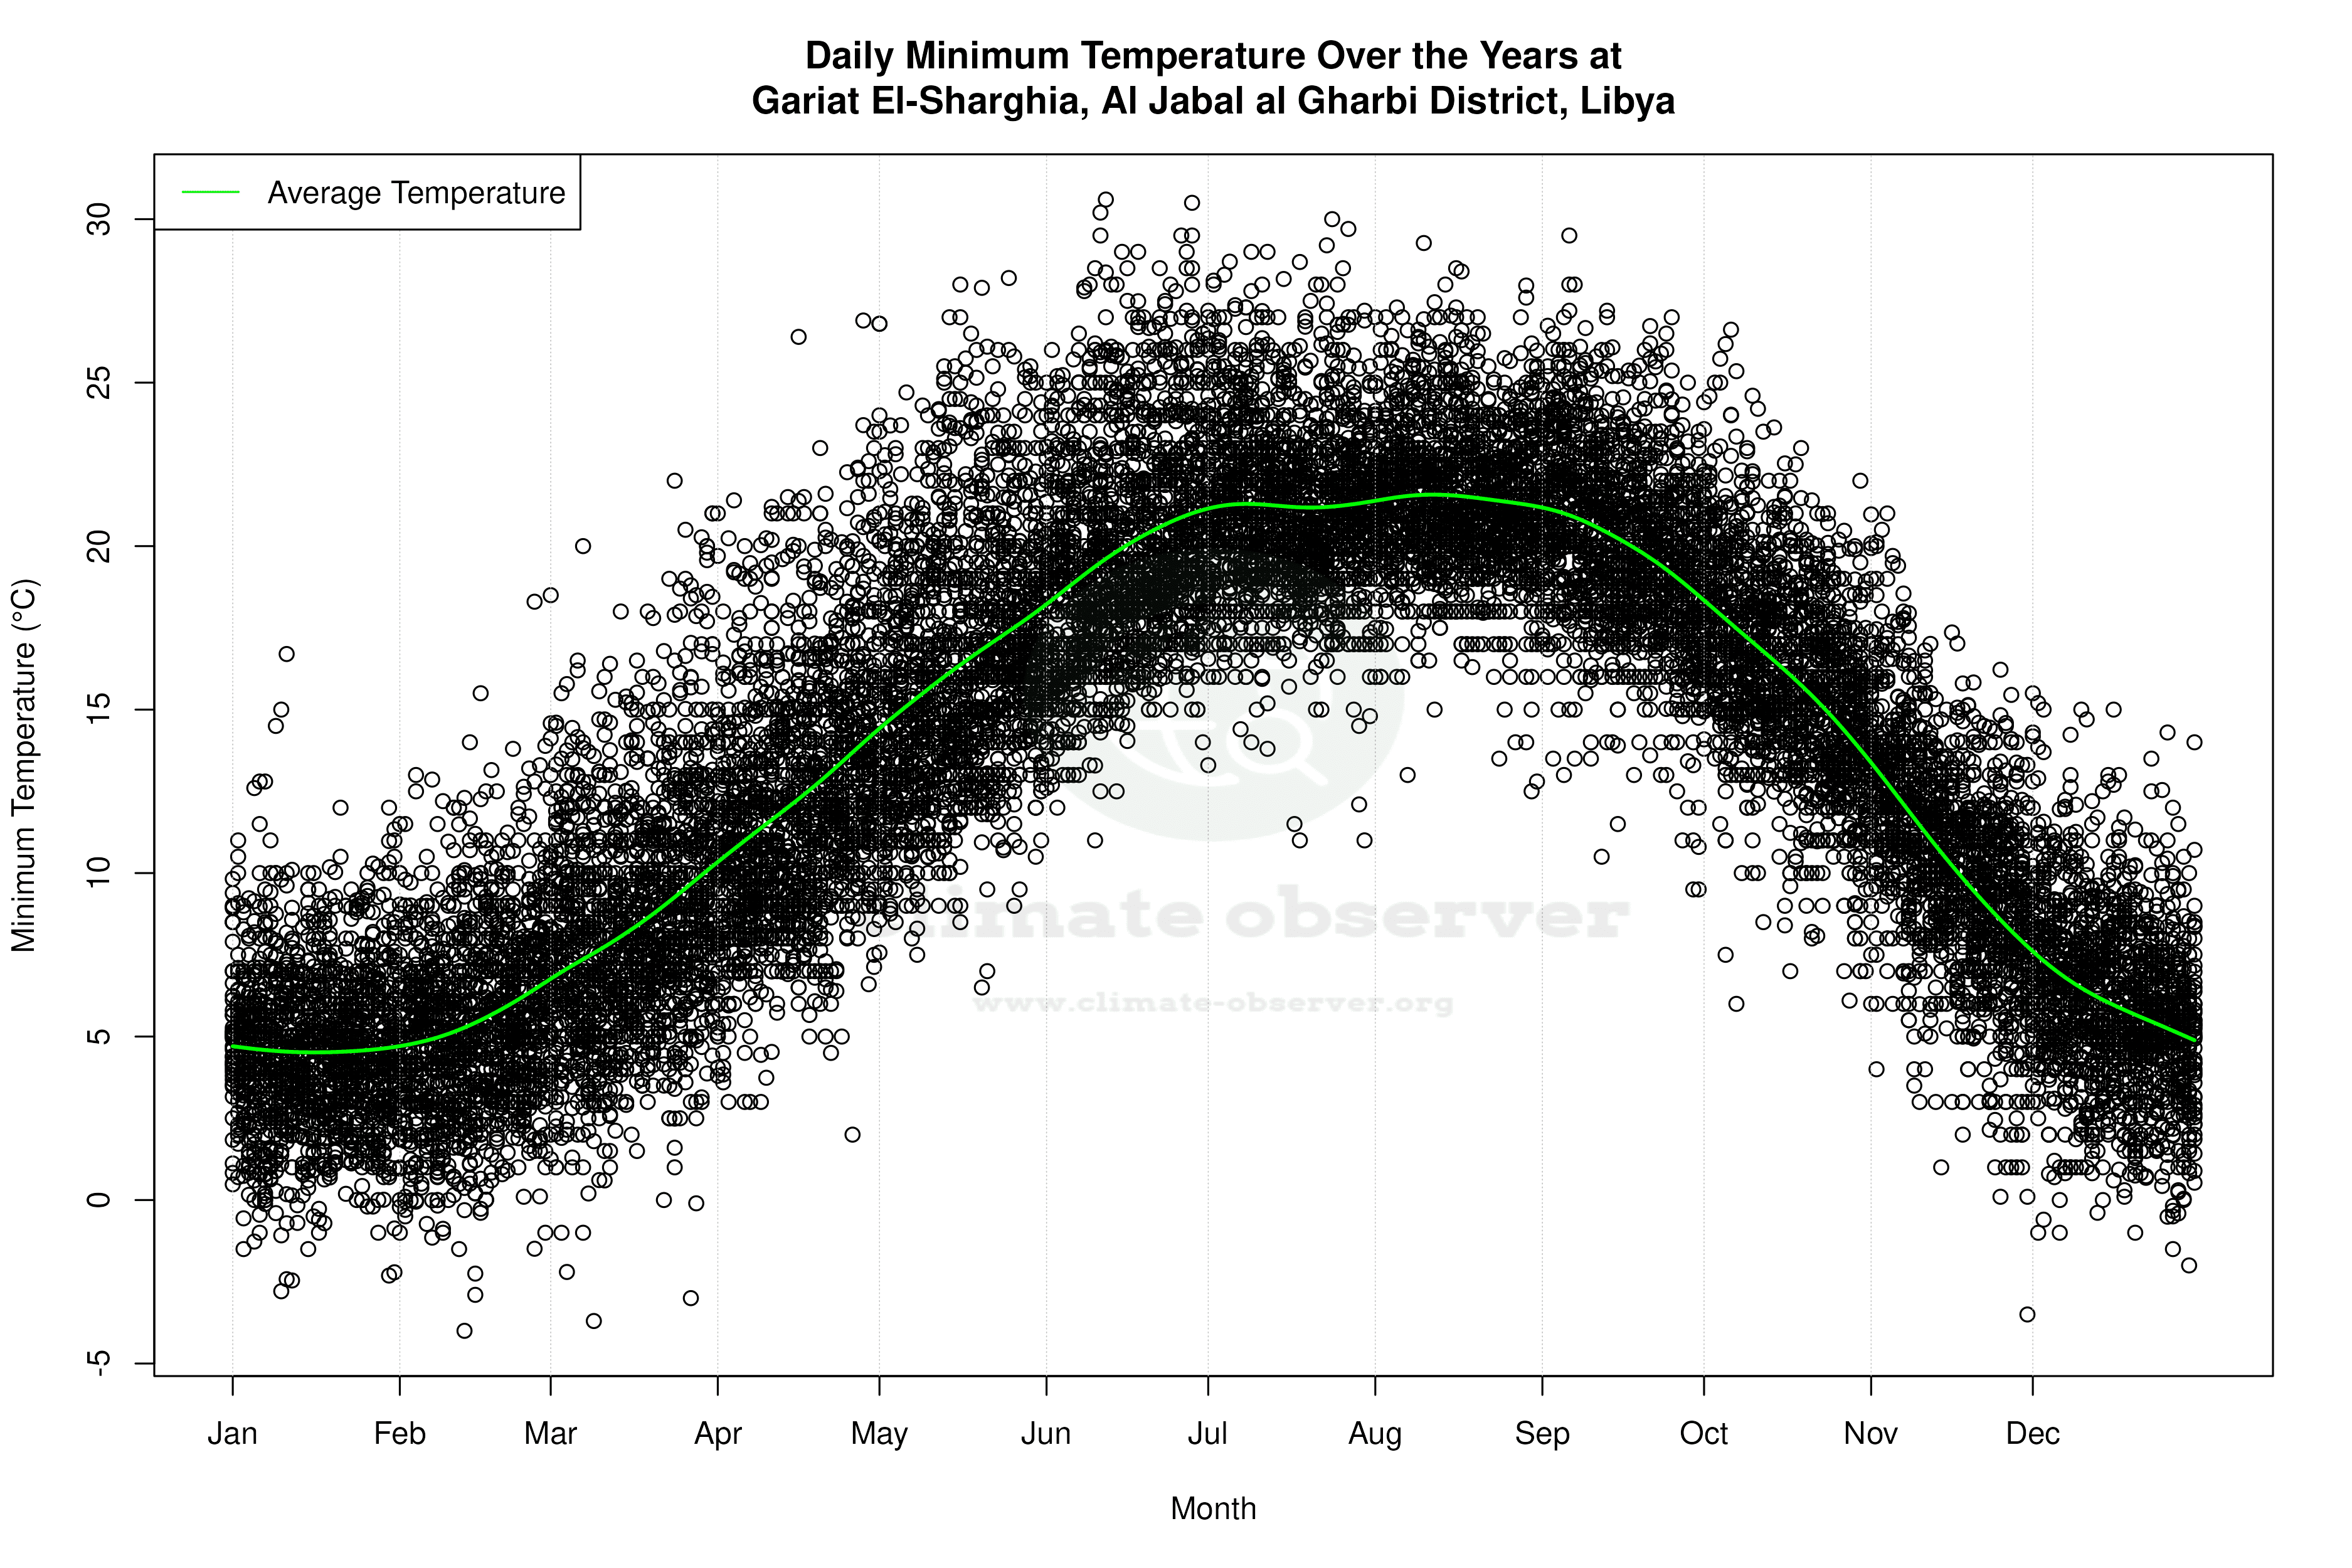
Gariat El-Sharghia's climate is marked by its extreme temperatures, with historical records showing a maximum of 51.0°C (123.8°F) and a minimum of -4.0°C (24.8°F). These extremes highlight the harsh conditions typical of desert climates, where temperature fluctuations can be severe and sudden.
Regional Climate Considerations
In the context of Libya's broader climate goals, which focus on adaptation and resilience in the face of climate change, understanding these localised trends is crucial. The observed temperature changes and slight shifts in precipitation patterns may inform future strategies for managing water resources and agricultural practices in the region. As Libya continues to navigate the challenges posed by a changing climate, insights from stations like Gariat El-Sharghia will be invaluable in shaping effective responses.
Station Statistics
10-Year Trend
High: -0.88 °C/decade
Low: +1.09 °C/decade
Rain: -0.03 mm/decade
25-Year Trend
High: -0.18 °C/decade
Low: +0.28 °C/decade
Rain: -0.00 mm/decade
50-Year Trend
High: +0.06 °C/decade
Low: +0.27 °C/decade
Rain: -0.01 mm/decade
All-Time Trend
High: +0.06 °C/decade
Low: +0.27 °C/decade
Rain: -0.01 mm/decade
Percentage Above-Average Days
Last 12 Months: 48.2%
This Year: 49.7%
Precipitation Concentration Index (PCI) ℹ️
Last 12 Months: 32.2
Historical Average: 28.7
Percentile Rank of Last 12 Months ℹ️
High: 17th percentile
Low: 97th percentile
Rain: 45th percentile
Change in Variance ℹ️
High: -3.7%
Low: +3.9%
Intraday: -19.5%
Data Coverage
90.7%
First Year of Data
1973
Station Location
Historical Weather Records
| Max High | Avg High | Min High | Max Avg | Avg Avg | Min Avg | Max Low | Avg Low | Min Low | Max Precipitation | Avg Precipitation | Max Snow | Avg Snow | |
|---|---|---|---|---|---|---|---|---|---|---|---|---|---|
| Record | 51.0 °C | — | 7.0 °C | 41.8 °C | — | 2.1 °C | 30.6 °C | — | -4.0 °C | 59.9 mm | — | — | — |
| January | 29.5 °C | 17.0 °C | 7.2 °C | 23.2 °C | 10.8 °C | 2.5 °C | 16.7 °C | 4.6 °C | -2.8 °C | 22.9 mm | 0.3 mm | — | — |
| February | 34.0 °C | 19.1 °C | 8.8 °C | 28.1 °C | 12.6 °C | 3.7 °C | 18.3 °C | 5.5 °C | -4.0 °C | 24.8 mm | 0.3 mm | — | — |
| March | 38.0 °C | 23.3 °C | 10.0 °C | 31.1 °C | 16.5 °C | 5.5 °C | 22.0 °C | 8.5 °C | -3.7 °C | 40.3 mm | 0.3 mm | — | — |
| April | 42.5 °C | 28.3 °C | 15.0 °C | 33.6 °C | 20.8 °C | 2.1 °C | 26.9 °C | 12.2 °C | 2.0 °C | 23.5 mm | 0.1 mm | — | — |
| May | 43.8 °C | 32.5 °C | 16.2 °C | 37.8 °C | 25.3 °C | 14.0 °C | 28.2 °C | 16.3 °C | 2.1 °C | 13.9 mm | 0.1 mm | — | — |
| June | 46.5 °C | 36.4 °C | 20.0 °C | 41.8 °C | 29.0 °C | 18.0 °C | 30.6 °C | 19.9 °C | 11.0 °C | 16.3 mm | 0.0 mm | — | — |
| July | 51.0 °C | 37.3 °C | 27.0 °C | 41.0 °C | 30.1 °C | 20.2 °C | 30.0 °C | 21.2 °C | 11.0 °C | 2.9 mm | 0.0 mm | — | — |
| August | 46.5 °C | 37.0 °C | 30.5 °C | 40.5 °C | 30.0 °C | 23.3 °C | 29.3 °C | 21.5 °C | 12.5 °C | 17.2 mm | 0.0 mm | — | — |
| September | 43.8 °C | 34.8 °C | 24.0 °C | 39.8 °C | 27.9 °C | 18.1 °C | 29.5 °C | 20.1 °C | 9.5 °C | 21.0 mm | 0.2 mm | — | — |
| October | 40.8 °C | 29.5 °C | 16.0 °C | 32.3 °C | 23.0 °C | 13.1 °C | 26.6 °C | 16.1 °C | 6.0 °C | 36.5 mm | 0.3 mm | — | — |
| November | 35.0 °C | 23.3 °C | 13.2 °C | 28.3 °C | 17.0 °C | 8.1 °C | 21.0 °C | 10.4 °C | -3.5 °C | 21.2 mm | 0.2 mm | — | — |
| December | 30.3 °C | 18.2 °C | 7.0 °C | 25.2 °C | 12.1 °C | 3.4 °C | 15.5 °C | 6.0 °C | -2.0 °C | 59.9 mm | 0.4 mm | — | — |
Data Visualisations
Remove WatermarksCurrent Year Climate Trends vs Historical


Max Temperature this Year | 1 of 6
Climate 12-Month Moving Averages


Max Temperature 12-Month MA | 1 of 6
Daily Data Points and Averages Throughout the Year
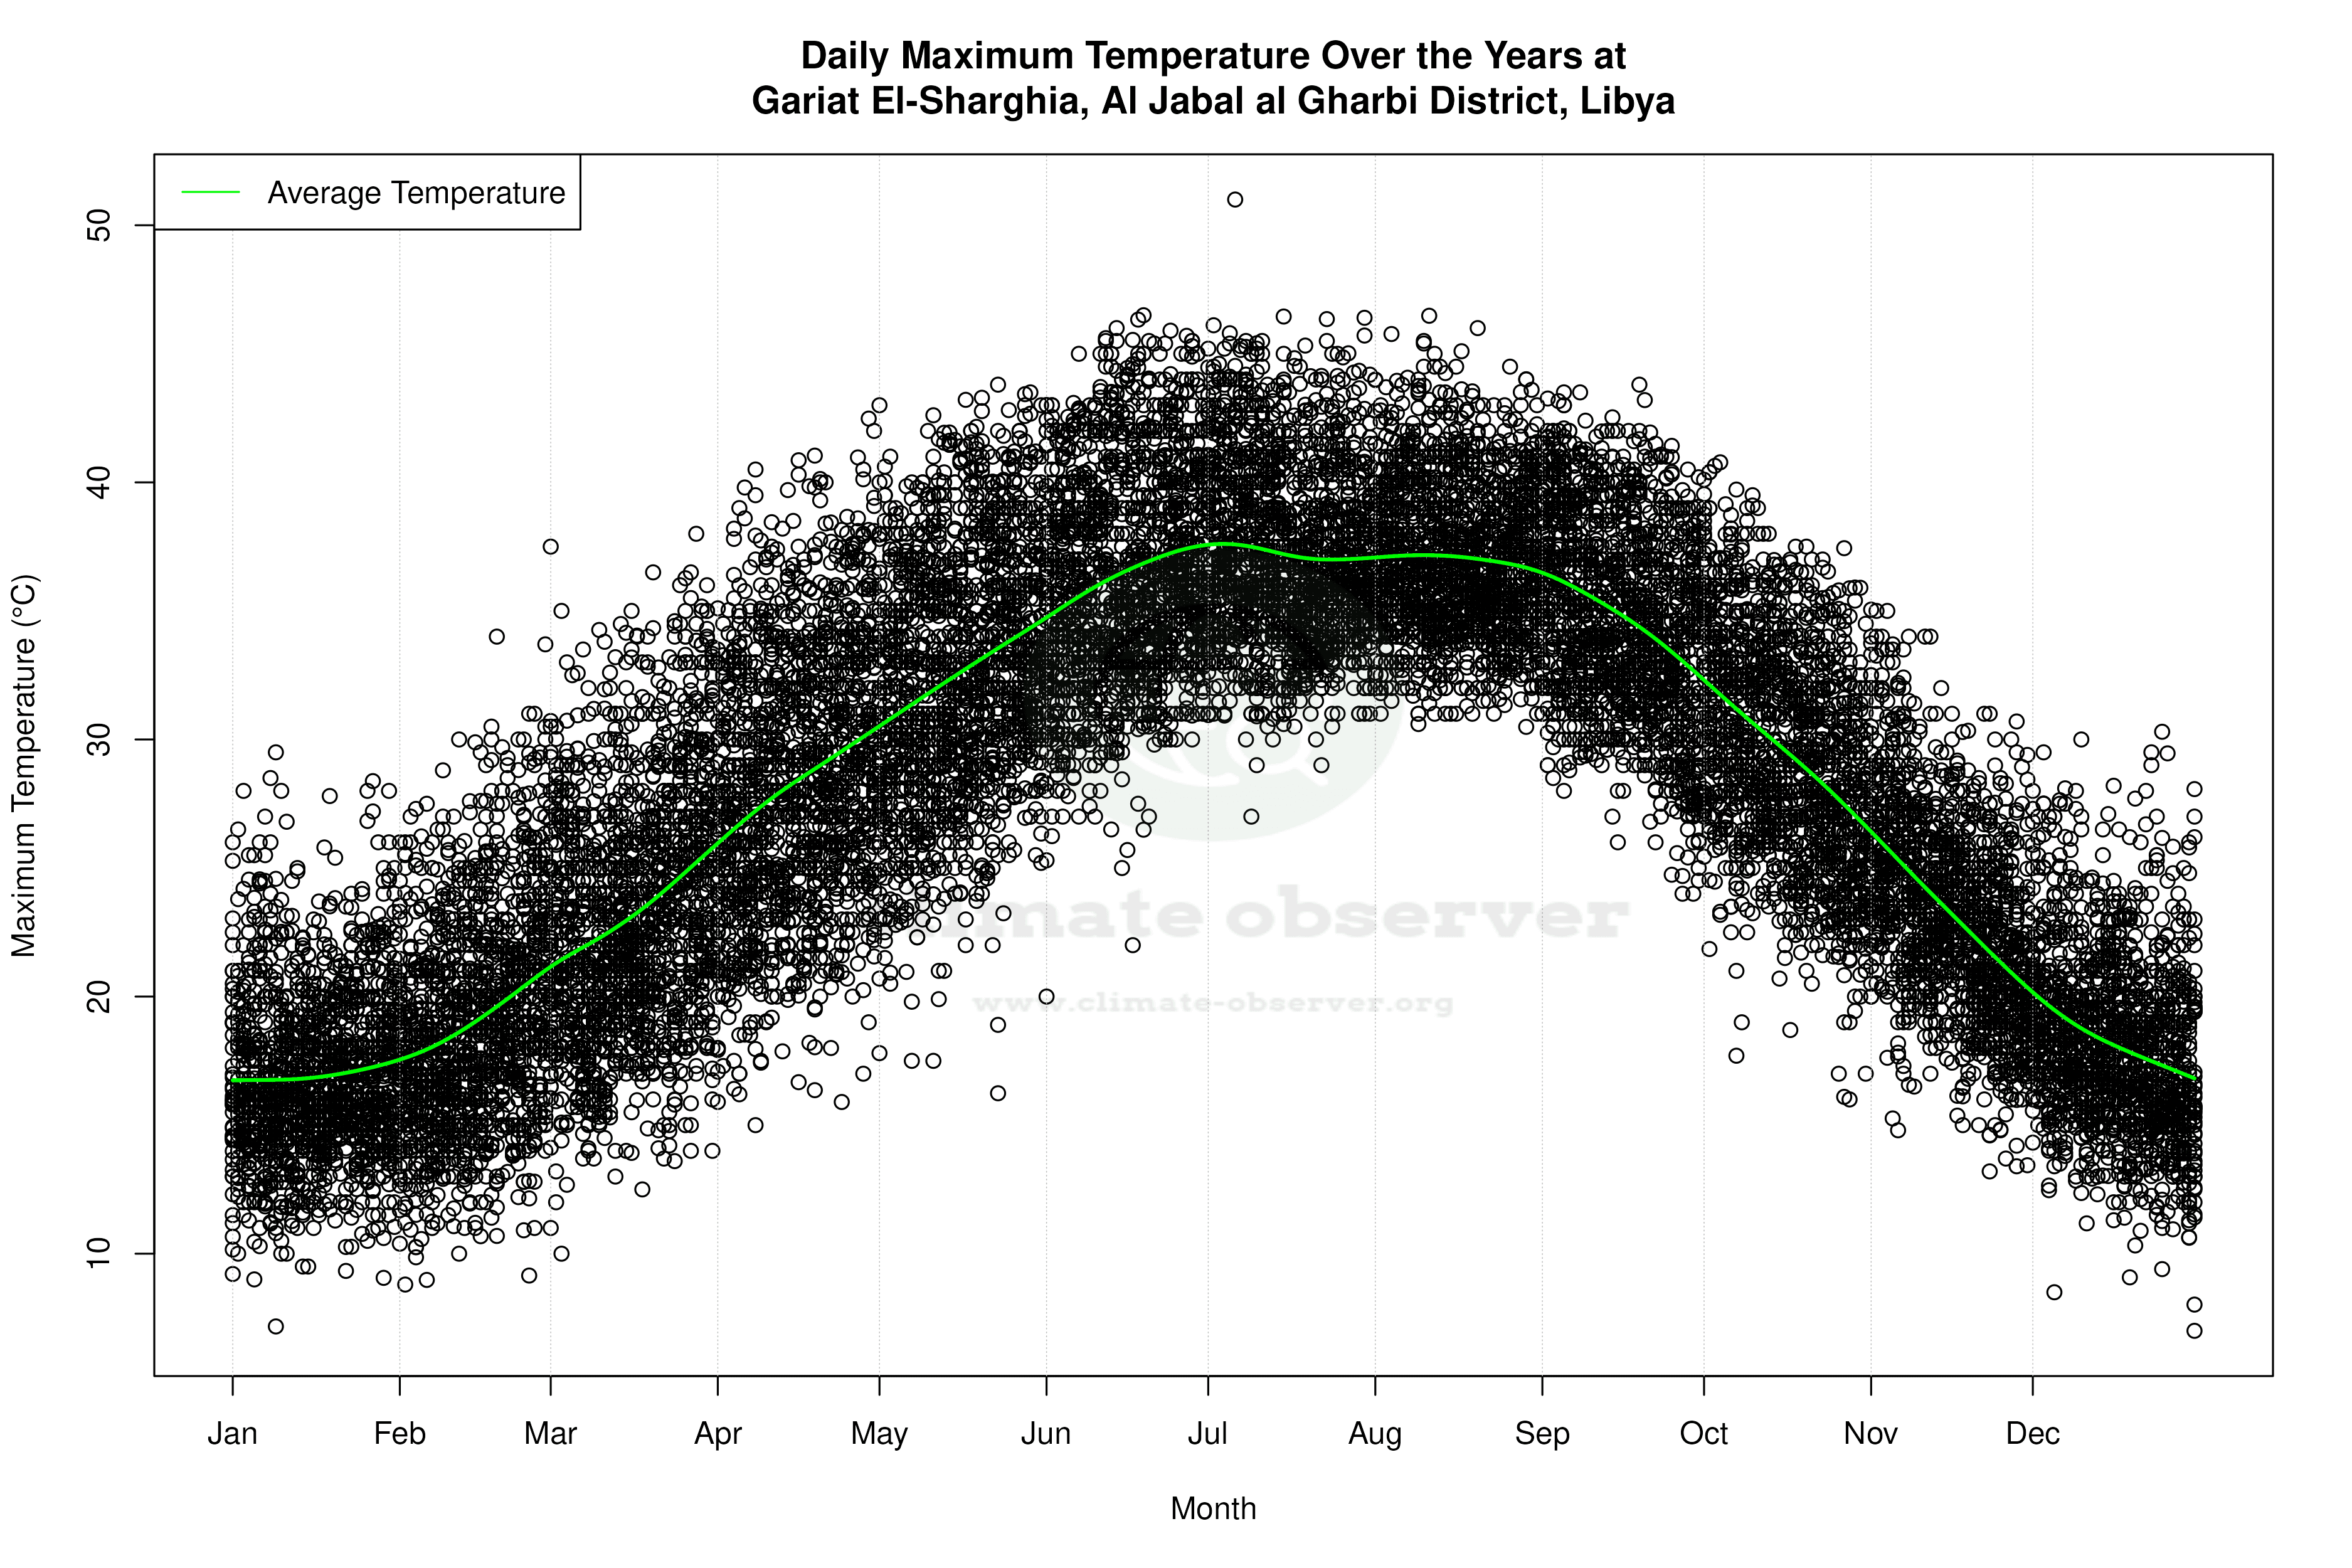
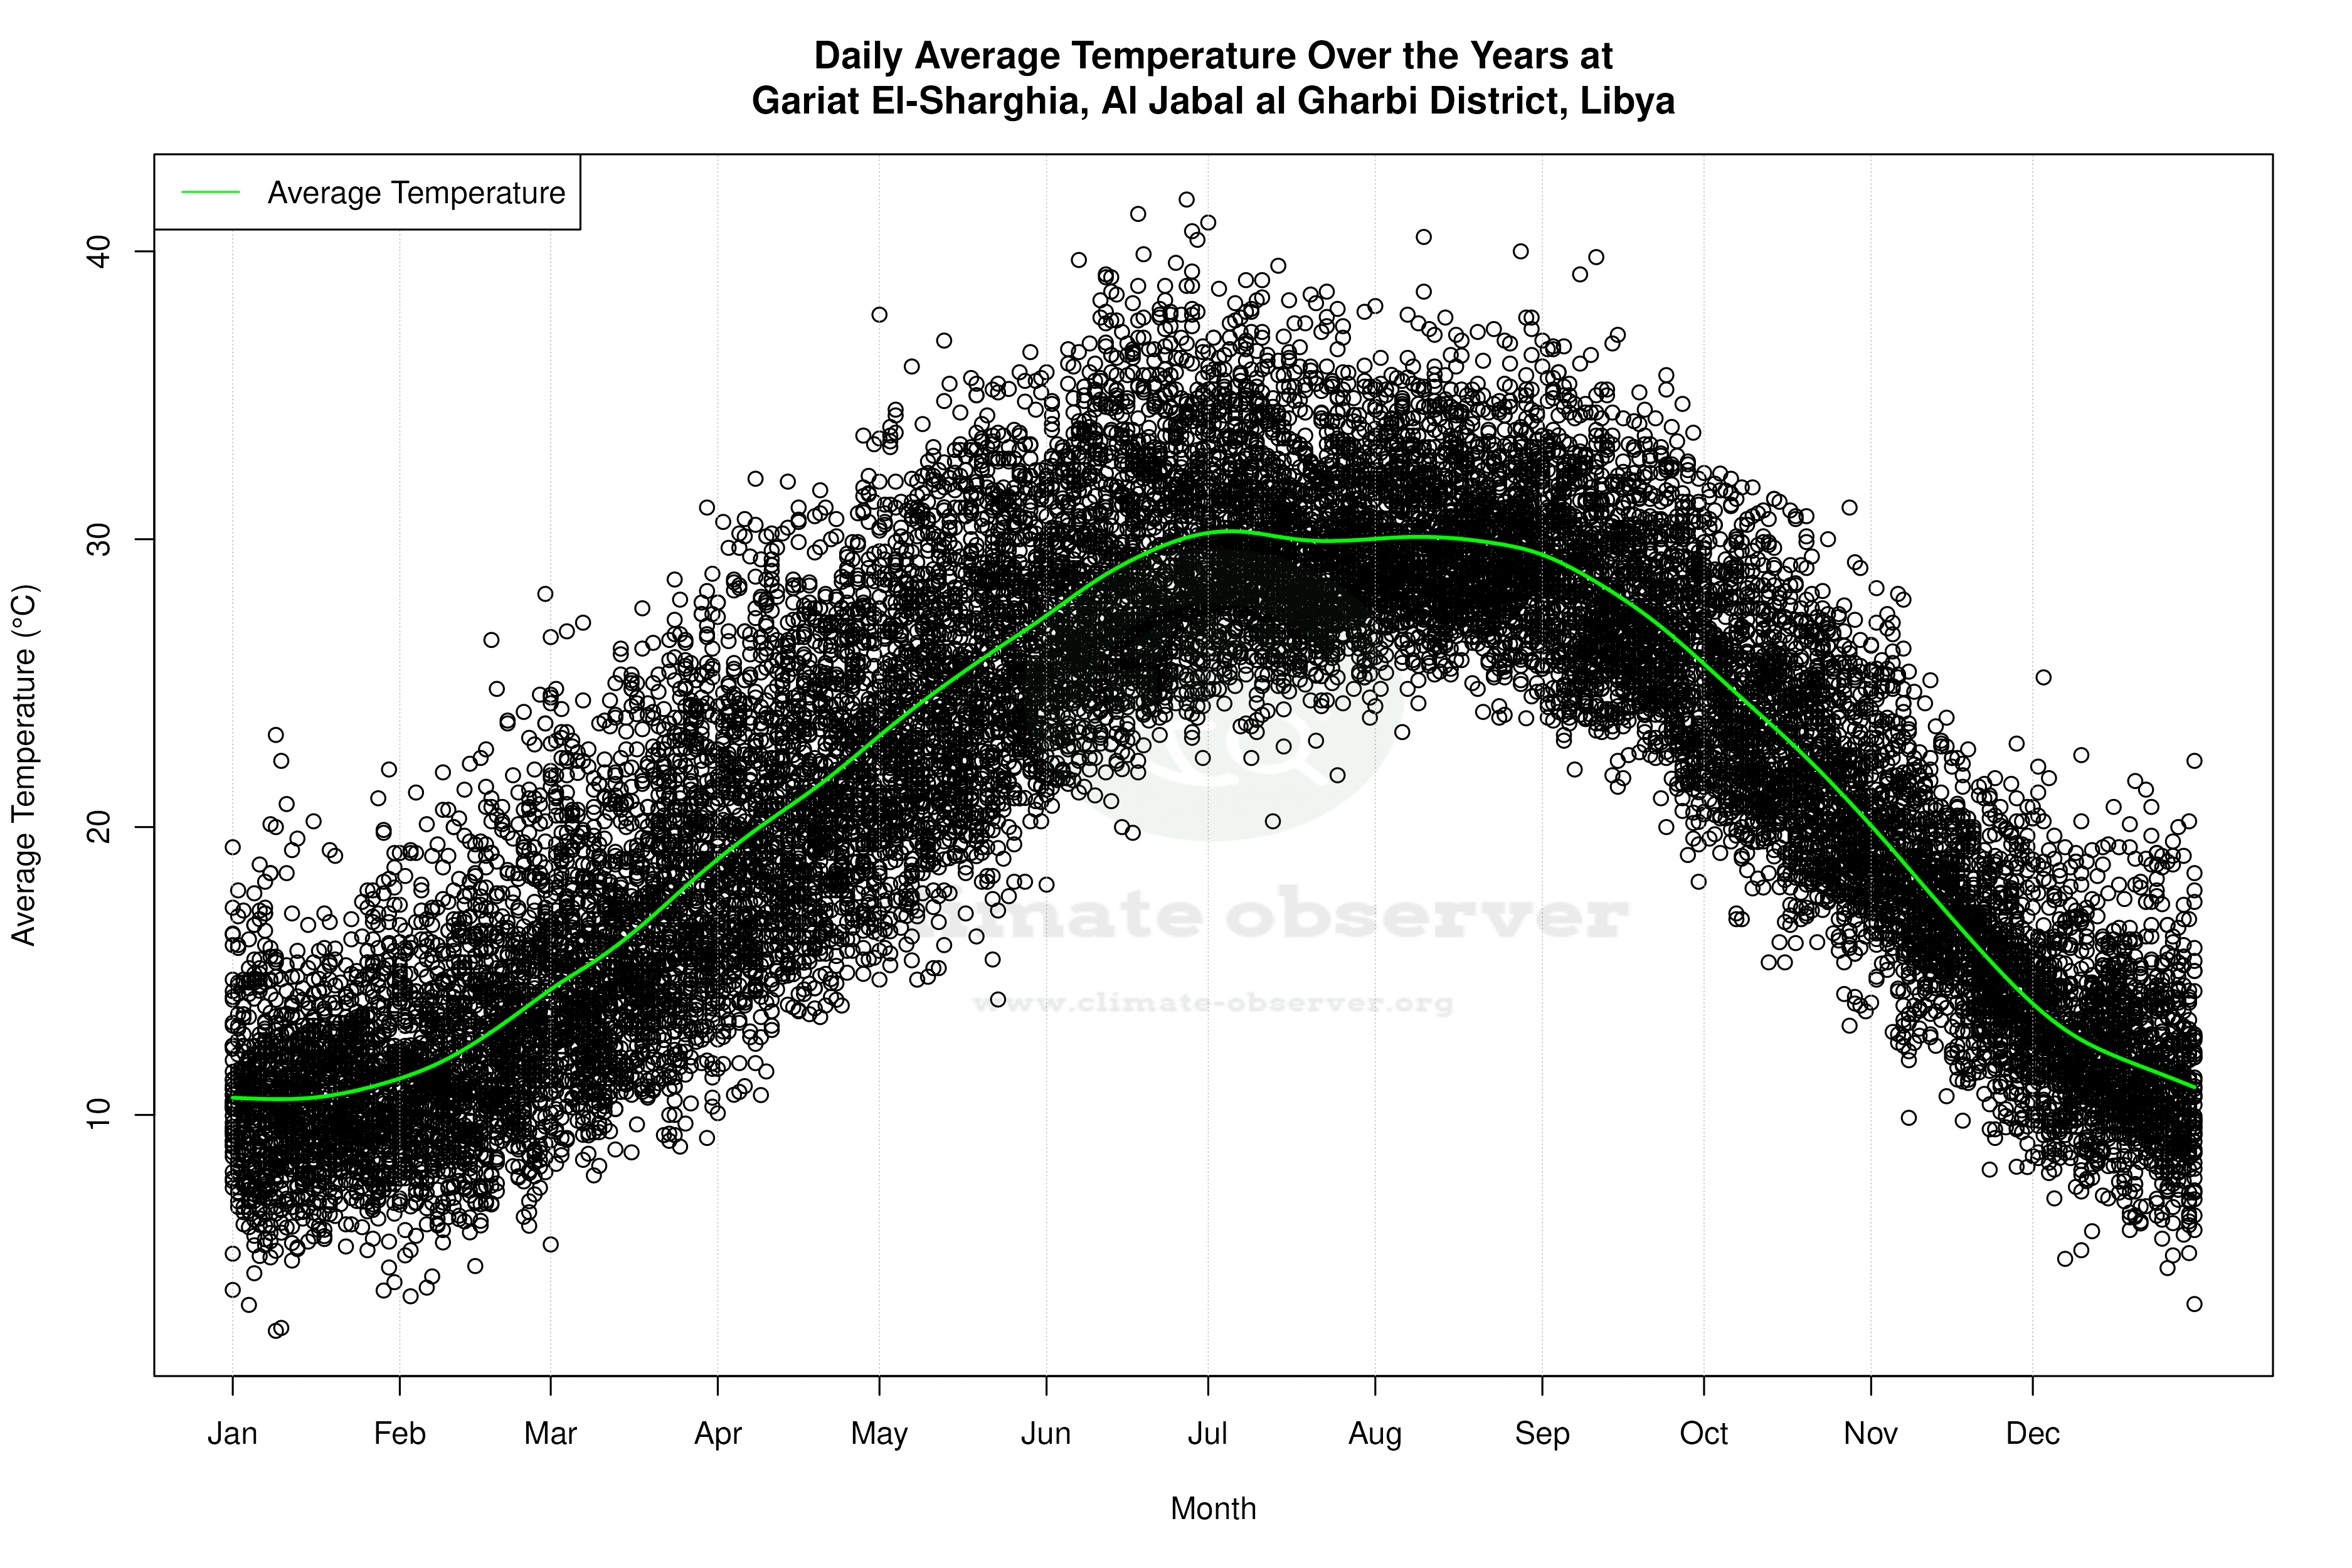

Average Max Temperature Throughout Year | 1 of 5
