Climate for Station: Obari, Wadi al Hayaa District, Libya
Loading live weather...
Climate Analysis & Overview
Obari, nestled in the heart of Libya's desert landscape, is experiencing a warming trend, particularly in nighttime temperatures. While precipitation remains highly concentrated, slight changes suggest a more even distribution of rainfall. These shifts are crucial as Libya strives to adapt to climate variability.
Desert Climate Dynamics
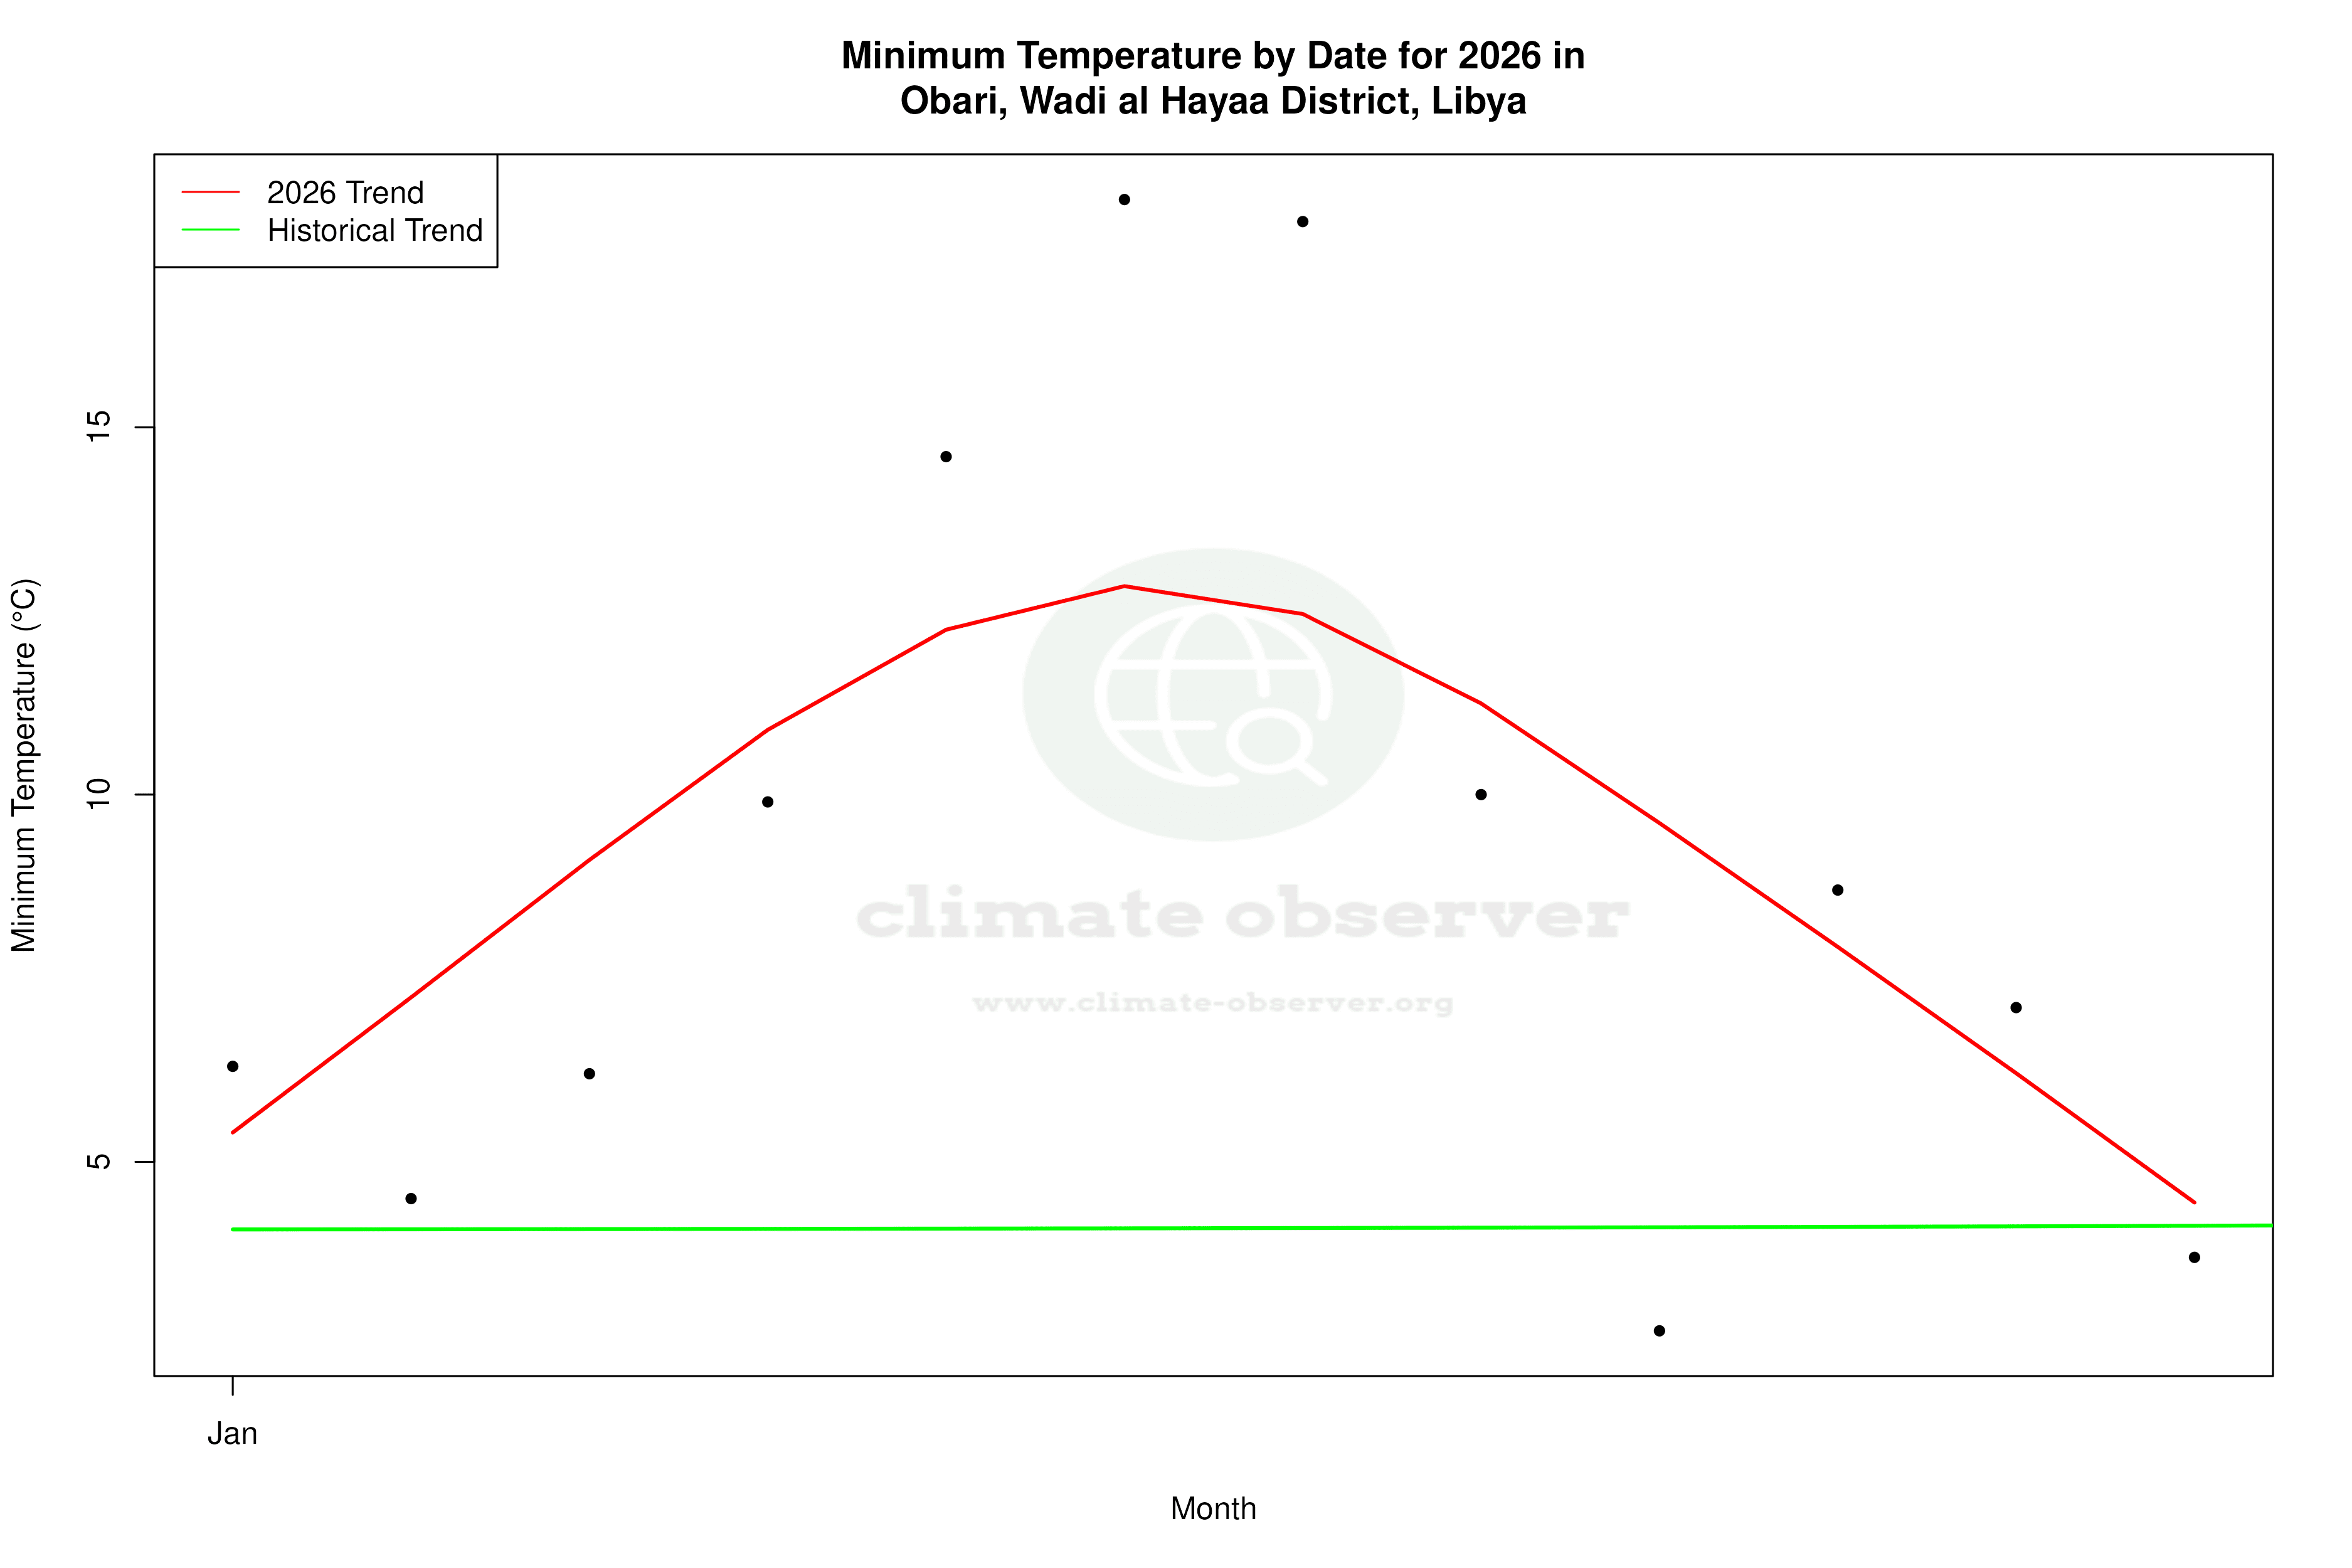
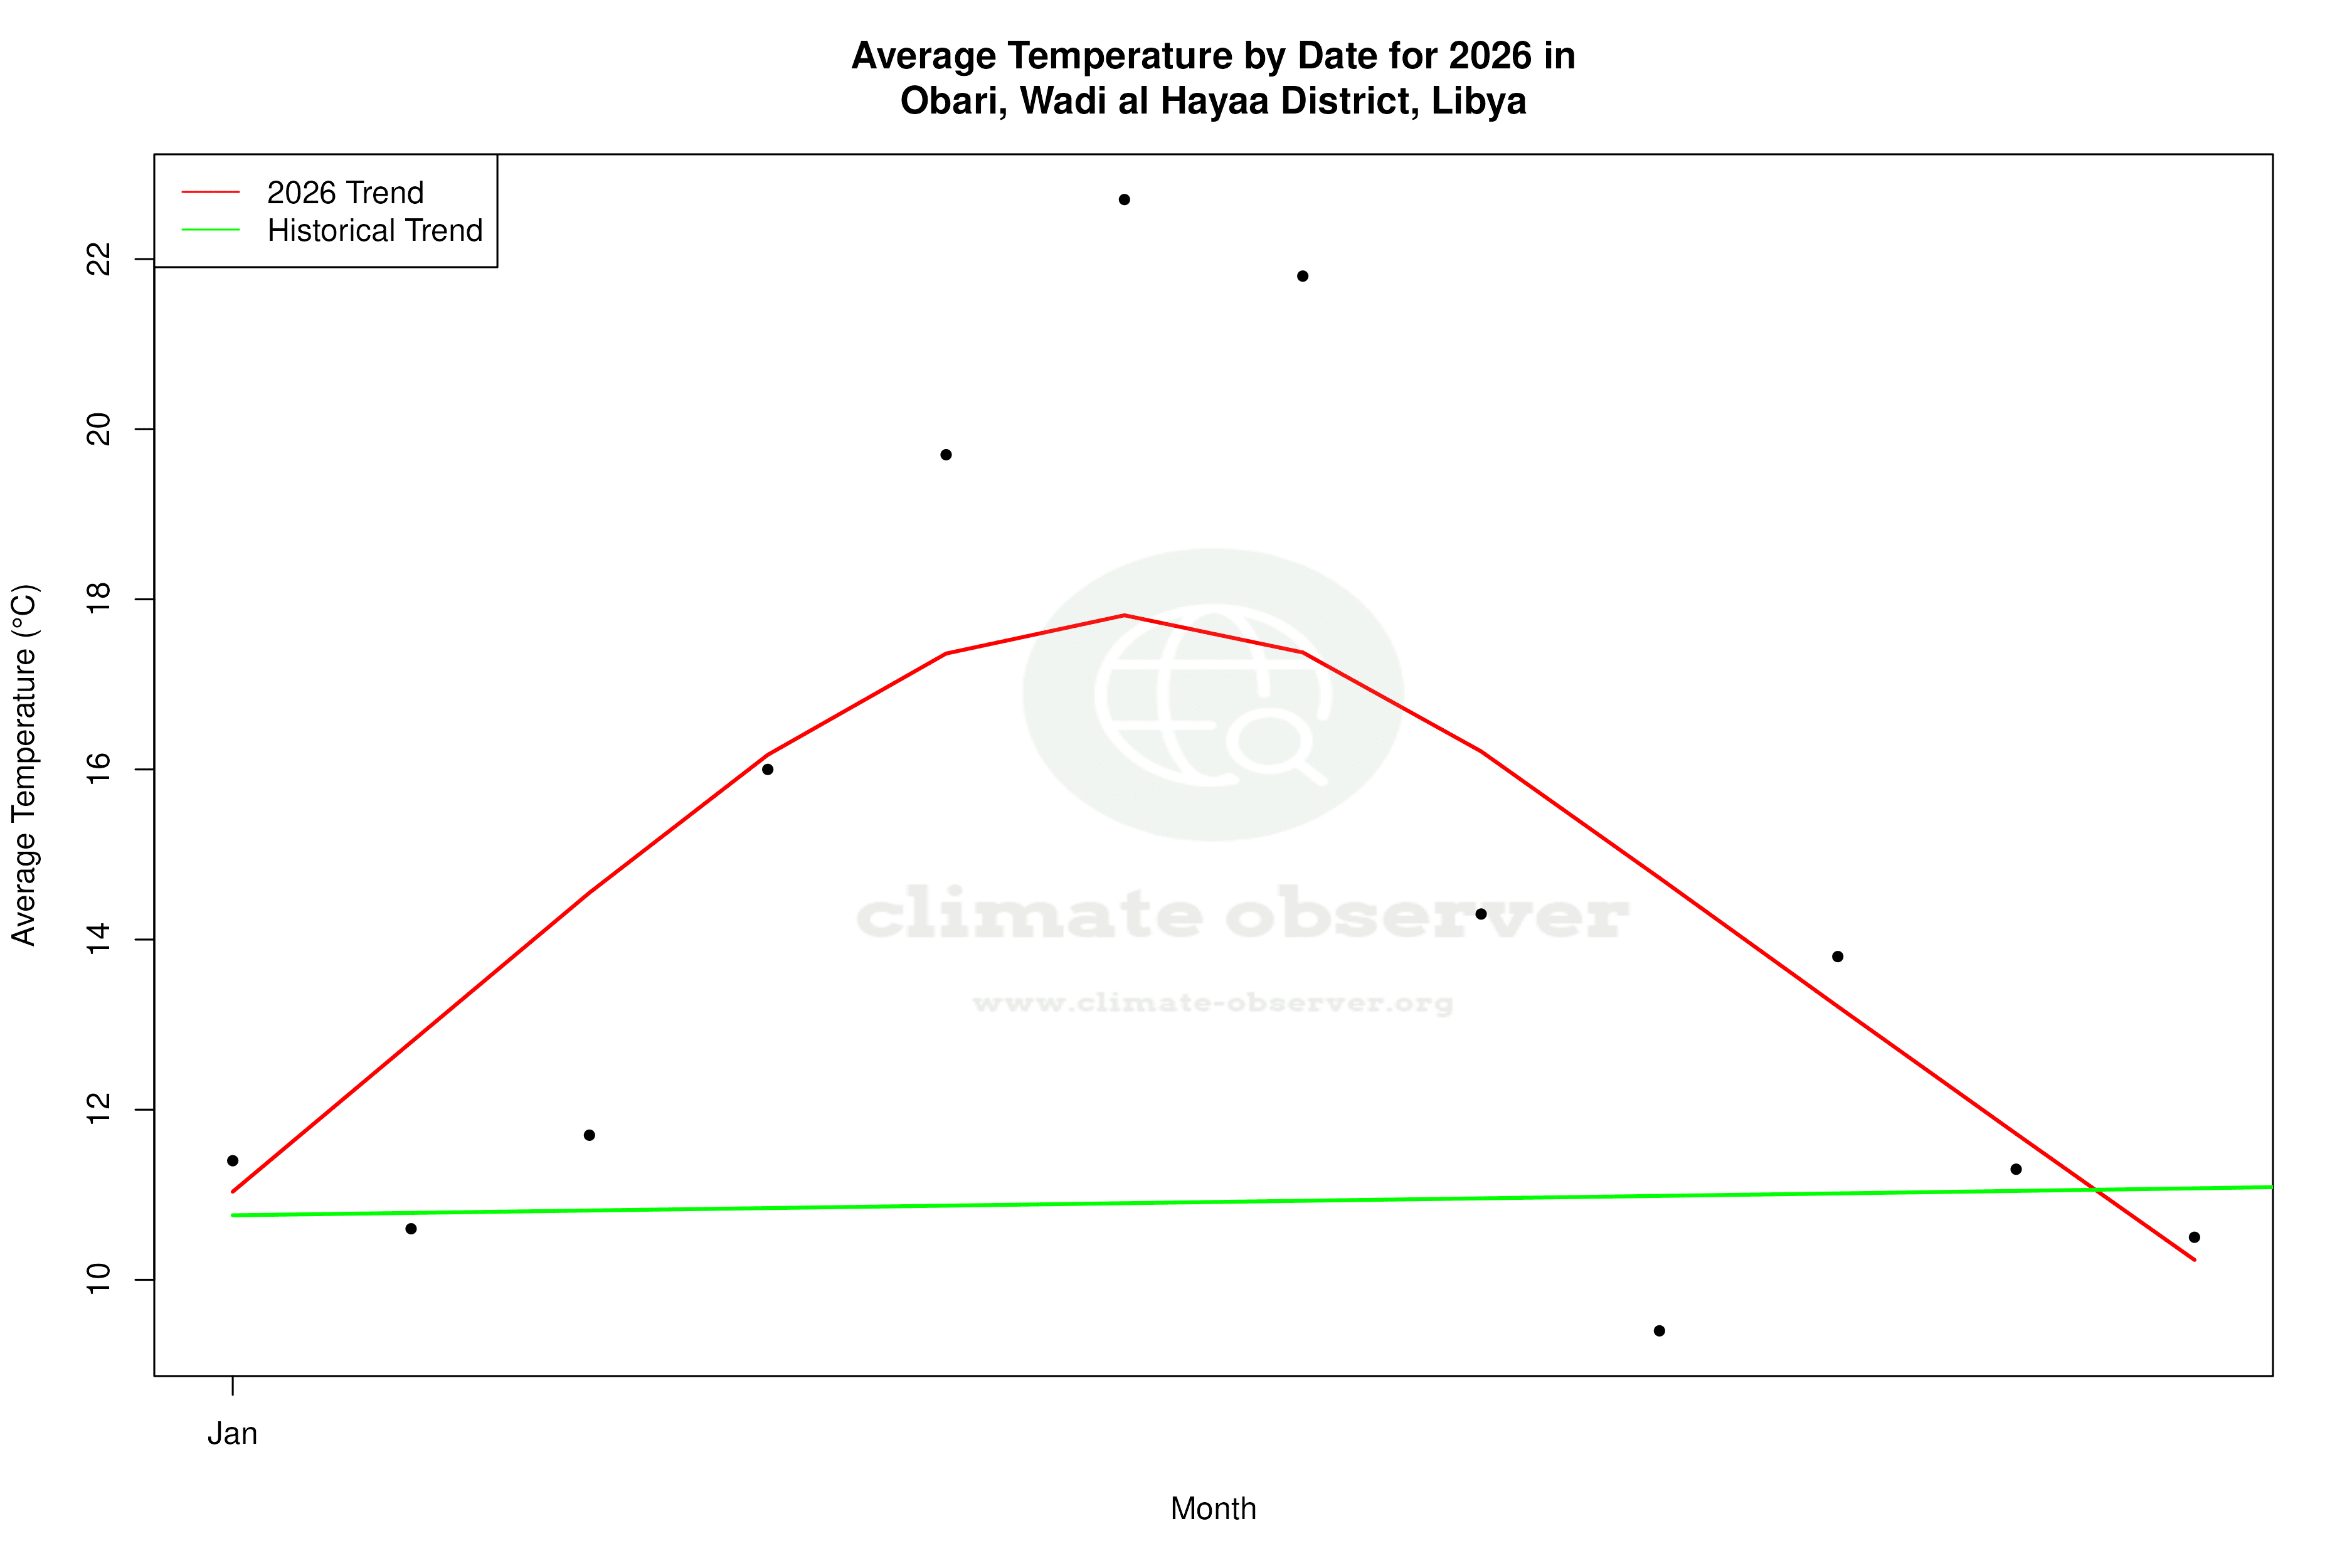
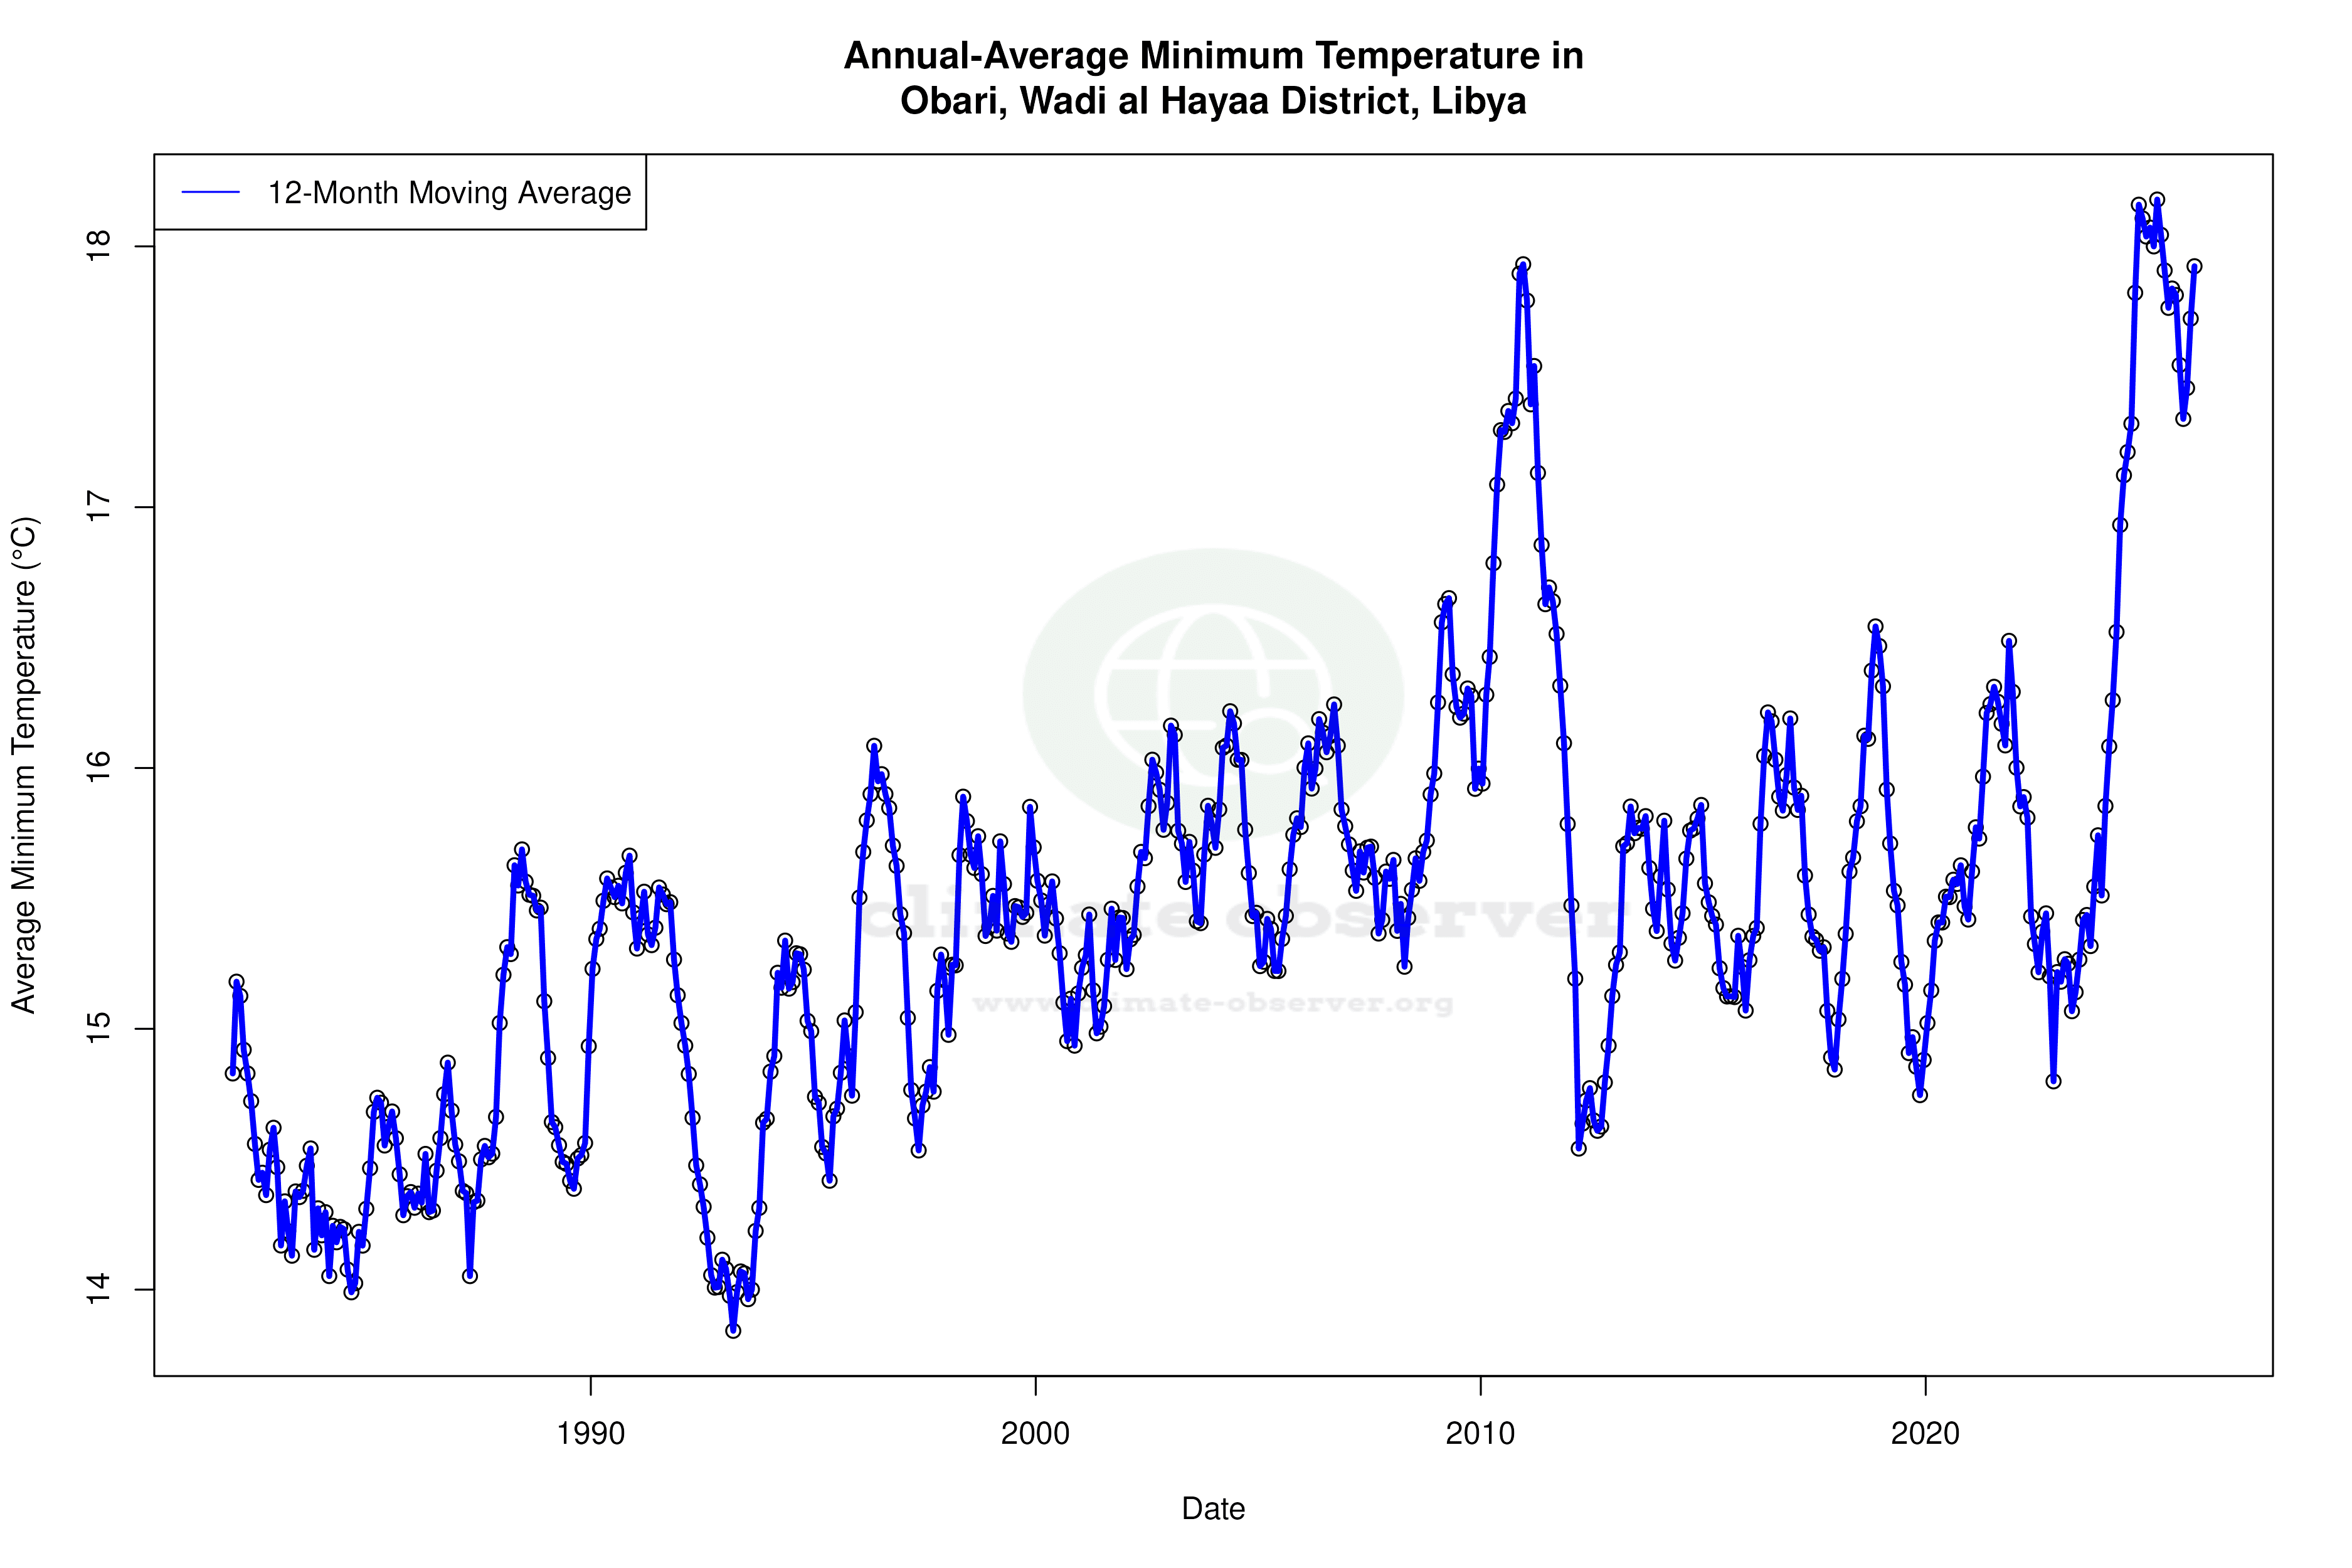
Obari is classified under the BWh category of the Köppen climate classification, indicating a hot desert climate. This classification is characterised by extremely high temperatures and minimal precipitation. The region's geography, dominated by vast desert expanses, contributes to its extreme temperature fluctuations. The all-time temperature trends reveal a warming of 0.28°C (0.50°F) for highs and 0.43°C (0.77°F) for lows. These figures suggest a gradual rise in both daytime and nighttime temperatures, with nighttime temperatures warming more significantly.
Recent Temperature Trends
Over the past decade, Obari has experienced more pronounced warming trends. High temperatures have increased by 0.75°C (1.35°F), while low temperatures have surged by 2.13°C (3.84°F). This notable rise in nighttime temperatures could be indicative of changes in atmospheric conditions, possibly linked to increased greenhouse gas concentrations or urban heat effects. Such trends are critical as they can exacerbate heat stress, affecting both human health and local ecosystems.
Extremes and Records
Obari's climate is marked by extreme temperatures, with record highs and lows that underscore its desert environment. The highest recorded temperature is a scorching 48.5°C (119.3°F), while the lowest plummets to a frigid -6.5°C (20.3°F). These extremes highlight the region's vulnerability to temperature variability, which can have profound implications for water resources and energy demands.
Precipitation Patterns
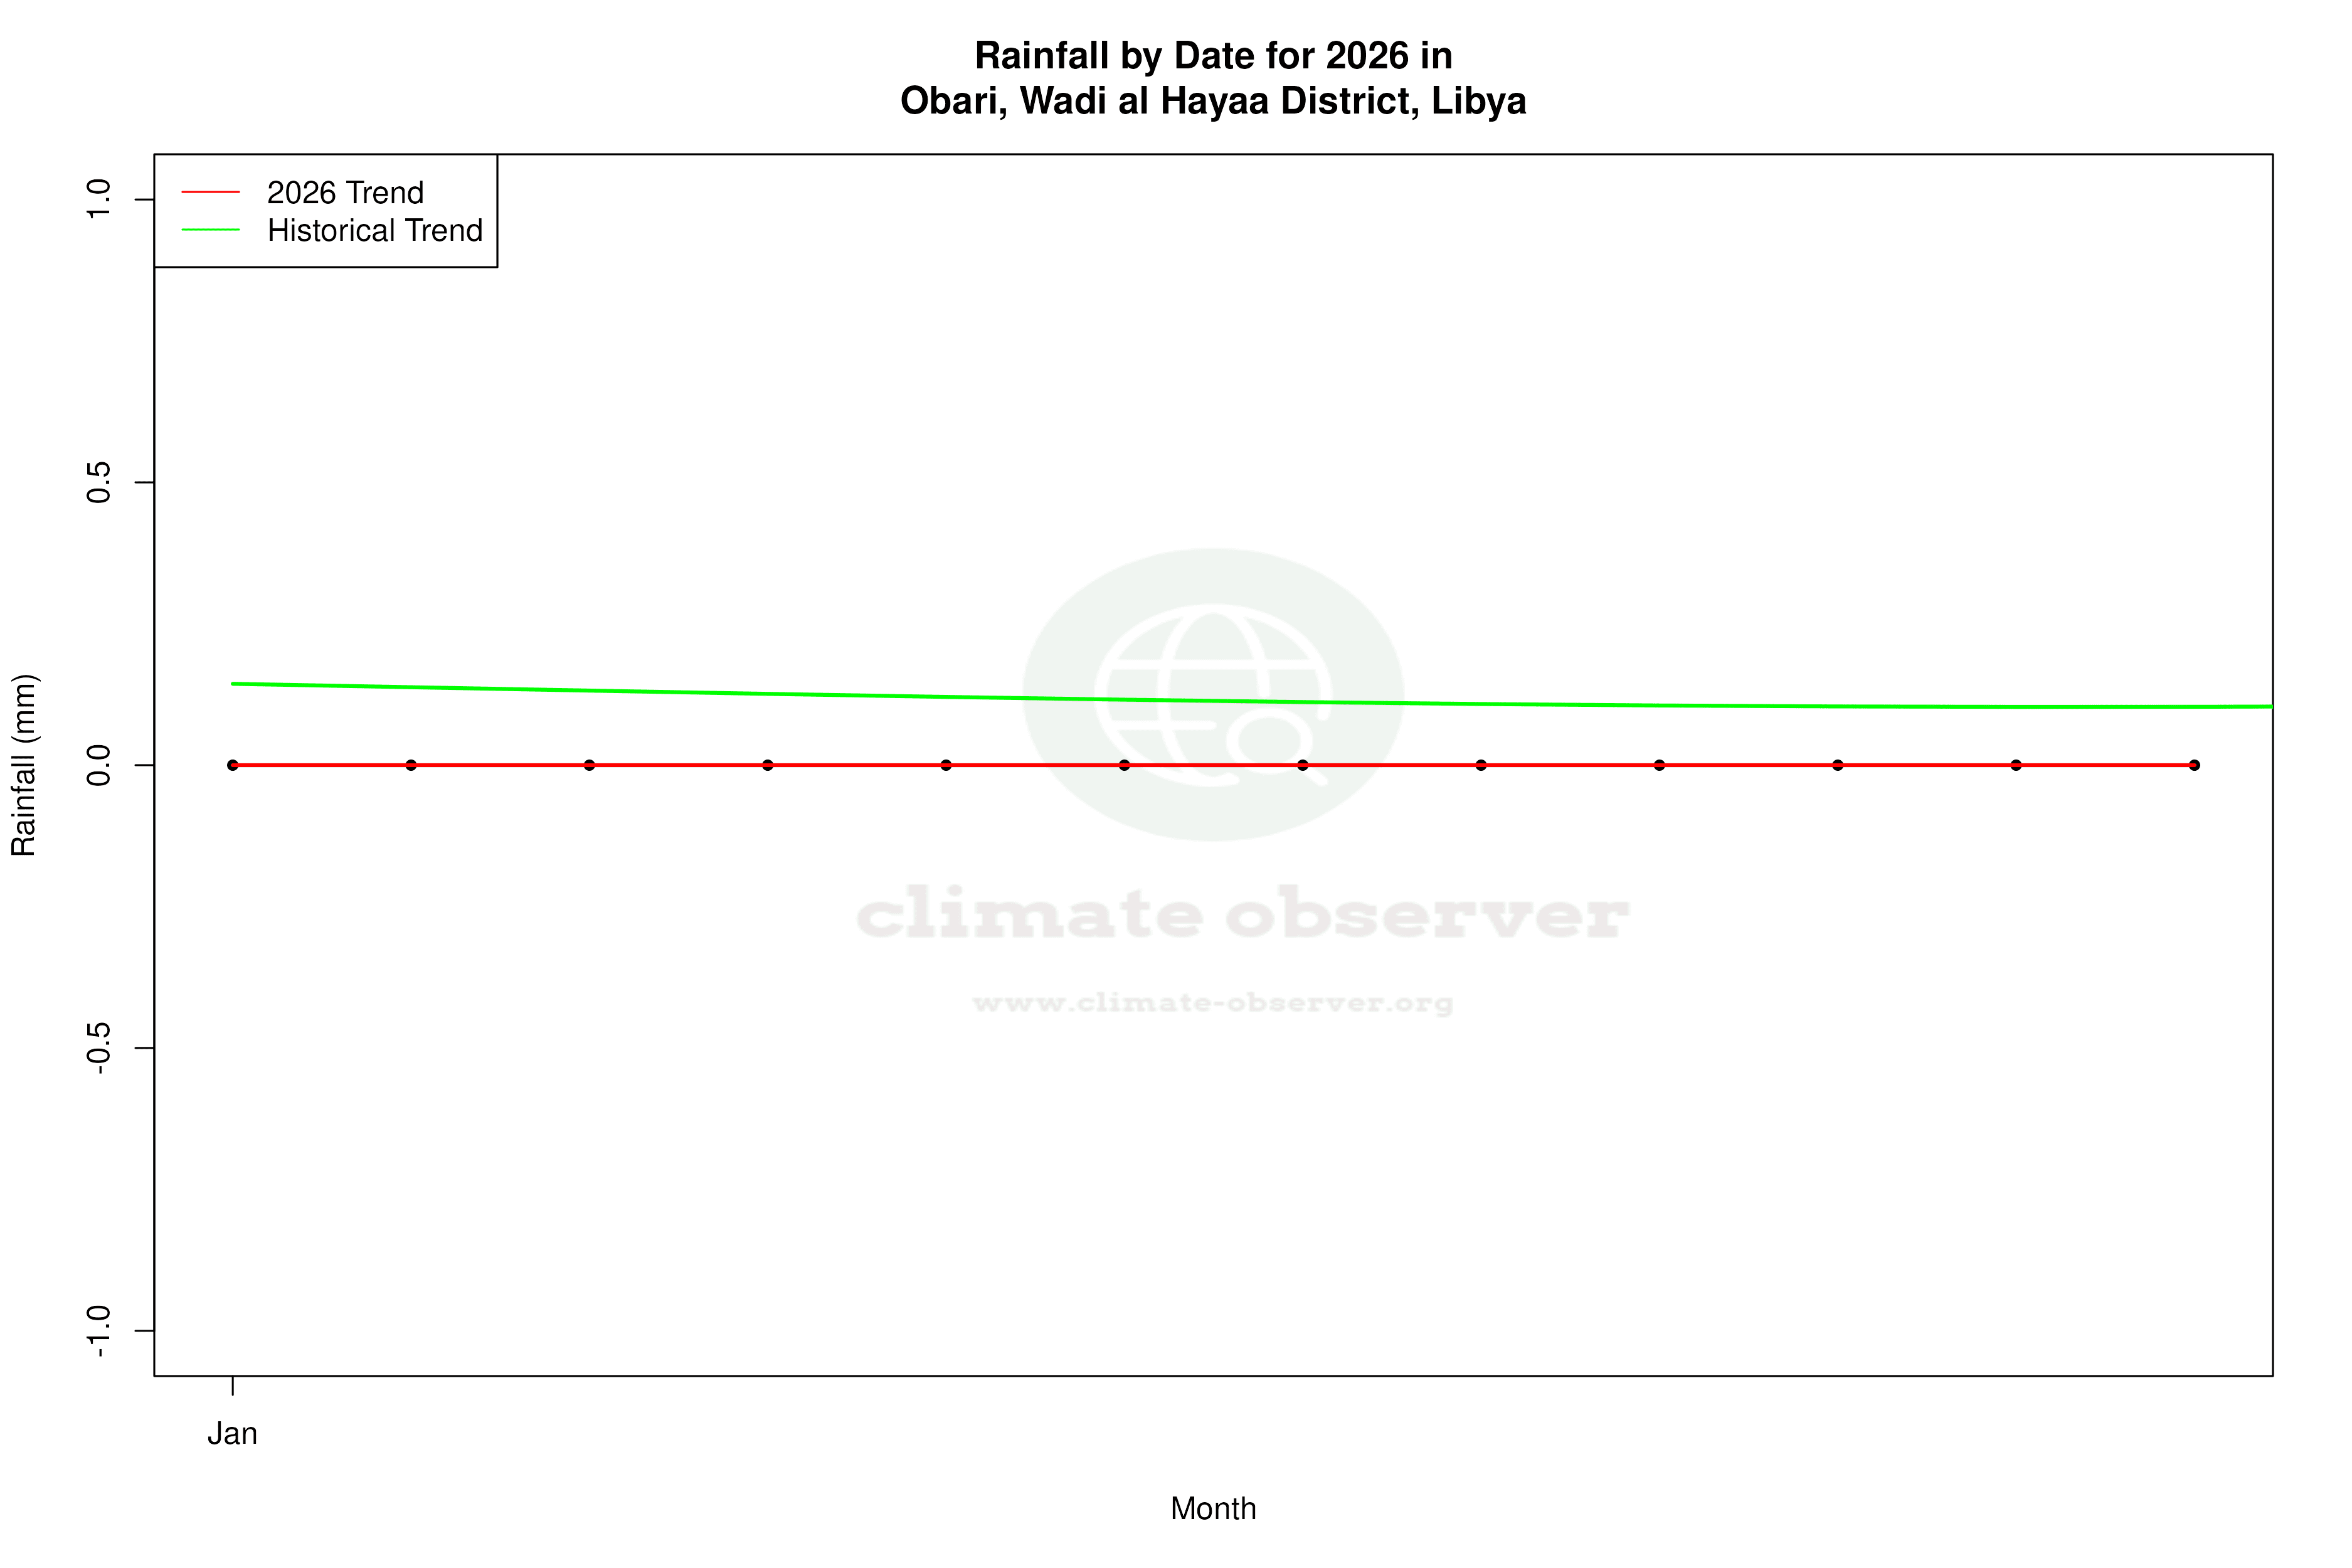
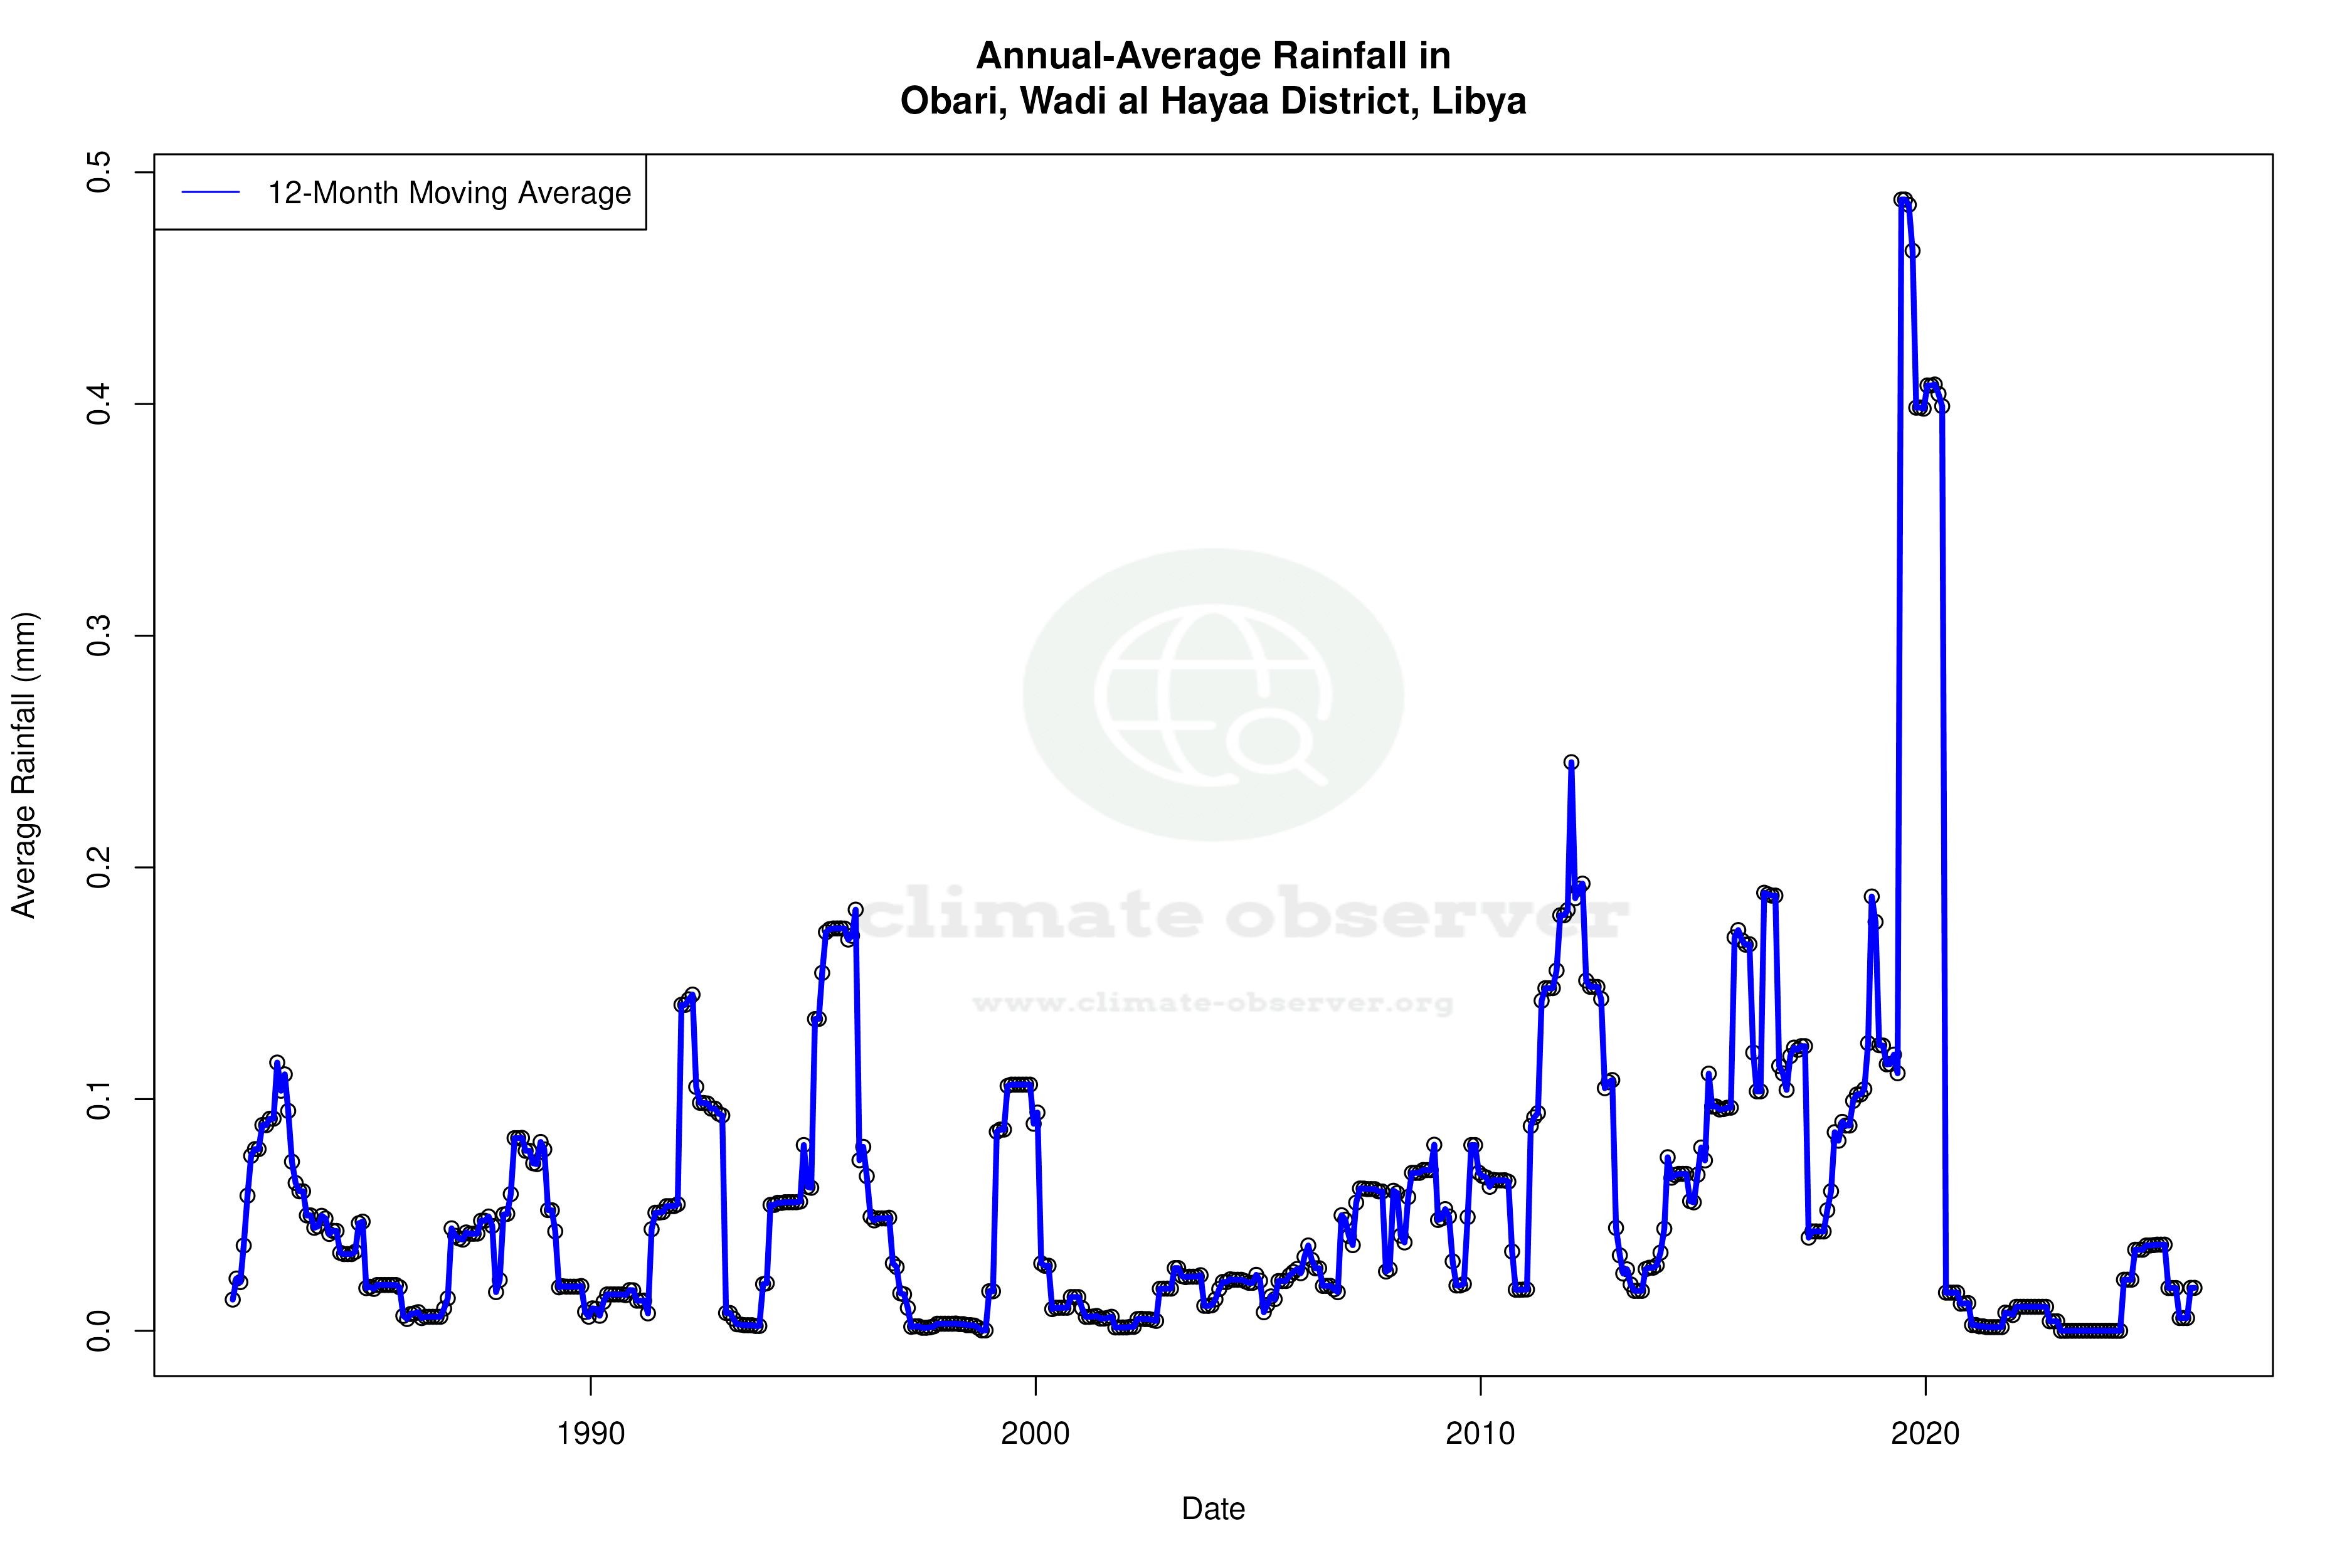
The Precipitation Concentration Index (PCI) for Obari has shown a slight decrease from a baseline of 47.80 to a current value of 47.54. This marginal change indicates a slightly more even distribution of rainfall events, although precipitation remains highly concentrated. Given that a PCI over 20 signifies concentrated rainfall, Obari's precipitation pattern remains consistent with its desert climate, where rain falls in intense, sporadic events.
Regional Climate Context
Libya's climate goals focus on enhancing resilience to climate change, particularly in arid regions like Obari. The observed warming trends, especially in nighttime temperatures, align with broader regional patterns of climate change. As Libya works towards sustainable water management and agricultural practices, understanding these localised climate dynamics is essential for informed policy-making and adaptation strategies.
Station Statistics
10-Year Trend
High: +0.83 °C/decade
Low: +1.87 °C/decade
Rain: -0.19 mm/decade
25-Year Trend
High: -0.30 °C/decade
Low: +0.26 °C/decade
Rain: +0.02 mm/decade
50-Year Trend
High: +0.28 °C/decade
Low: +0.41 °C/decade
Rain: +0.01 mm/decade
All-Time Trend
High: +0.28 °C/decade
Low: +0.41 °C/decade
Rain: +0.01 mm/decade
Percentage Above-Average Days
Last 12 Months: 57.3%
This Year: 71.1%
Precipitation Concentration Index (PCI) ℹ️
Last 12 Months: 67.6
Historical Average: 49.3
Percentile Rank of Last 12 Months ℹ️
High: 75th percentile
Low: 97th percentile
Rain: 39th percentile
Change in Variance ℹ️
High: -1.7%
Low: +9.6%
Intraday: +14.8%
Data Coverage
100.0%
First Year of Data
1981
Station Location
Historical Weather Records
| Max High | Avg High | Min High | Max Avg | Avg Avg | Min Avg | Max Low | Avg Low | Min Low | Max Precipitation | Avg Precipitation | Max Snow | Avg Snow | |
|---|---|---|---|---|---|---|---|---|---|---|---|---|---|
| Record | 48.5 °C | — | 8.1 °C | 43.2 °C | — | 1.8 °C | 34.5 °C | — | -6.5 °C | 57.8 mm | — | — | — |
| January | 31.7 °C | 18.6 °C | 8.1 °C | 26.1 °C | 11.4 °C | 1.8 °C | 18.1 °C | 4.3 °C | -5.0 °C | 31.0 mm | 0.1 mm | — | — |
| February | 36.6 °C | 21.7 °C | 9.1 °C | 29.2 °C | 14.1 °C | 3.9 °C | 22.9 °C | 6.1 °C | -6.5 °C | 19.4 mm | 0.1 mm | — | — |
| March | 39.4 °C | 26.8 °C | 14.6 °C | 34.2 °C | 19.1 °C | 6.9 °C | 27.0 °C | 10.7 °C | 1.2 °C | 9.9 mm | 0.0 mm | — | — |
| April | 44.5 °C | 32.5 °C | 16.1 °C | 36.6 °C | 24.8 °C | 11.2 °C | 29.2 °C | 16.2 °C | 3.1 °C | 8.7 mm | 0.0 mm | — | — |
| May | 45.3 °C | 36.5 °C | 22.9 °C | 41.1 °C | 29.2 °C | 16.2 °C | 34.5 °C | 20.7 °C | 10.3 °C | 20.5 mm | 0.1 mm | — | — |
| June | 48.5 °C | 39.8 °C | 27.6 °C | 43.2 °C | 32.5 °C | 23.1 °C | 32.4 °C | 23.6 °C | 15.8 °C | 57.8 mm | 0.1 mm | — | — |
| July | 47.5 °C | 39.6 °C | 32.9 °C | 41.1 °C | 32.4 °C | 25.8 °C | 33.0 °C | 23.5 °C | 16.0 °C | 1.3 mm | 0.0 mm | — | — |
| August | 47.2 °C | 39.5 °C | 32.5 °C | 41.6 °C | 32.4 °C | 25.1 °C | 34.0 °C | 23.7 °C | 16.0 °C | 3.9 mm | 0.0 mm | — | — |
| September | 45.2 °C | 37.7 °C | 28.3 °C | 41.6 °C | 30.3 °C | 22.7 °C | 32.8 °C | 22.2 °C | 10.7 °C | 12.6 mm | 0.0 mm | — | — |
| October | 43.8 °C | 32.3 °C | 21.4 °C | 34.9 °C | 25.1 °C | 15.6 °C | 29.0 °C | 17.5 °C | 7.3 °C | 10.6 mm | 0.1 mm | — | — |
| November | 37.5 °C | 25.7 °C | 14.8 °C | 31.7 °C | 18.3 °C | 8.2 °C | 25.2 °C | 11.1 °C | 1.5 °C | 11.6 mm | 0.0 mm | — | — |
| December | 35.8 °C | 20.0 °C | 10.4 °C | 29.1 °C | 12.8 °C | 3.1 °C | 18.9 °C | 6.0 °C | -3.4 °C | 17.4 mm | 0.1 mm | — | — |
Data Visualisations
Remove WatermarksCurrent Year Climate Trends vs Historical


Max Temperature this Year | 1 of 6
Climate 12-Month Moving Averages
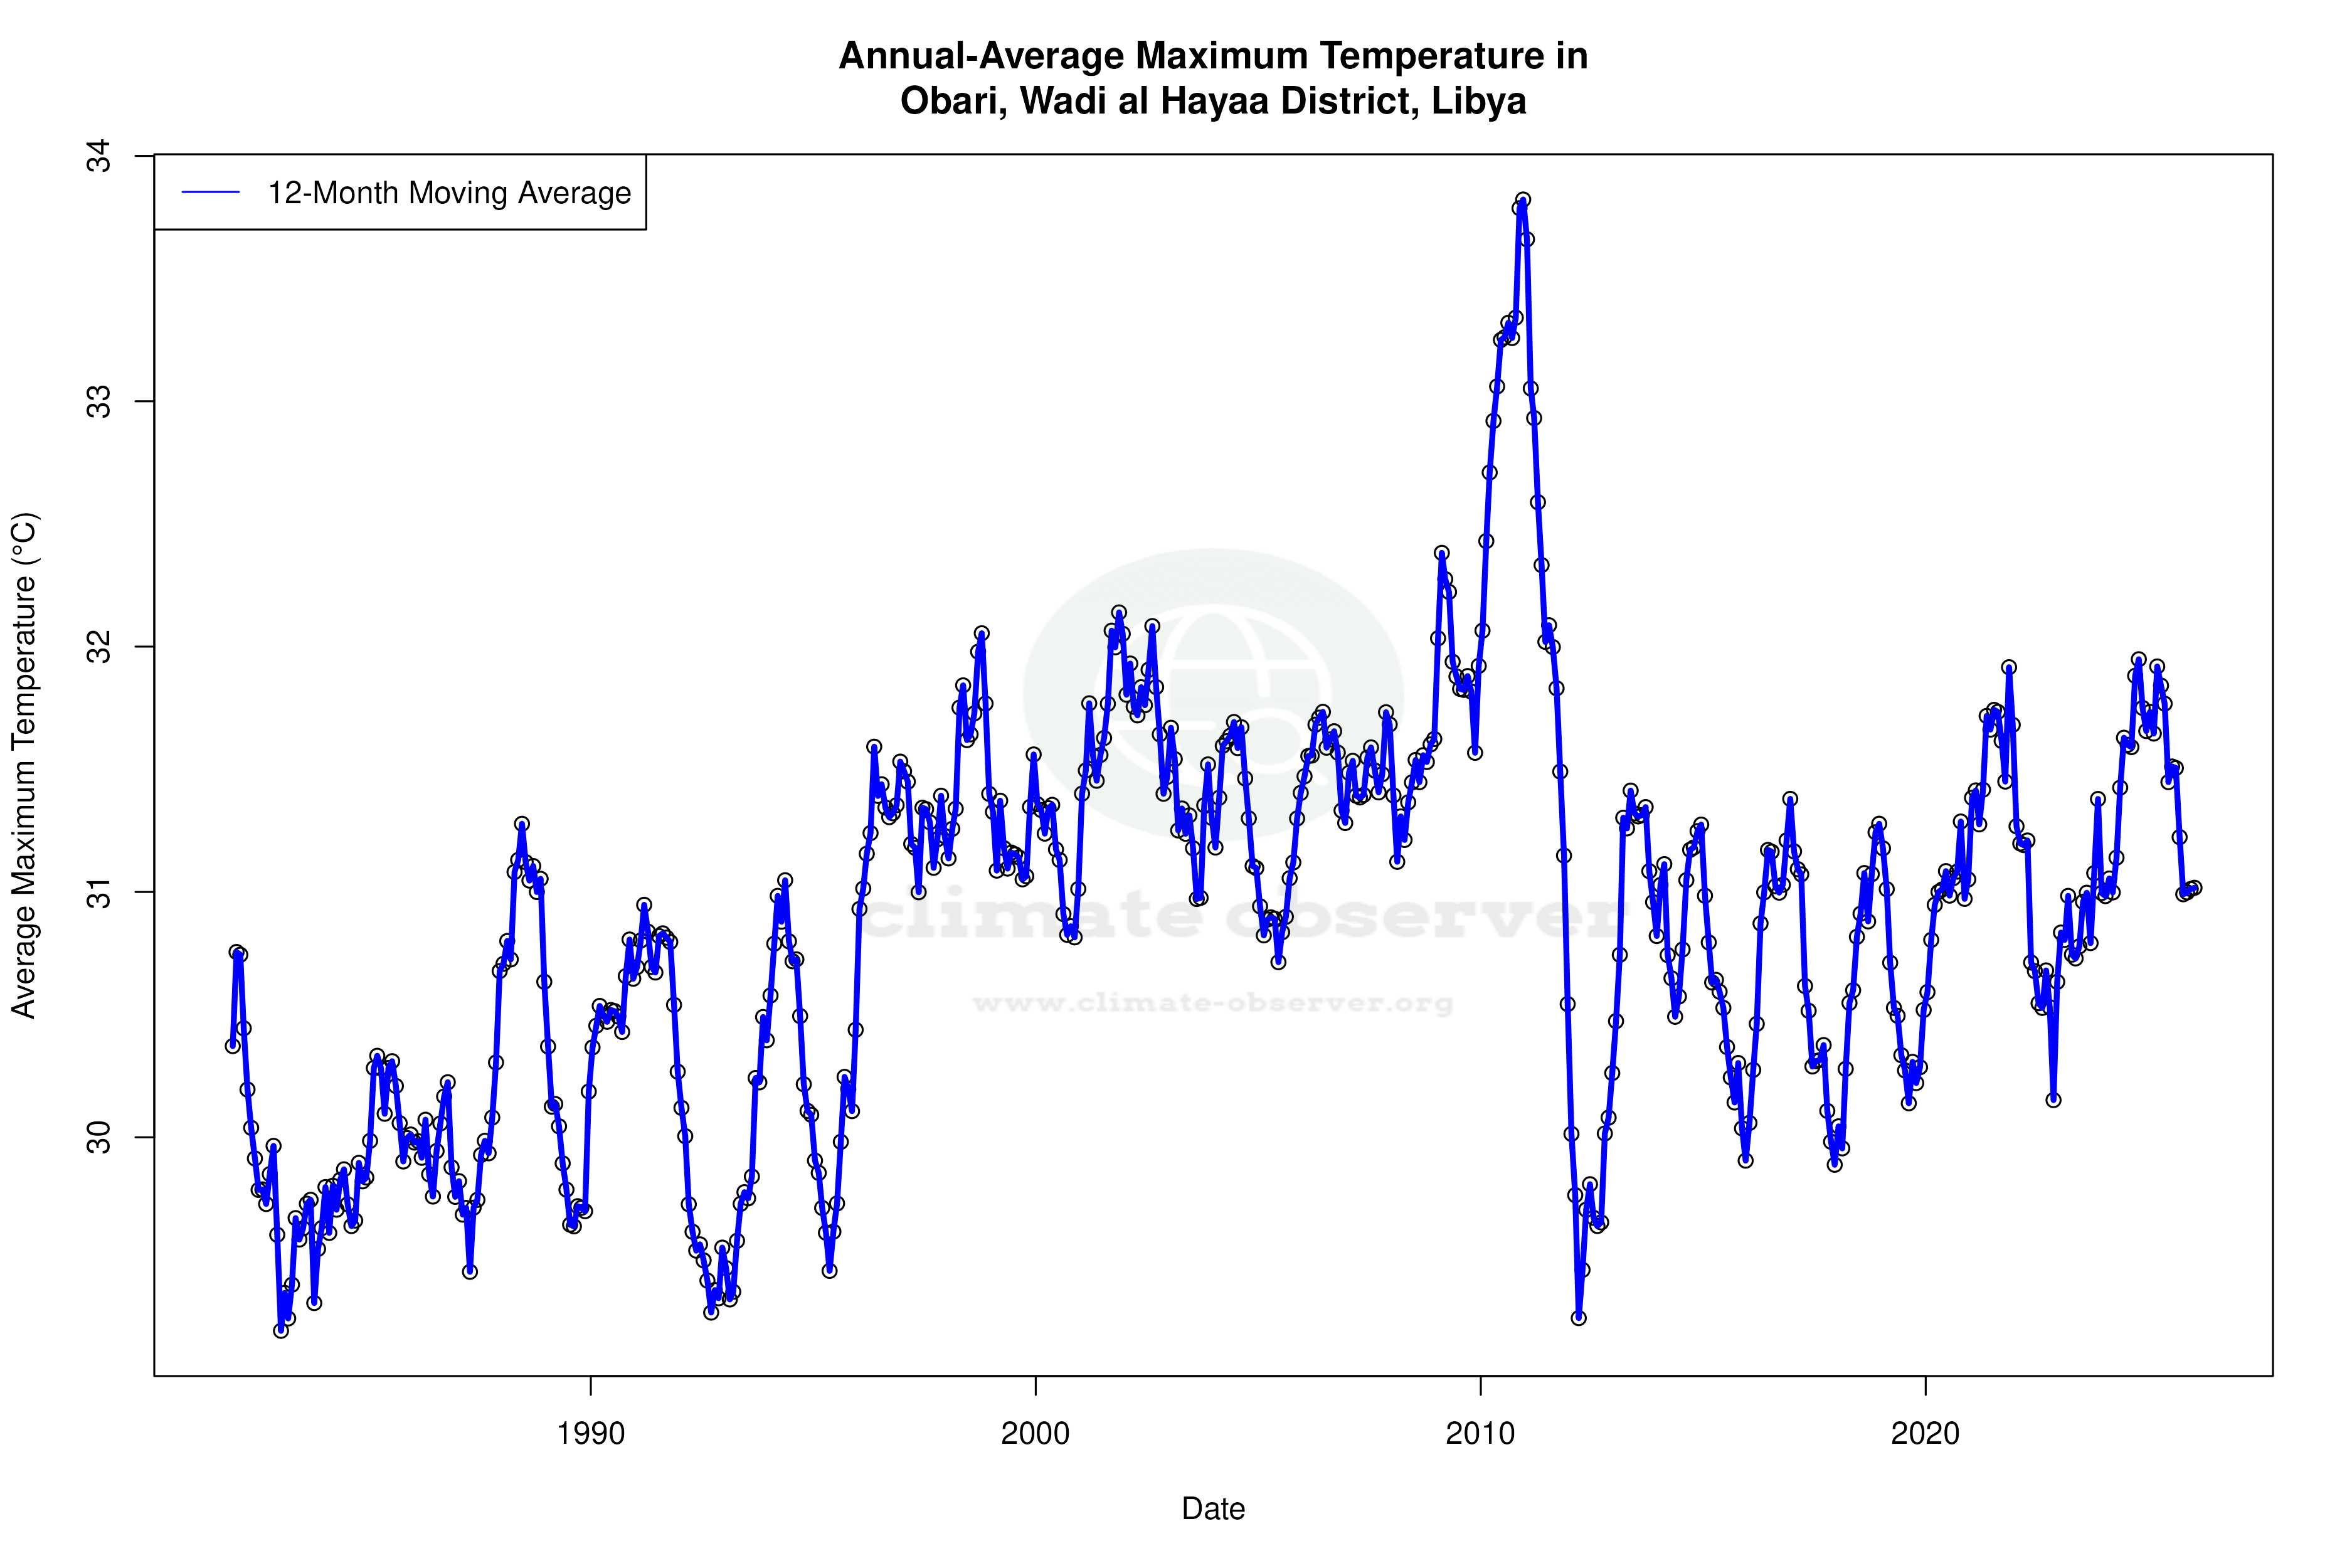


Max Temperature 12-Month MA | 1 of 6
Daily Data Points and Averages Throughout the Year
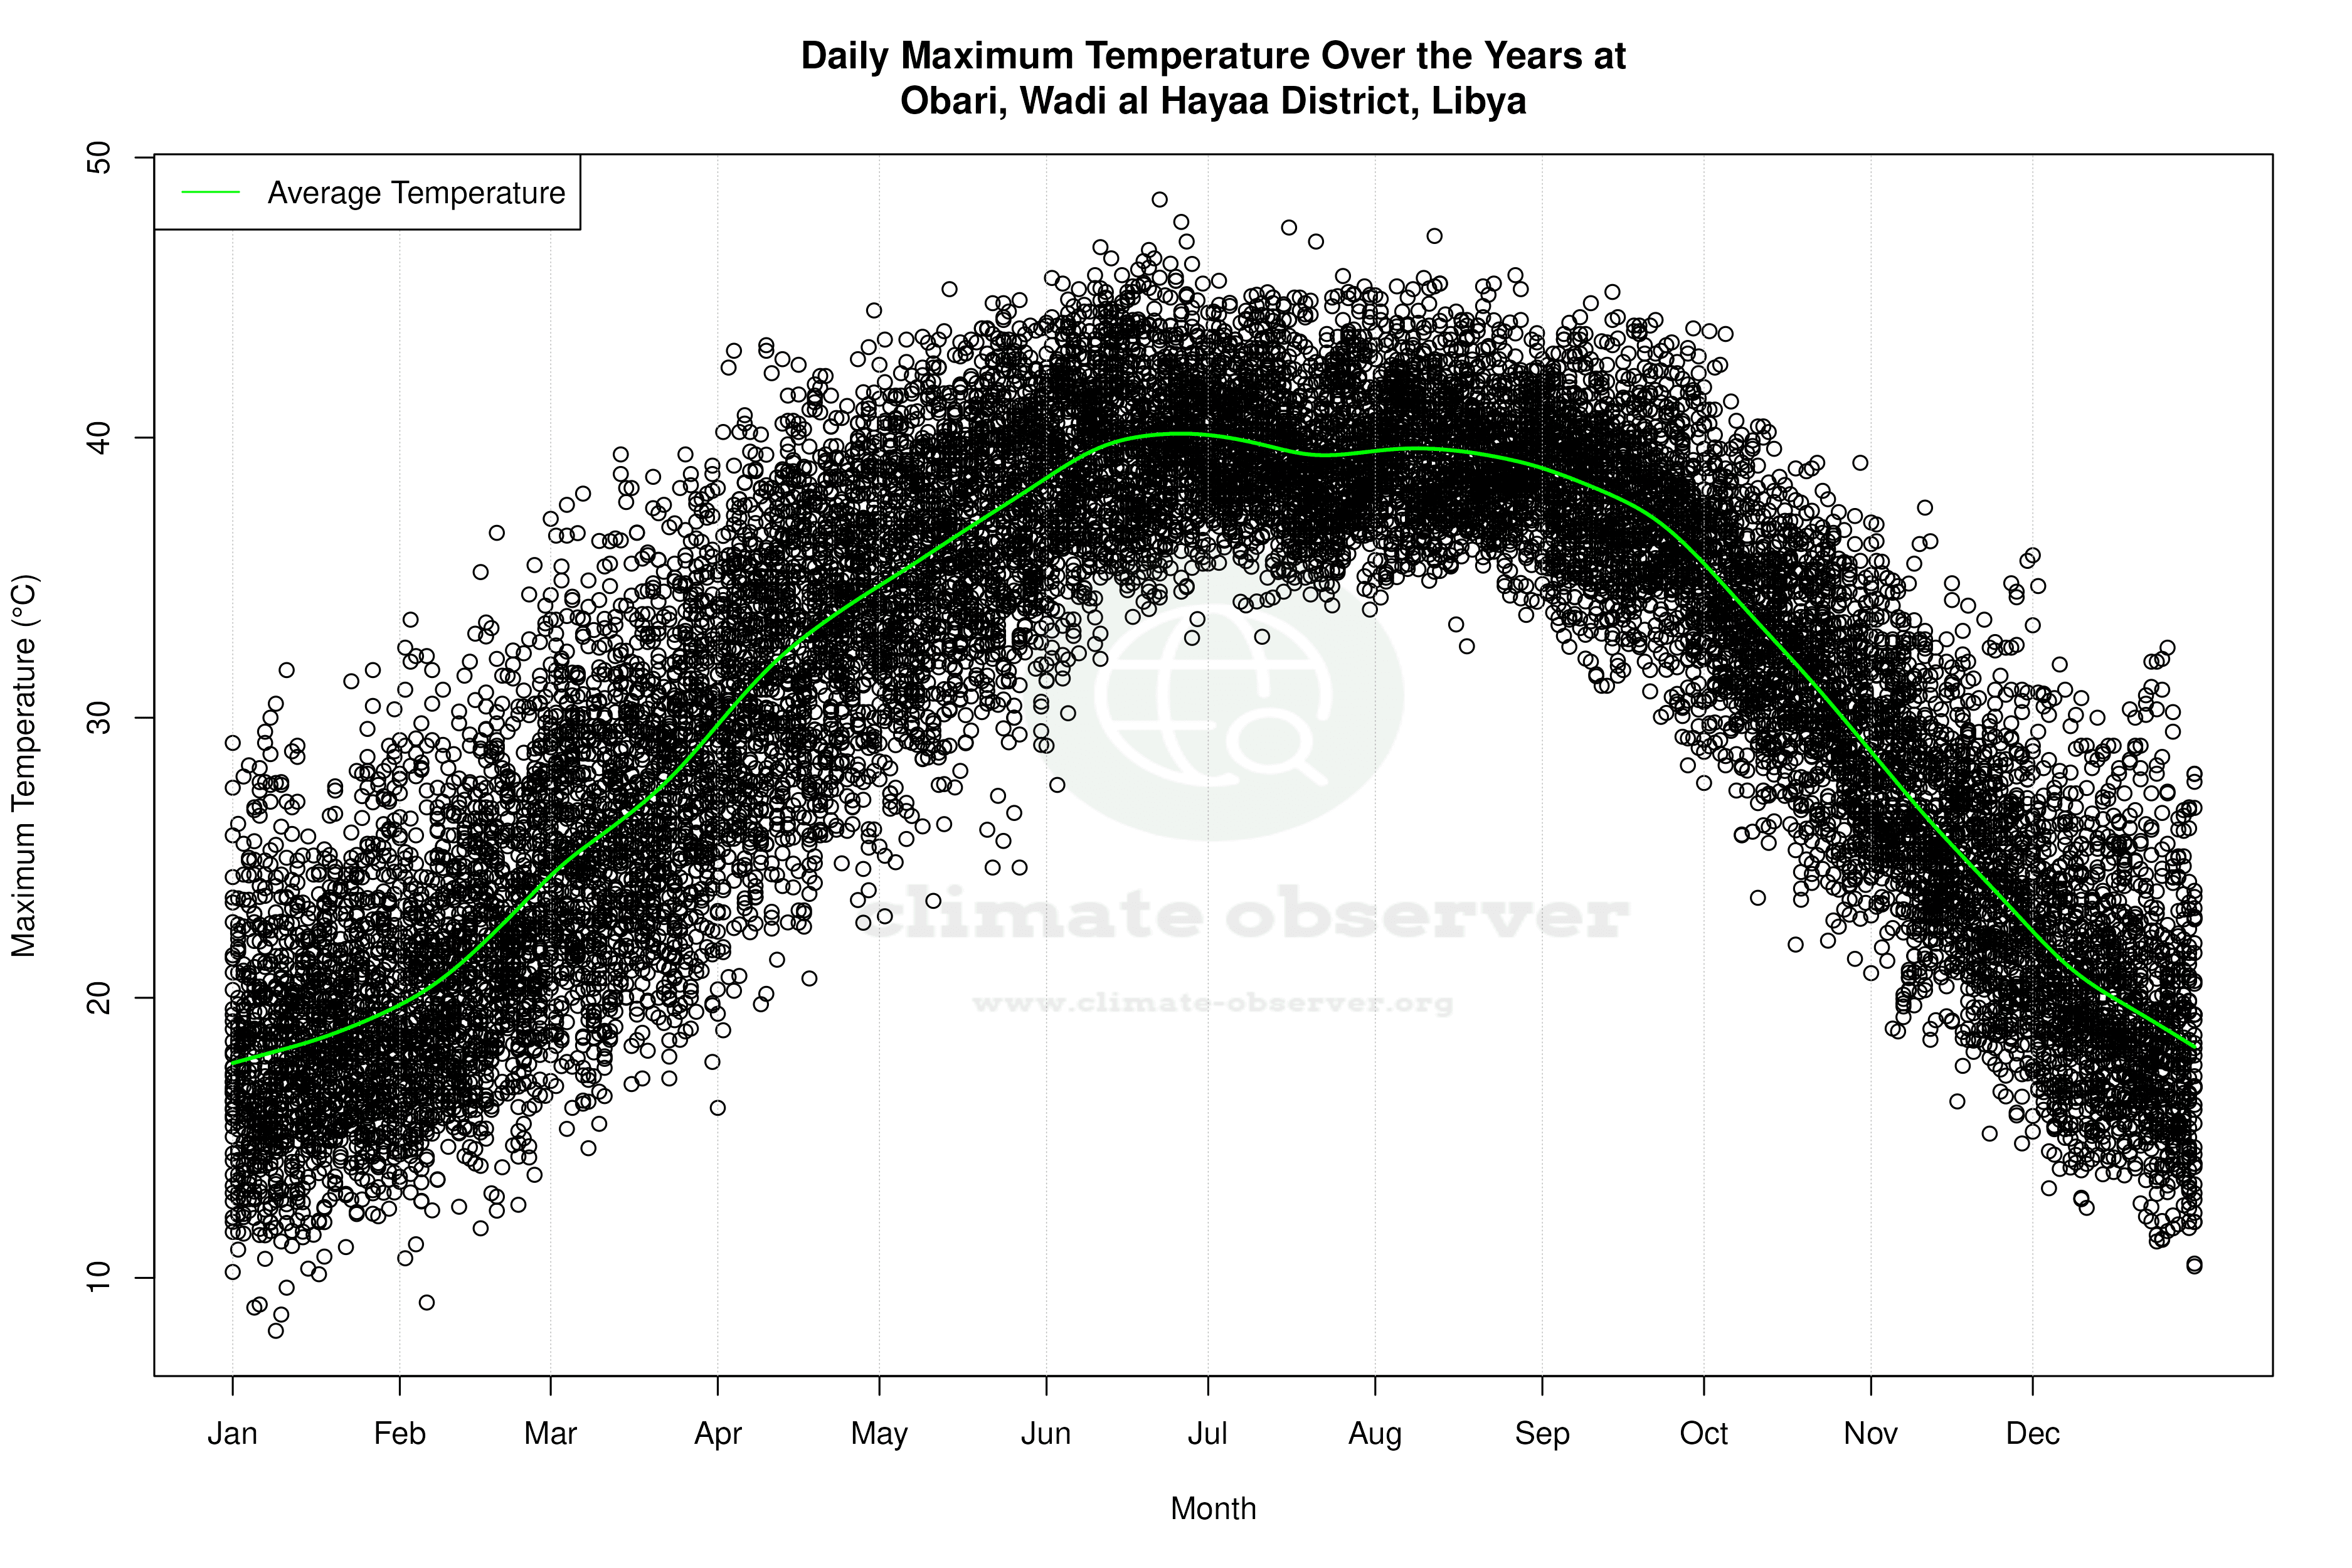
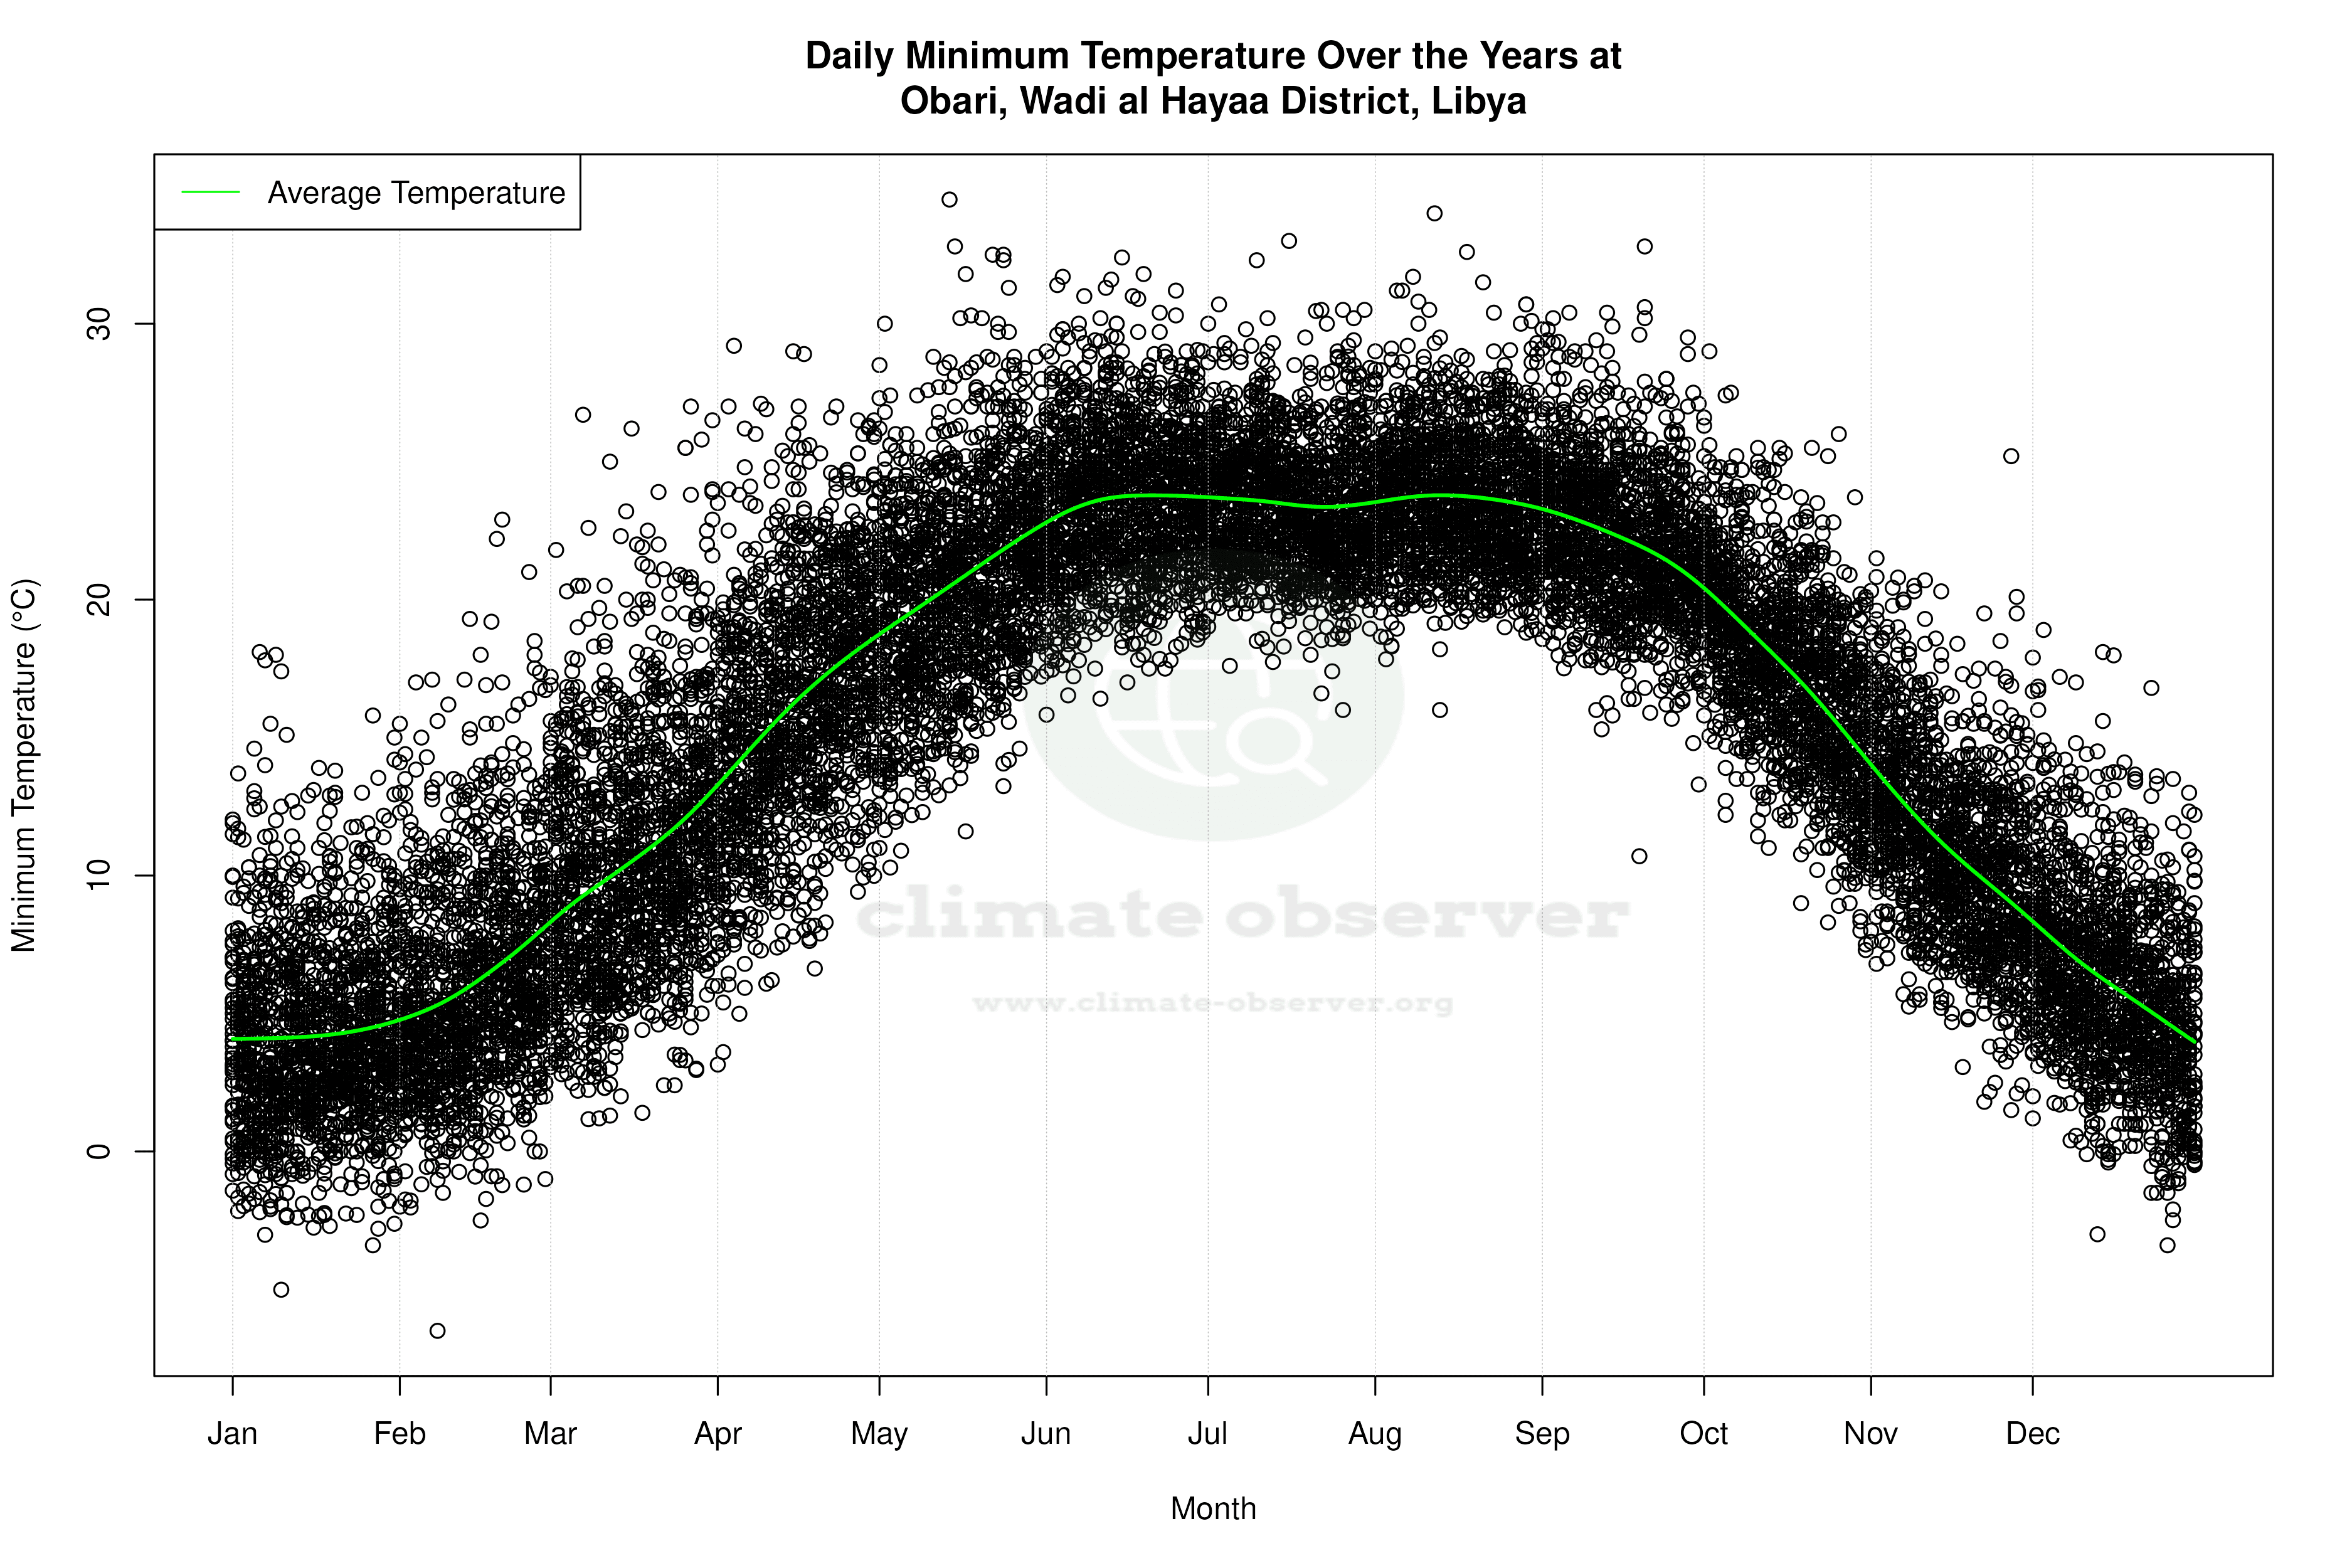


Average Max Temperature Throughout Year | 1 of 5
