Climate for Station: Tazerbo, Al Kufra District, Libya
Loading live weather...
Climate Analysis & Overview
Tazerbo, located in the heart of Libya, is experiencing a significant warming trend, with notable increases in both high and low temperatures over the past decade. The region's precipitation has become increasingly concentrated, suggesting more intense rainfall events. These changes align with broader regional climate goals aimed at understanding and mitigating climate impacts.
Desert Climate Dynamics
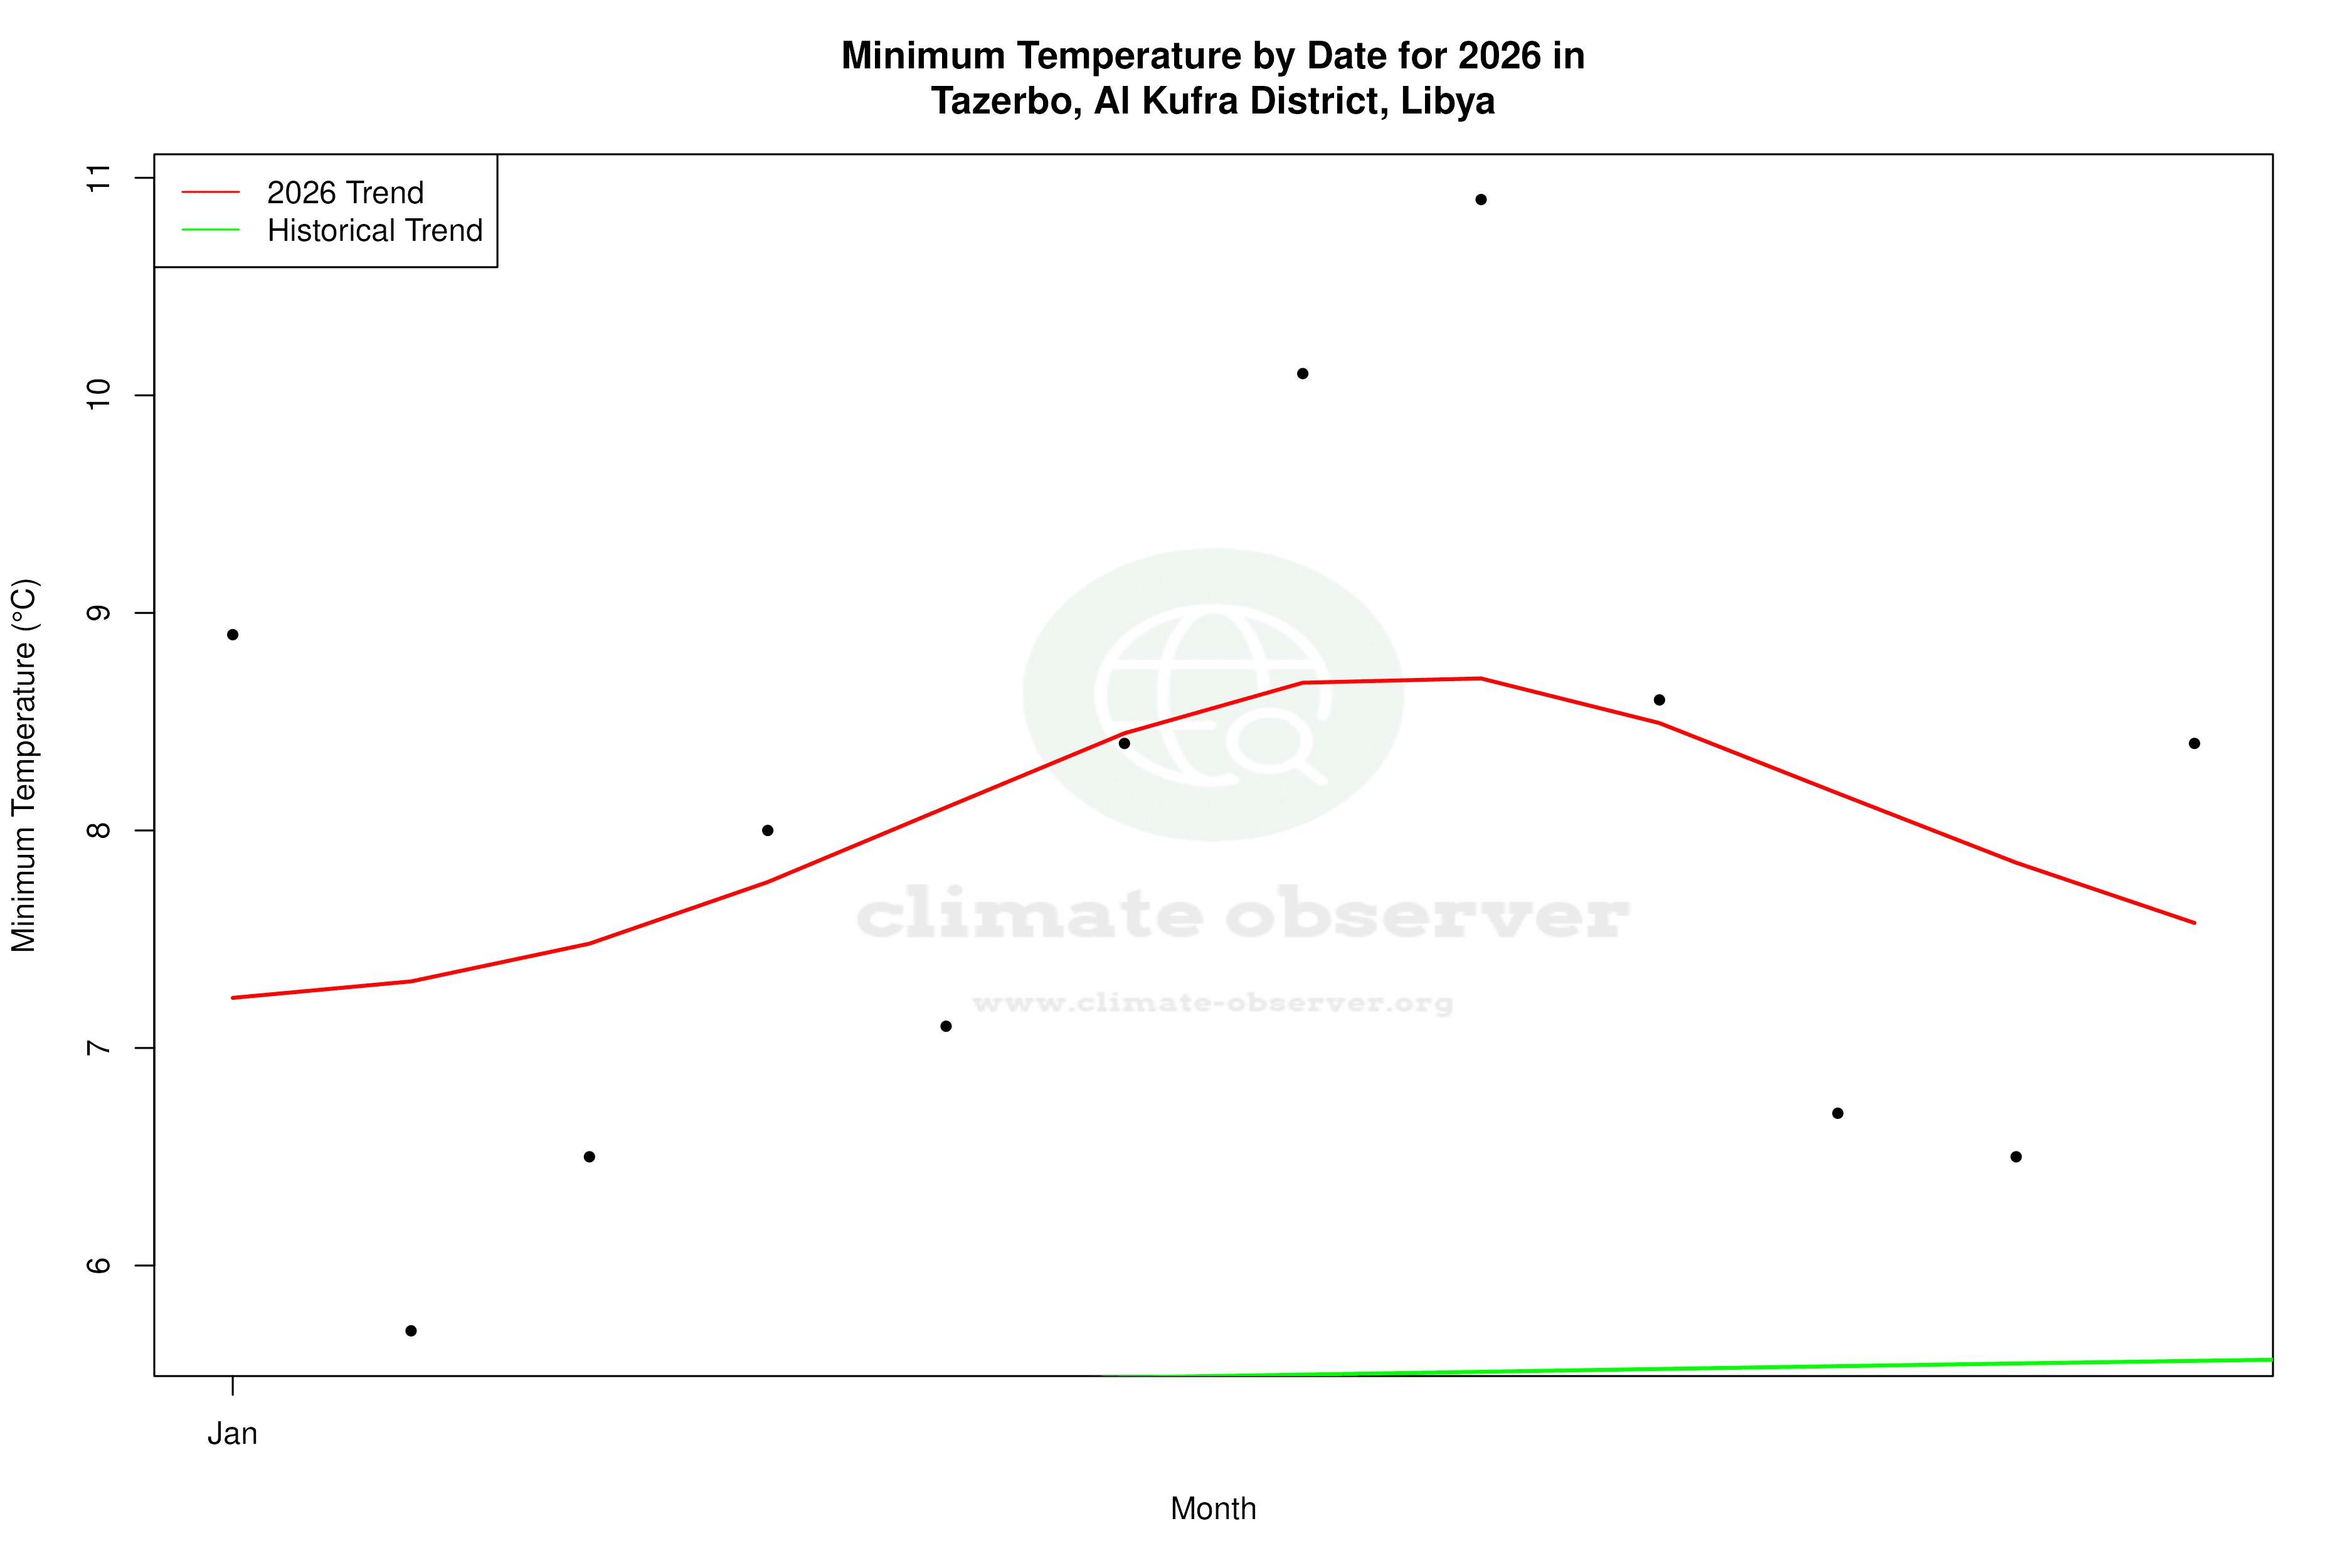
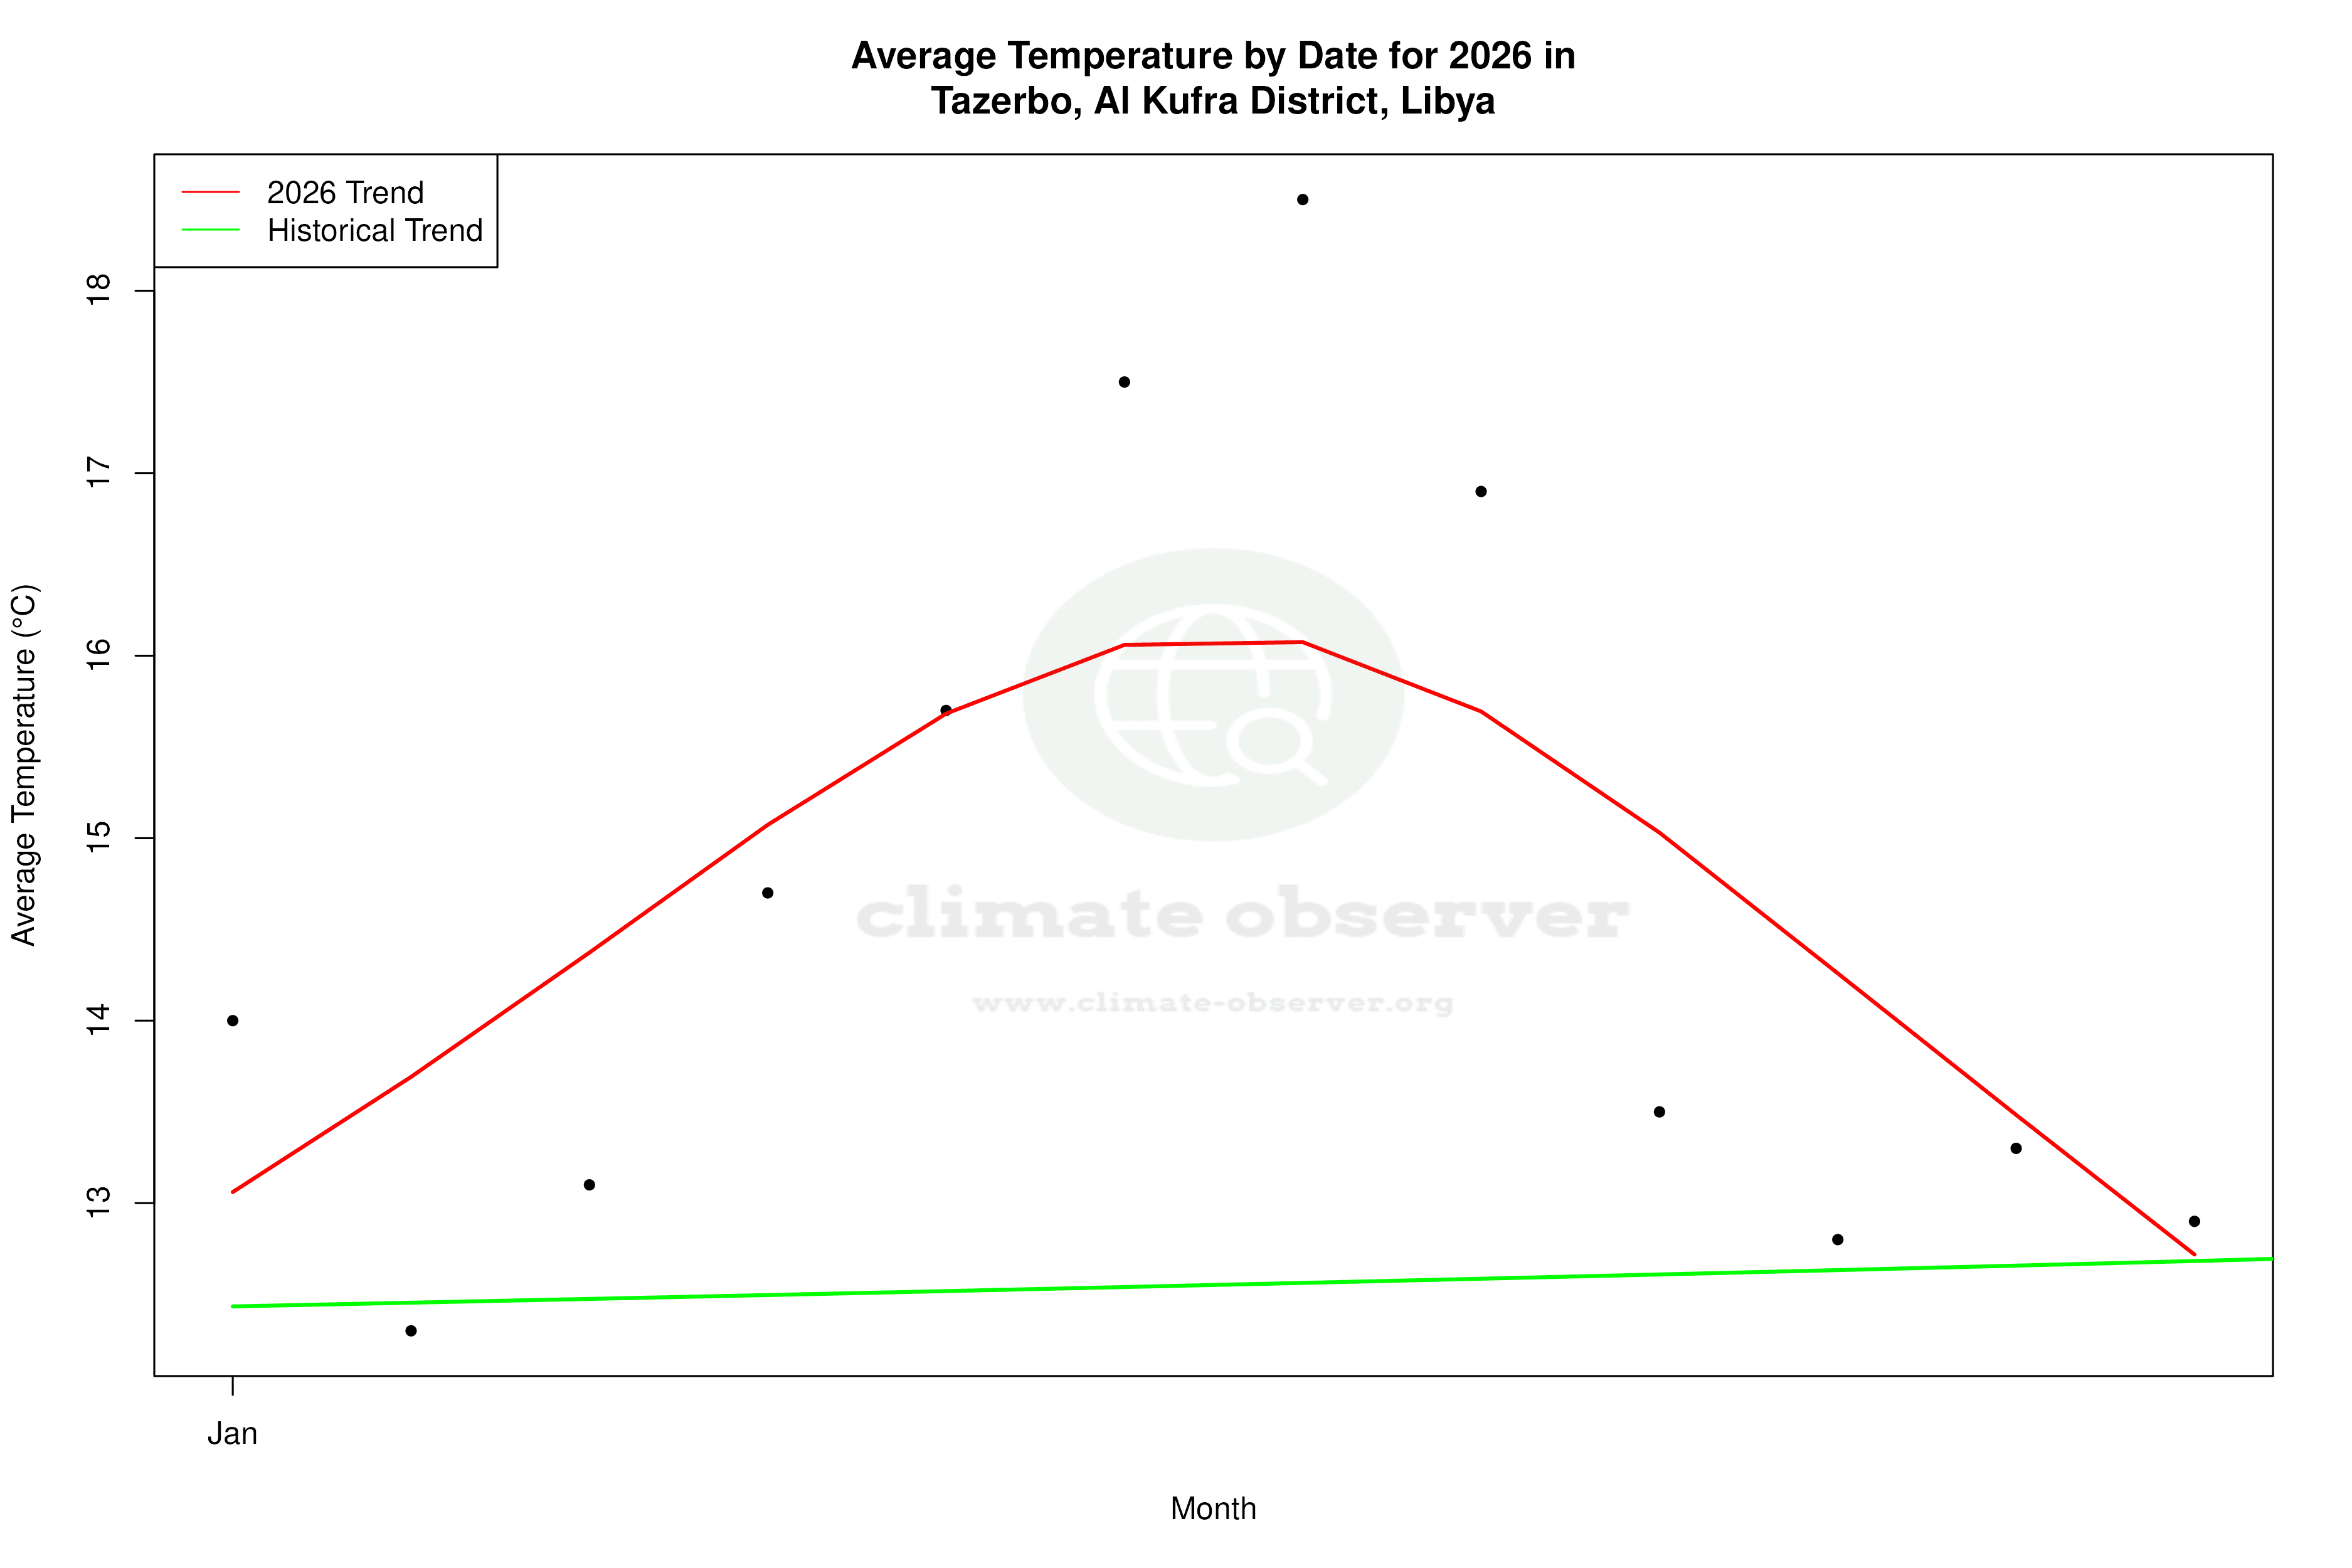
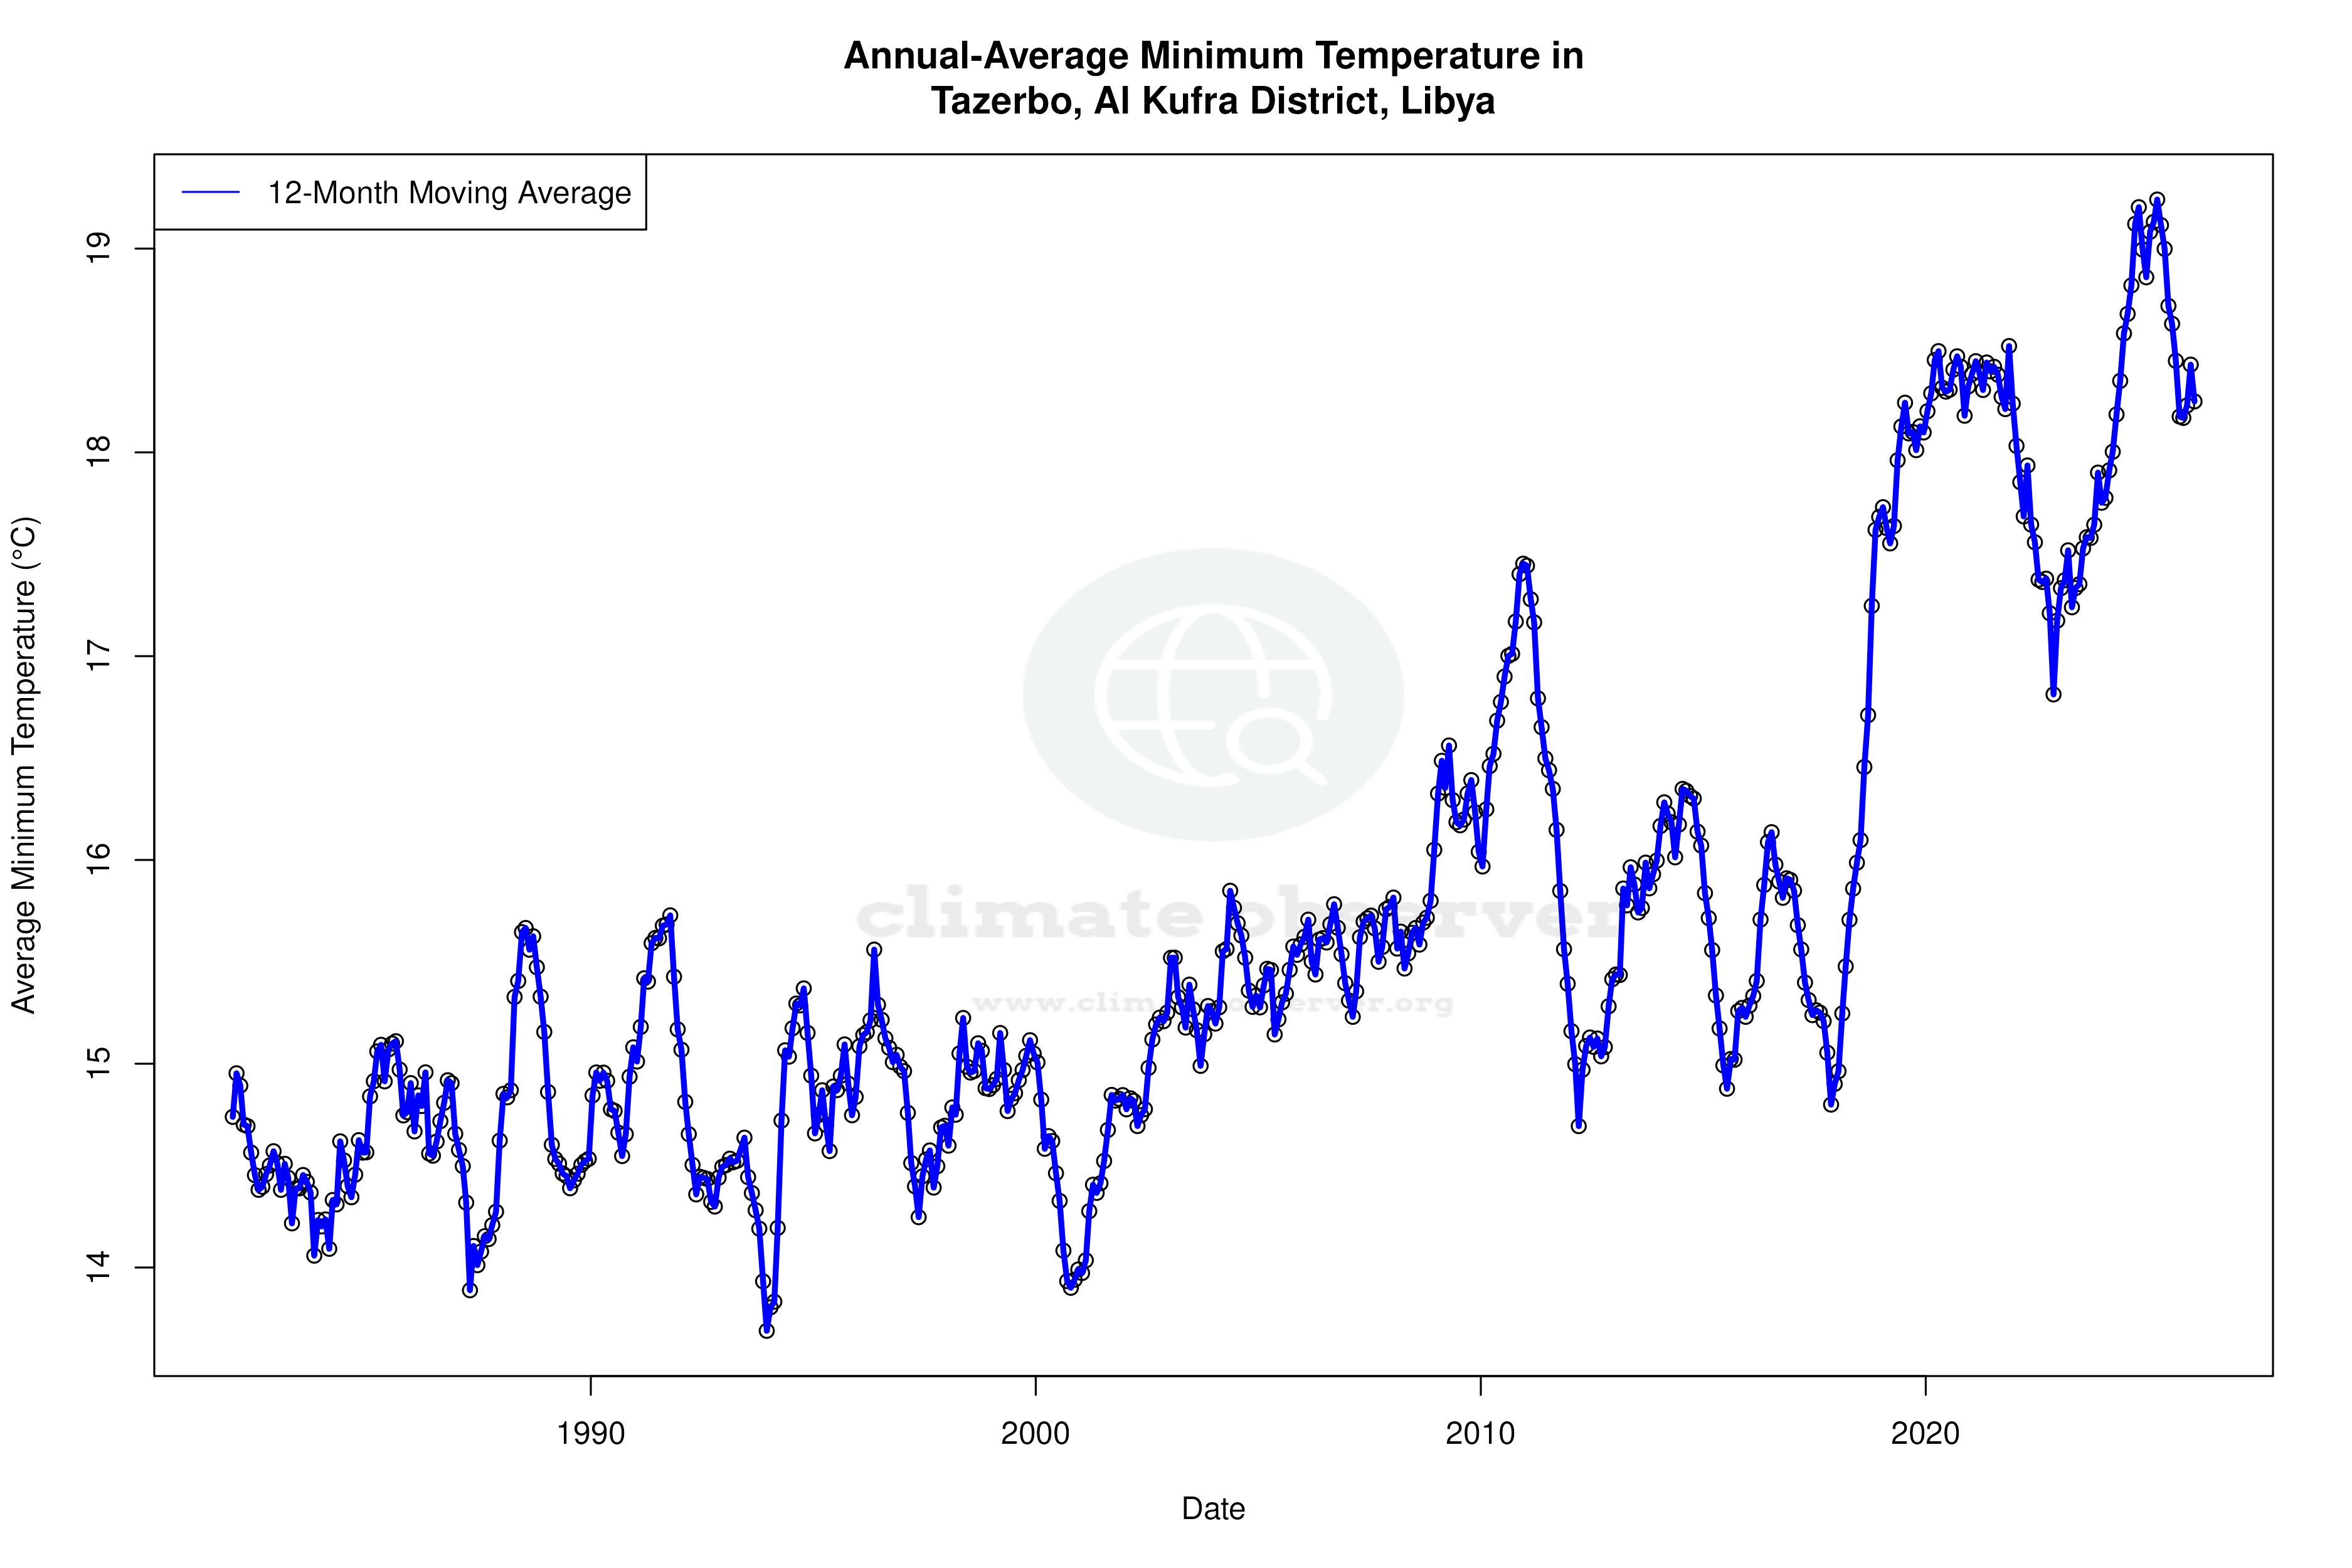
Tazerbo is situated within the Sahara Desert, characterised by its arid climate, classified as BWh under the Köppen climate classification. This region is marked by extreme temperature variations and minimal precipitation. The local geography, dominated by expansive desert plains, contributes to these conditions, with little to moderate influence from surrounding topographical features. Over the past decade, Tazerbo has witnessed a warming trend, with high temperatures rising by 1.72°C (3.10°F) and lows increasing by 3.16°C (5.69°F). This trend is more pronounced than the all-time warming of highs by 0.37°C (0.67°F) and lows by 0.80°C (1.44°F), indicating an acceleration in recent years.
Temperature Extremes and Records
The region's temperature records reflect its harsh climate, with a record high of 49.0°C (120.2°F) and a record low of -3.5°C (25.7°F). These extremes underscore the significant temperature variability typical of desert climates. The warming trends observed in Tazerbo are consistent with broader patterns of climate change affecting North Africa, where rising temperatures pose challenges to water resources and agriculture.
Precipitation Patterns and Concentration
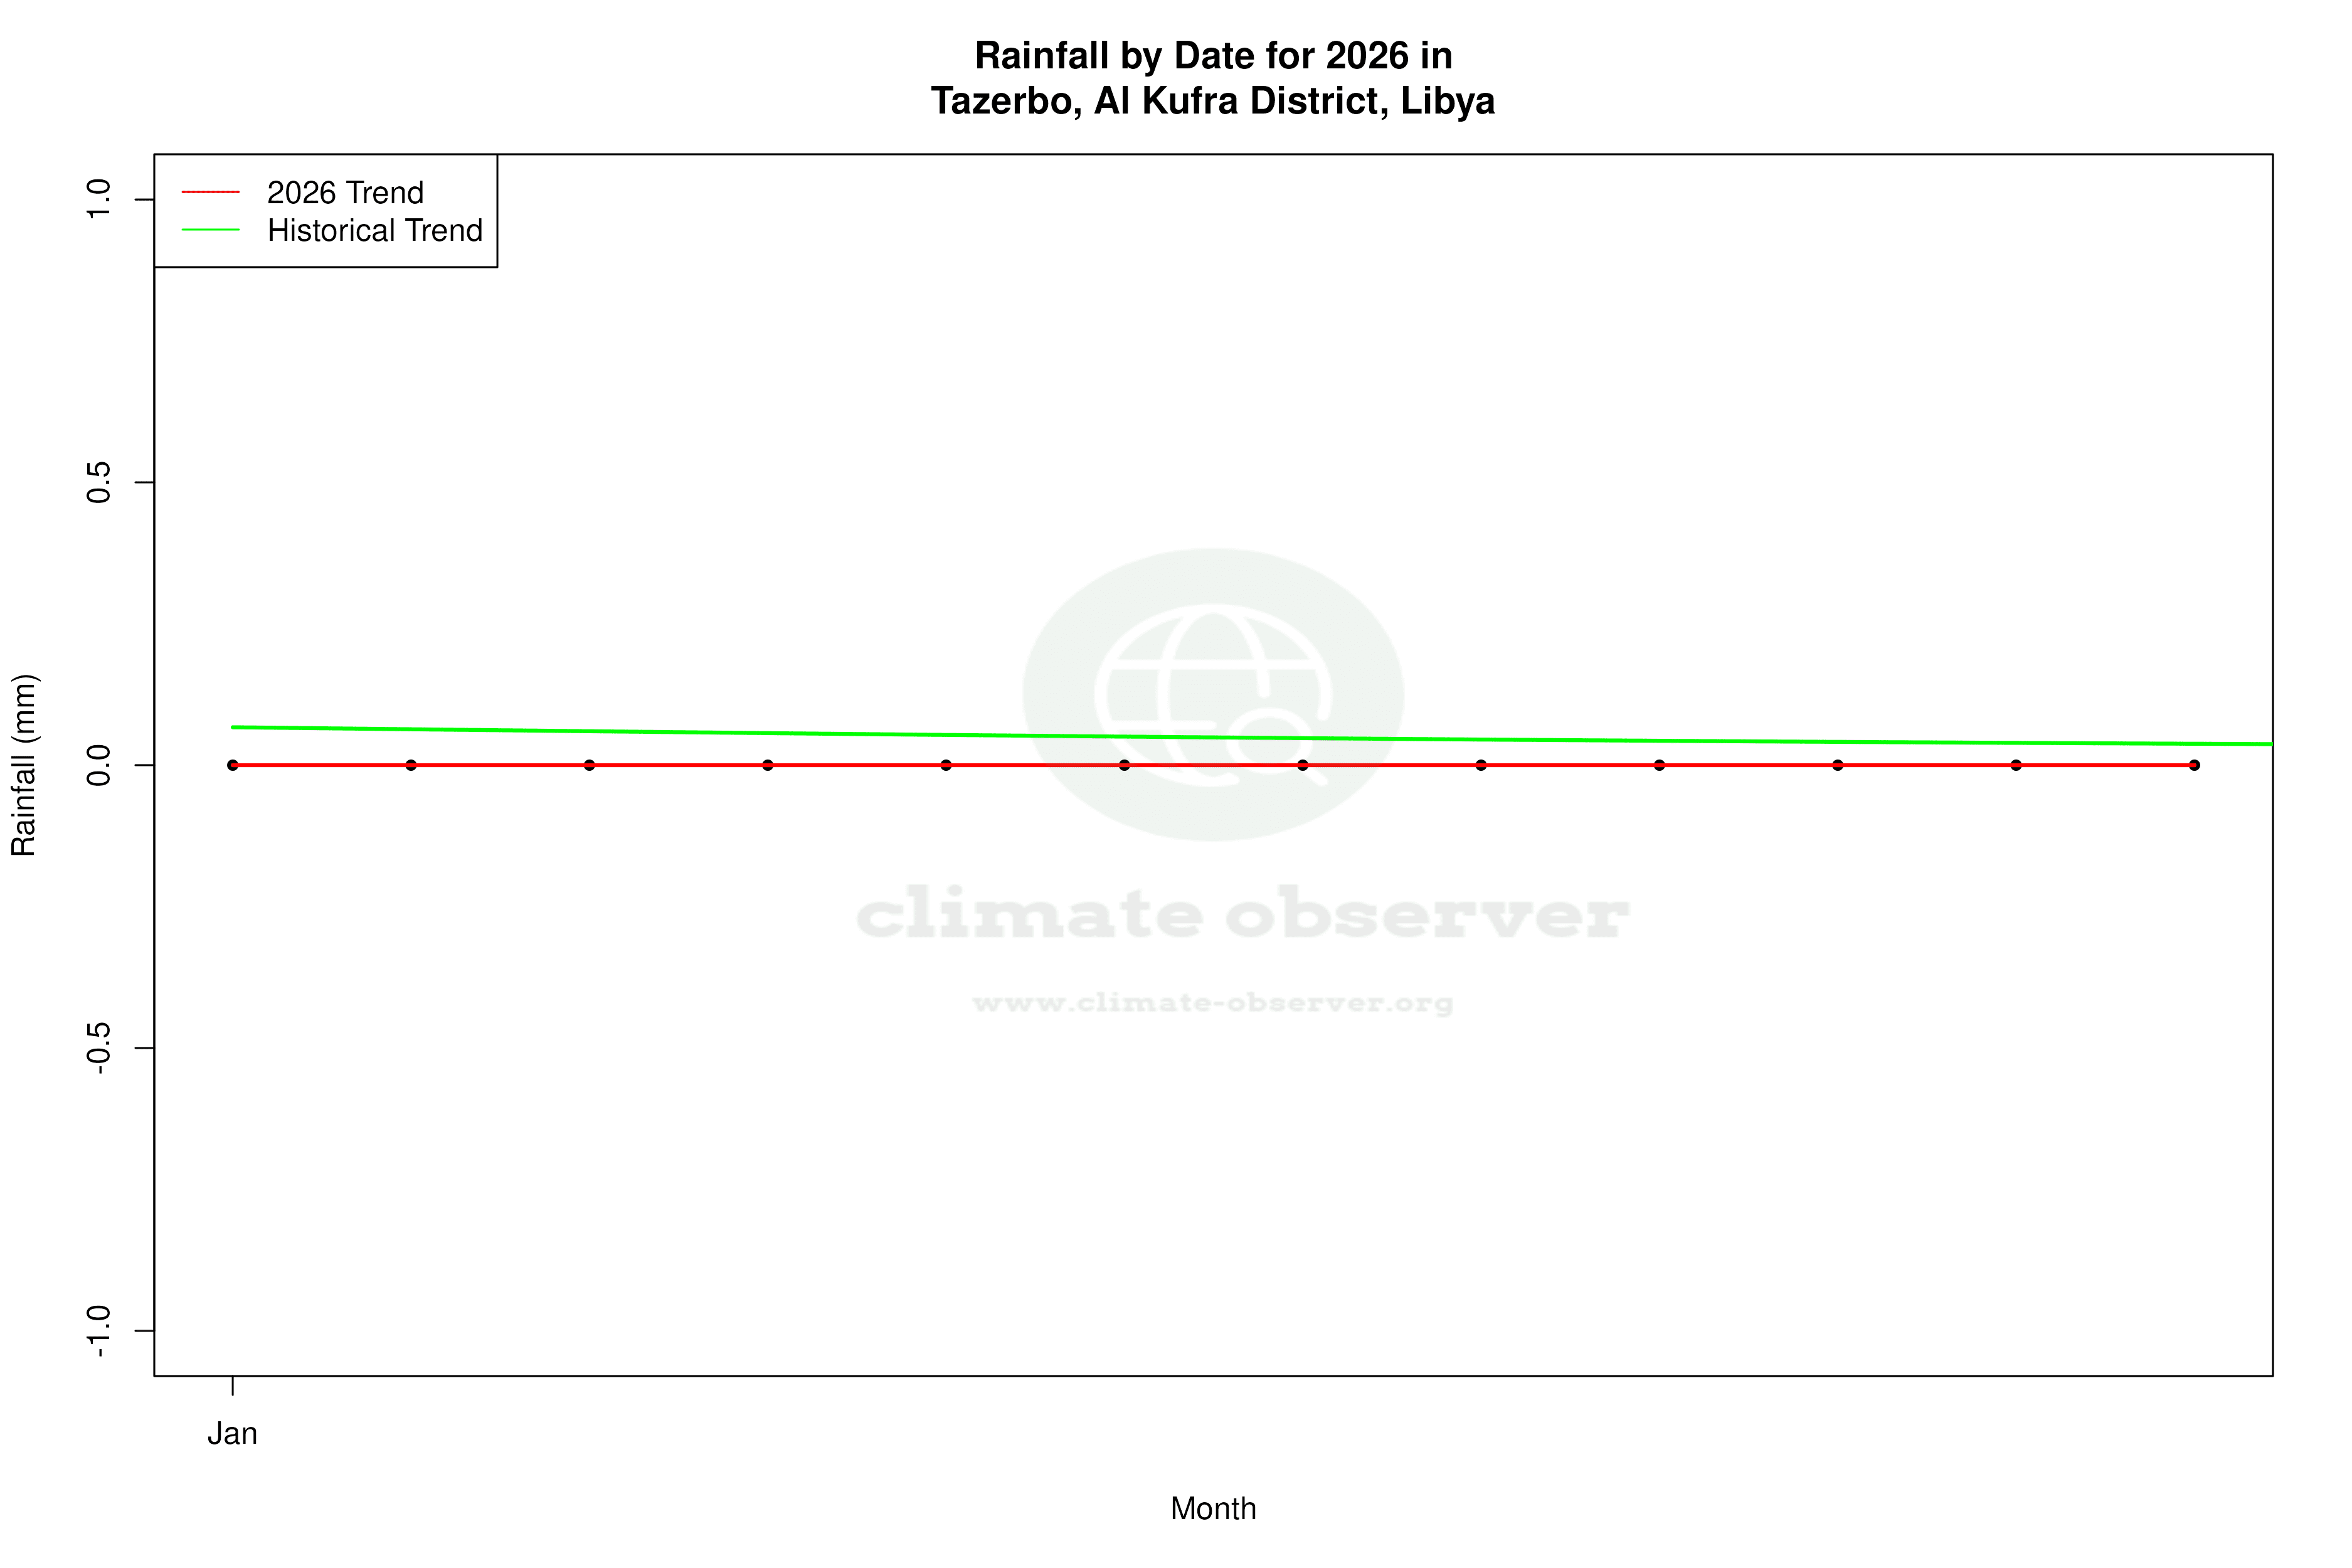
Tazerbo's precipitation patterns have shifted, as indicated by the Precipitation Concentration Index (PCI). The PCI has increased from a baseline of 66.5 to a current value of 83.4, suggesting a significant change. This rise in PCI indicates that precipitation is becoming more concentrated, with rainfall occurring in fewer, more intense events. Such changes can lead to challenges in water management and increased risk of flash flooding, particularly in desert regions where infrastructure is often limited.
Regional Climate Implications
These climatic shifts in Tazerbo are reflective of broader regional trends in Libya, where national climate goals focus on adaptation and resilience. The warming trends and increased precipitation concentration highlight the need for strategic planning in water resource management and agricultural practices. As Libya continues to navigate the impacts of climate change, understanding localised changes such as those in Tazerbo becomes crucial for effective policy-making and community preparedness.
Station Statistics
10-Year Trend
High: +1.71 °C/decade
Low: +3.15 °C/decade
Rain: +0.03 mm/decade
25-Year Trend
High: +0.34 °C/decade
Low: +1.40 °C/decade
Rain: +0.01 mm/decade
50-Year Trend
High: +0.37 °C/decade
Low: +0.80 °C/decade
Rain: +0.00 mm/decade
All-Time Trend
High: +0.37 °C/decade
Low: +0.80 °C/decade
Rain: +0.00 mm/decade
Percentage Above-Average Days
Last 12 Months: 54.2%
This Year: 90.0%
Precipitation Concentration Index (PCI) ℹ️
Last 12 Months: 99.6
Historical Average: 65.7
Percentile Rank of Last 12 Months ℹ️
High: 90th percentile
Low: 98th percentile
Rain: 90th percentile
Change in Variance ℹ️
High: -2.8%
Low: +15.1%
Intraday: -16.4%
Data Coverage
76.8%
First Year of Data
1962
Station Location
Historical Weather Records
| Max High | Avg High | Min High | Max Avg | Avg Avg | Min Avg | Max Low | Avg Low | Min Low | Max Precipitation | Avg Precipitation | Max Snow | Avg Snow | |
|---|---|---|---|---|---|---|---|---|---|---|---|---|---|
| Record | 49.0 °C | — | 8.2 °C | 42.9 °C | — | 5.0 °C | 33.0 °C | — | -3.5 °C | 11.4 mm | — | — | — |
| January | 34.5 °C | 19.4 °C | 8.2 °C | 26.7 °C | 12.9 °C | 5.0 °C | 18.5 °C | 5.6 °C | -3.5 °C | 9.4 mm | 0.0 mm | — | — |
| February | 37.0 °C | 21.7 °C | 11.9 °C | 28.1 °C | 15.1 °C | 7.1 °C | 19.0 °C | 7.0 °C | -1.0 °C | 6.3 mm | 0.0 mm | — | — |
| March | 41.4 °C | 26.4 °C | 14.0 °C | 33.6 °C | 19.5 °C | 9.2 °C | 24.6 °C | 10.8 °C | 0.0 °C | 11.4 mm | 0.0 mm | — | — |
| April | 45.0 °C | 32.0 °C | 18.5 °C | 35.0 °C | 25.0 °C | 13.5 °C | 29.5 °C | 16.1 °C | 6.5 °C | 1.8 mm | 0.0 mm | — | — |
| May | 48.8 °C | 35.7 °C | 23.0 °C | 42.0 °C | 29.2 °C | 17.4 °C | 33.0 °C | 20.4 °C | 7.8 °C | 9.8 mm | 0.0 mm | — | — |
| June | 47.6 °C | 38.2 °C | 28.3 °C | 42.9 °C | 31.9 °C | 22.9 °C | 32.0 °C | 22.9 °C | 13.0 °C | 0.0 mm | 0.0 mm | — | — |
| July | 46.5 °C | 37.9 °C | 31.0 °C | 39.8 °C | 31.8 °C | 22.7 °C | 31.3 °C | 23.4 °C | 13.2 °C | 0.0 mm | 0.0 mm | — | — |
| August | 47.1 °C | 37.8 °C | 32.0 °C | 40.9 °C | 31.7 °C | 23.2 °C | 31.7 °C | 23.6 °C | 15.0 °C | 9.0 mm | 0.0 mm | — | — |
| September | 49.0 °C | 36.1 °C | 28.3 °C | 39.3 °C | 29.8 °C | 21.8 °C | 29.9 °C | 21.7 °C | 11.0 °C | 2.9 mm | 0.0 mm | — | — |
| October | 41.9 °C | 31.3 °C | 21.6 °C | 34.7 °C | 25.1 °C | 15.3 °C | 28.7 °C | 17.3 °C | 6.5 °C | 1.2 mm | 0.0 mm | — | — |
| November | 38.5 °C | 25.5 °C | 15.6 °C | 29.6 °C | 18.9 °C | 9.3 °C | 21.0 °C | 11.3 °C | 2.0 °C | 4.1 mm | 0.0 mm | — | — |
| December | 33.9 °C | 20.5 °C | 12.7 °C | 28.2 °C | 14.0 °C | 6.6 °C | 16.6 °C | 6.8 °C | -1.5 °C | 7.7 mm | 0.0 mm | — | — |
Data Visualisations
Remove WatermarksCurrent Year Climate Trends vs Historical


Max Temperature this Year | 1 of 6
Climate 12-Month Moving Averages
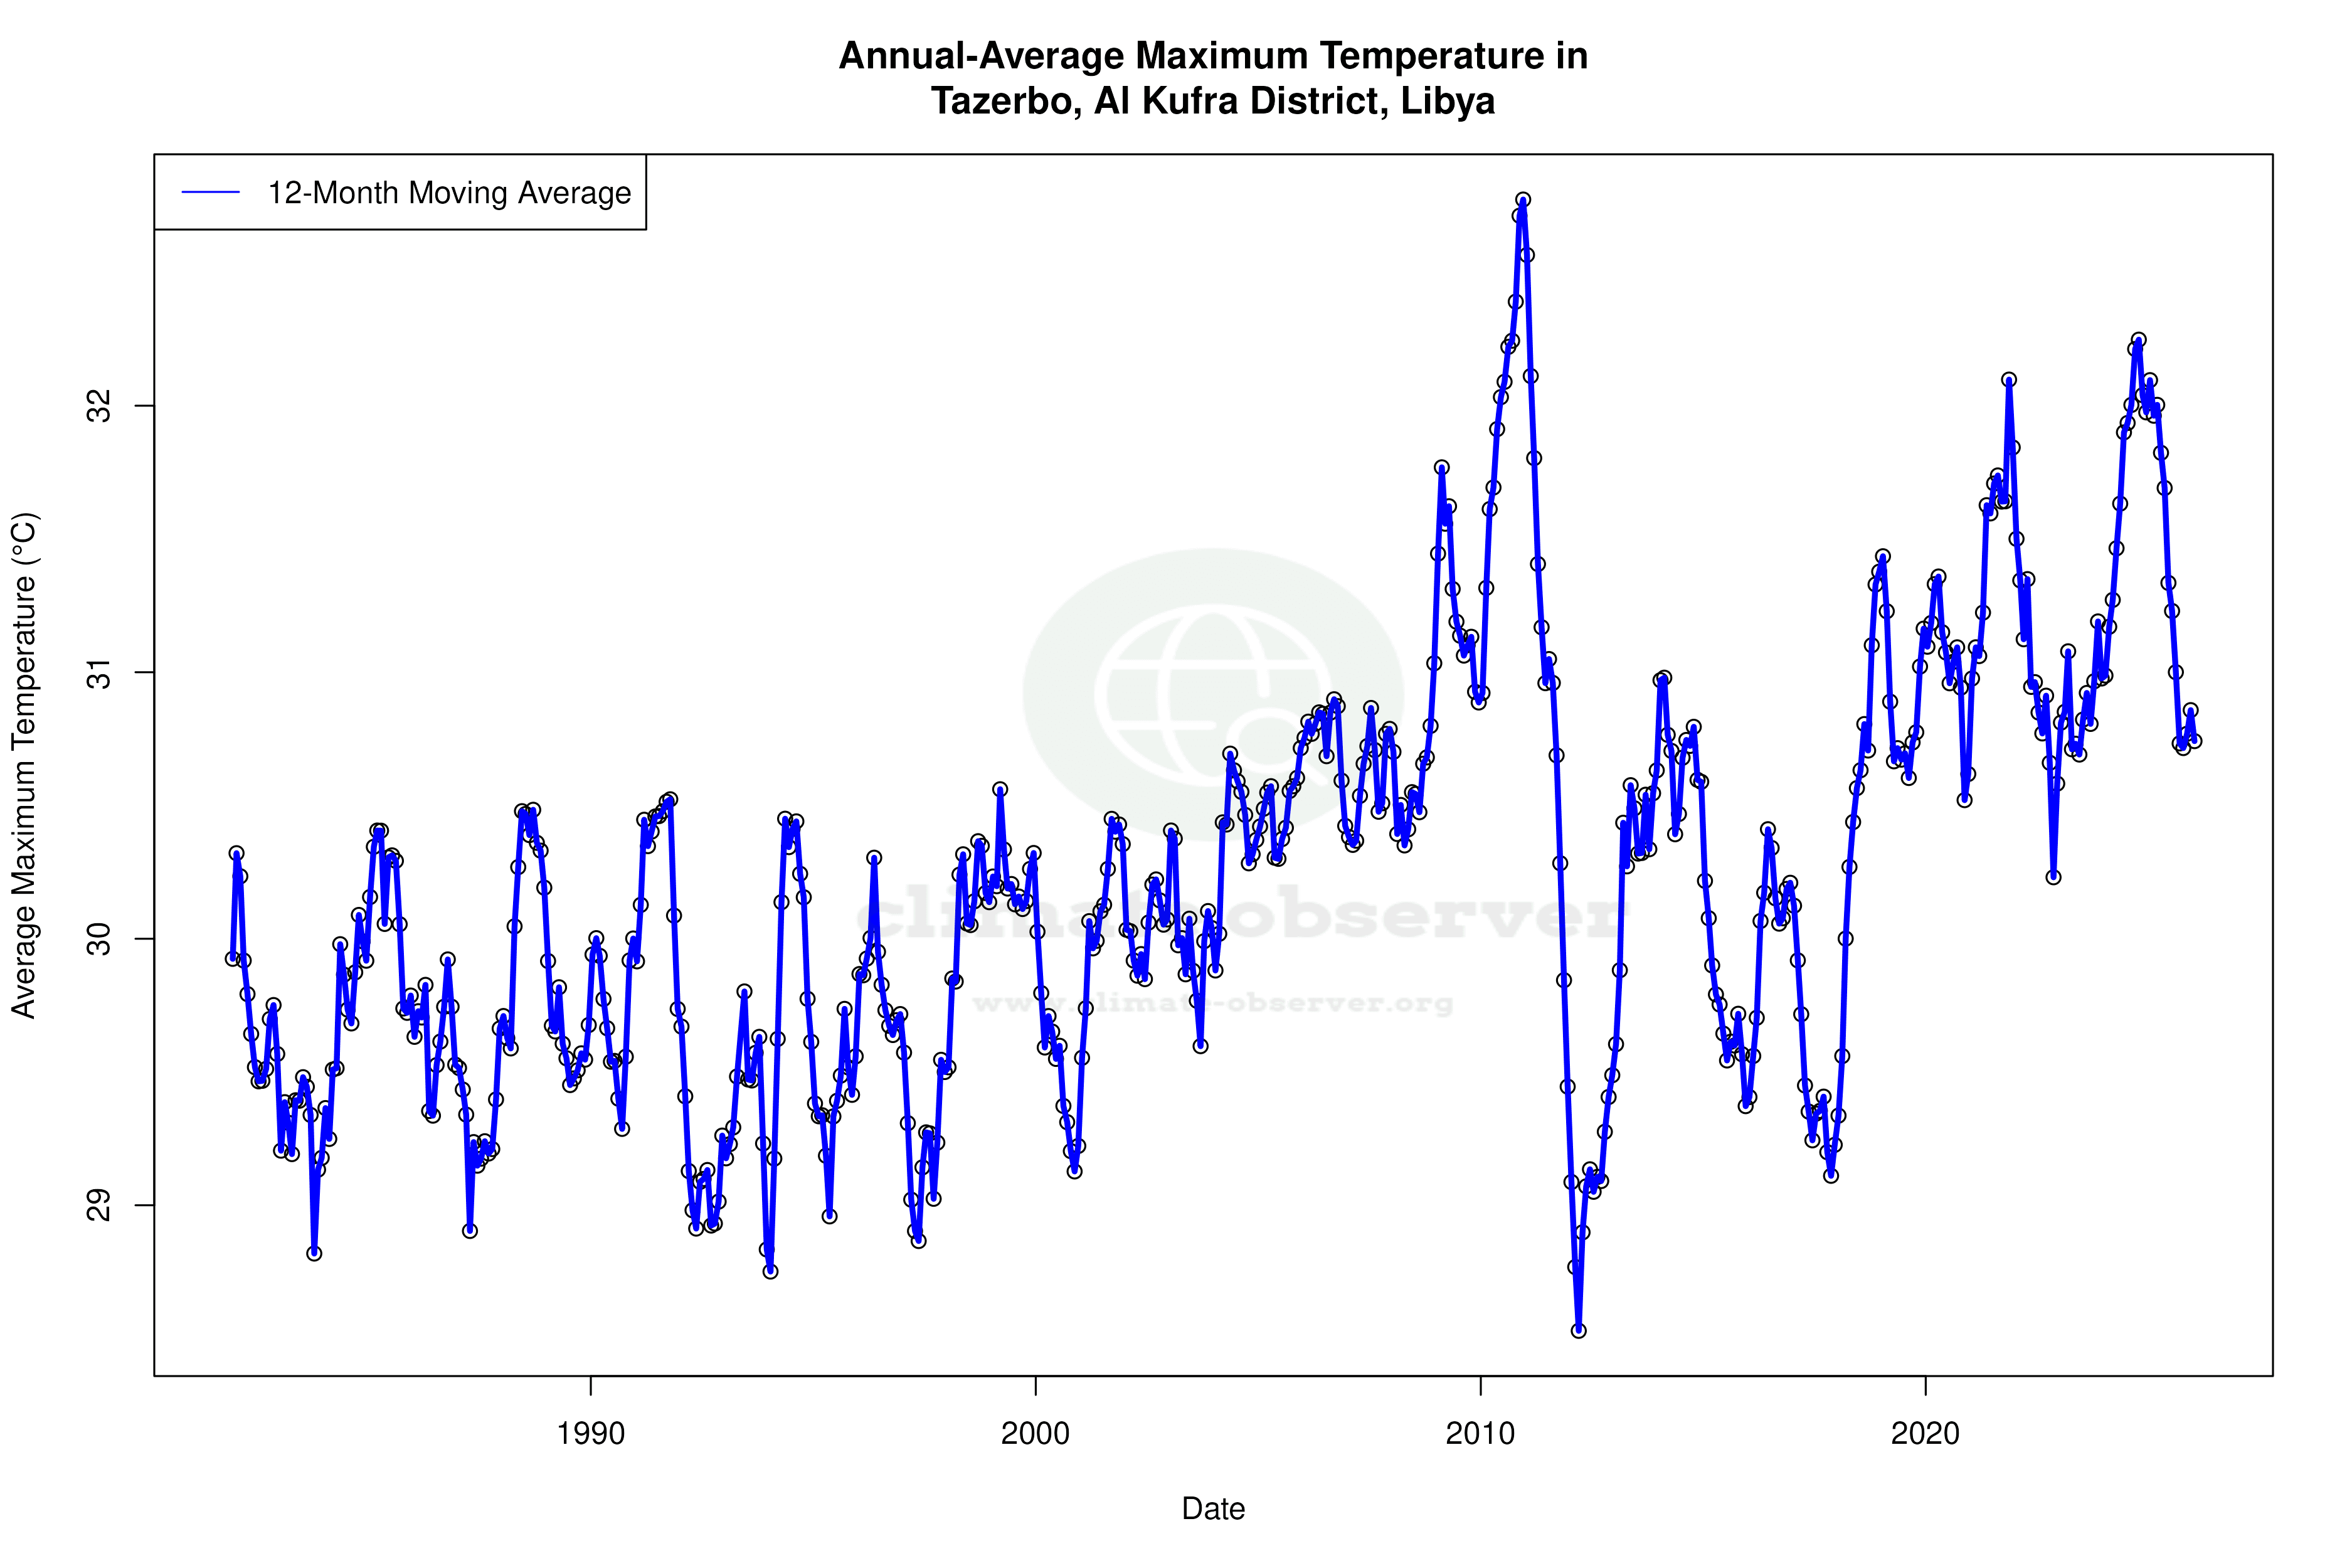


Max Temperature 12-Month MA | 1 of 6
Daily Data Points and Averages Throughout the Year
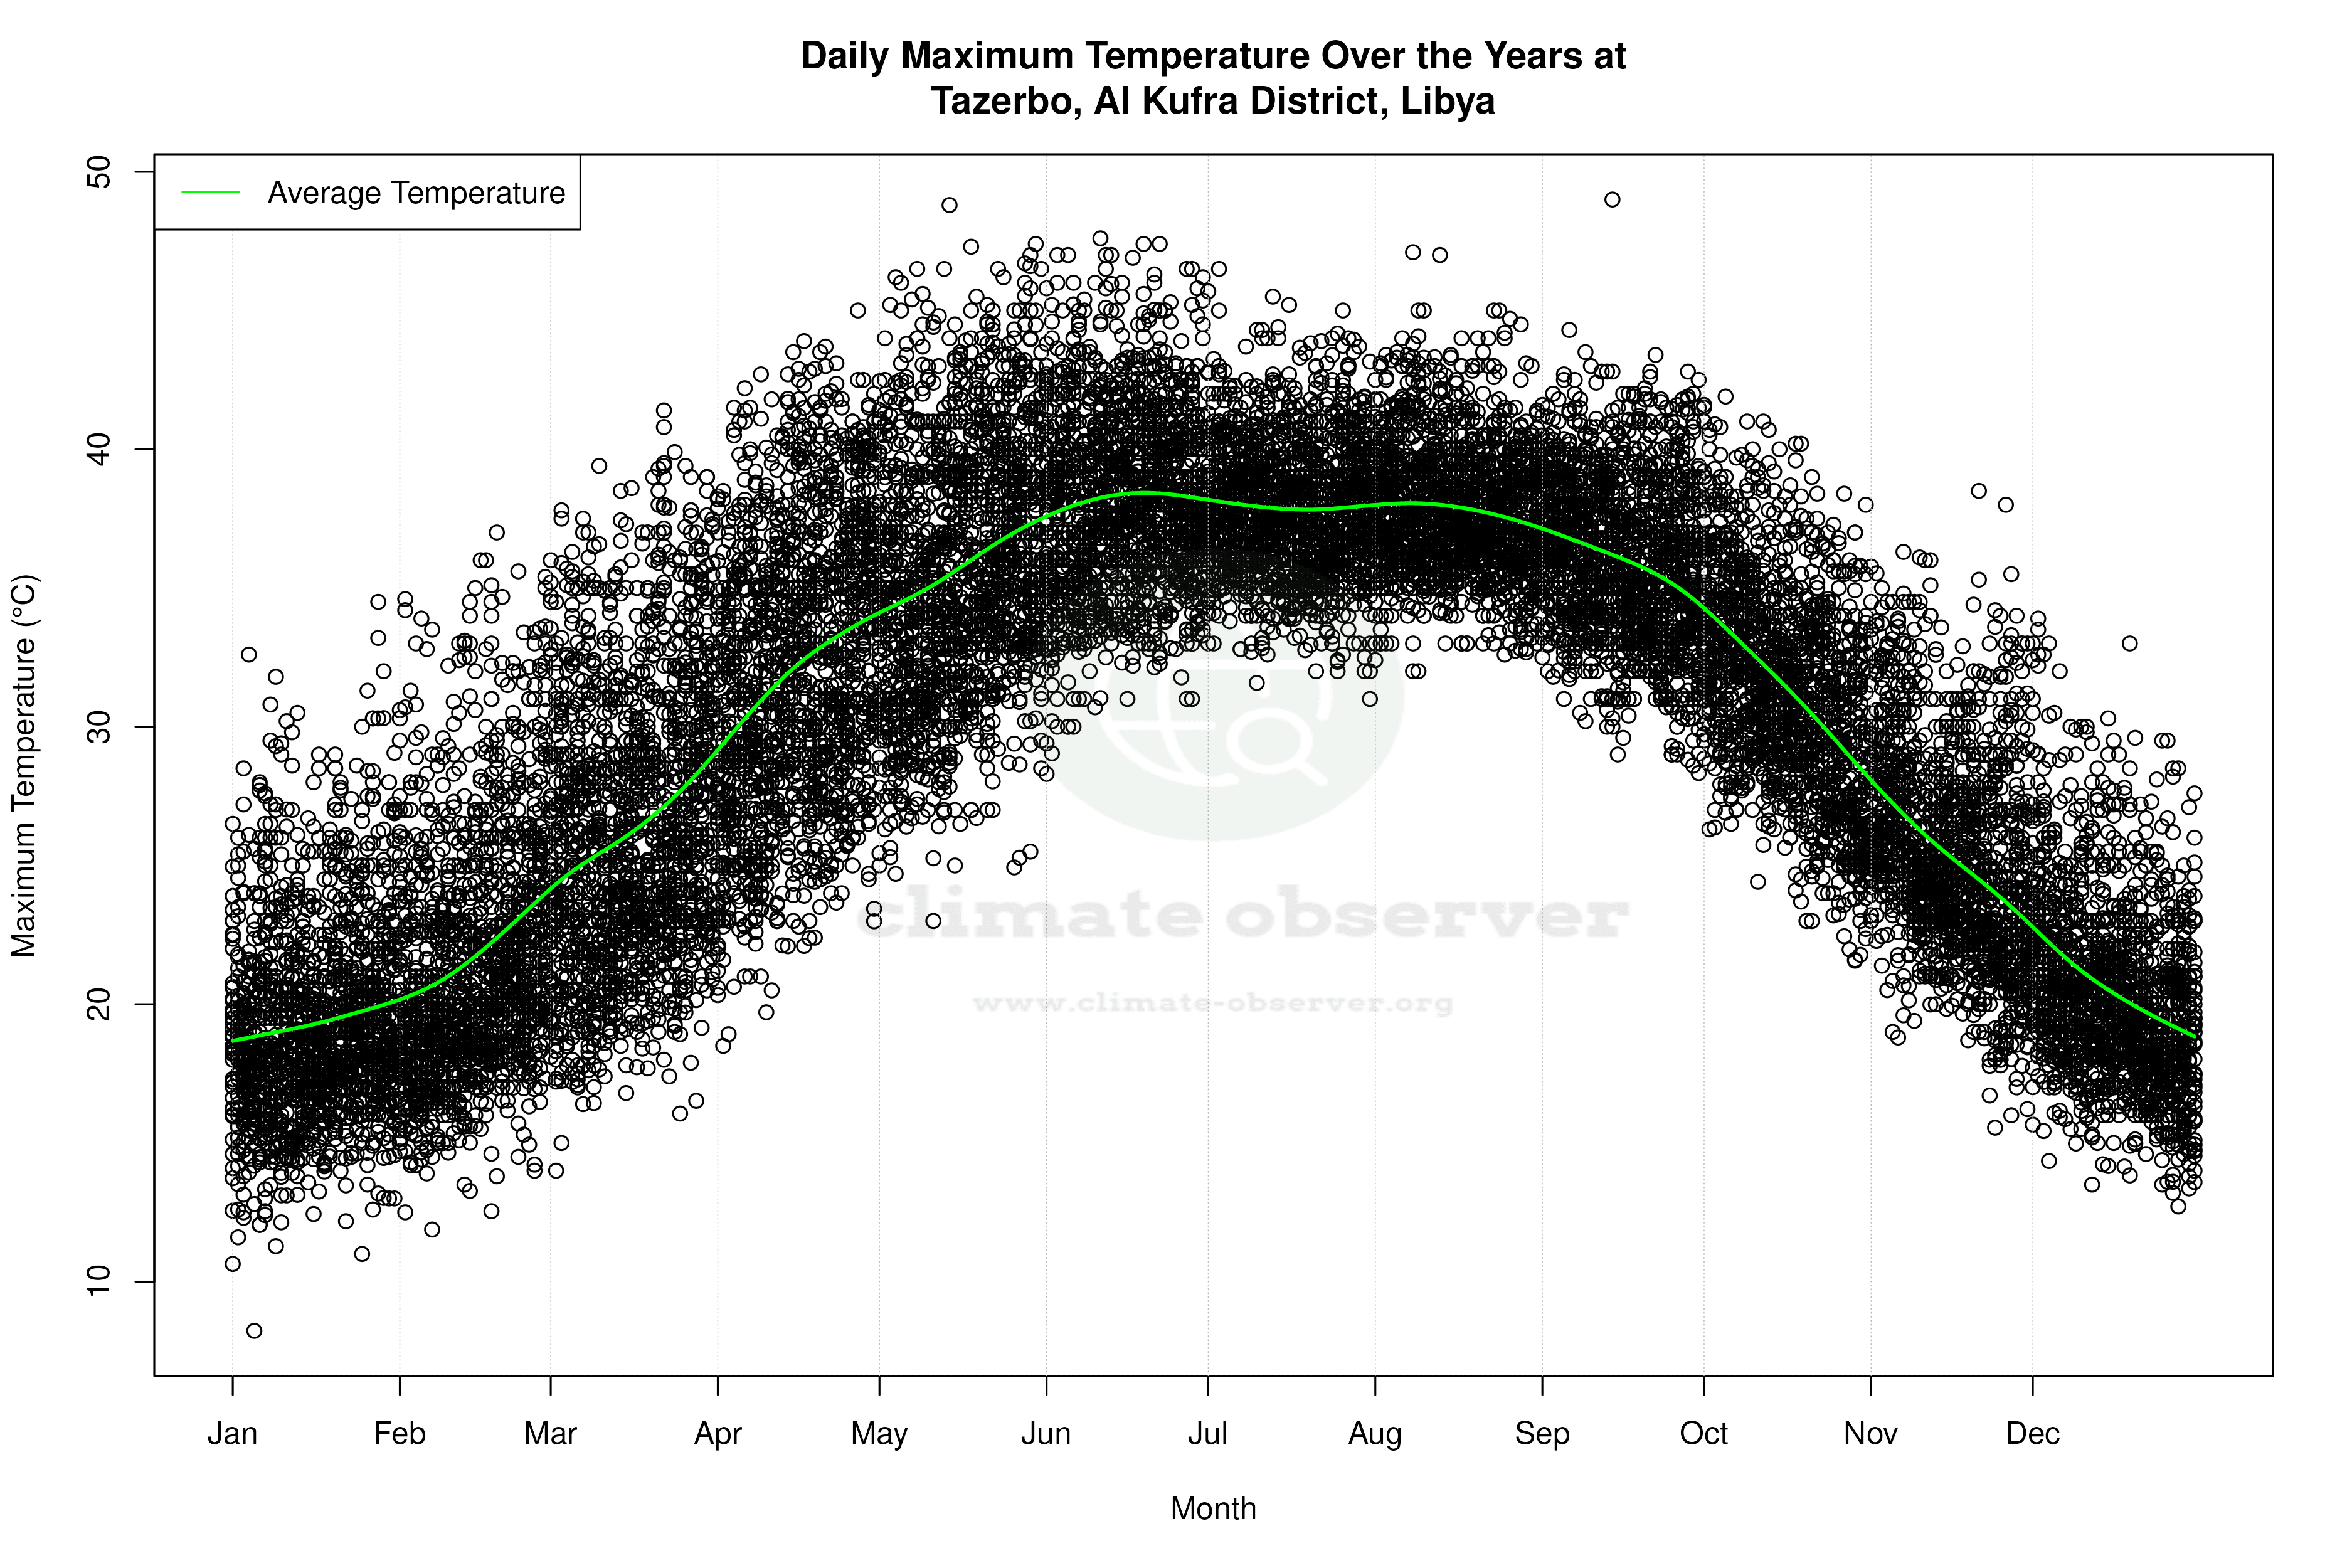


Average Max Temperature Throughout Year | 1 of 5