Climate for Station: Antsiranana, Diana, Madagascar
Loading live weather...
Climate Analysis & Overview
Antsiranana, situated in northern Madagascar, is experiencing a warming trend, with temperatures rising more significantly in recent years. The precipitation pattern is slightly more concentrated, impacting the local ecosystem and potentially influencing Madagascar's regional climate goals.
Geographical and Climatic Context
Antsiranana, located at -12.35, 49.3, falls under the Köppen climate classification of tropical savanna climate (Aw). This region is characterised by a distinct wet and dry season, influenced by its coastal proximity to the Indian Ocean. The surrounding geography, including the nearby Tsaratanana Massif, plays a crucial role in shaping local weather patterns, often moderating temperatures and influencing rainfall distribution.
Temperature Trends Over Time
The all-time temperature trends for Antsiranana indicate a warming pattern. Highs have increased by 0.44°C (0.79°F), while lows have risen by 0.06°C (0.11°F). This gradual rise in temperatures reflects broader global warming trends. However, the past decade has seen a more pronounced warming, with highs increasing by 0.73°C (1.32°F) and lows by 0.18°C (0.32°F). This suggests an acceleration in temperature rise, possibly linked to regional climate changes and global phenomena such as El Niño.
Record Temperatures and Extremes
The station has recorded an absolute maximum temperature of 39.0°C (102.2°F) and a minimum of 13.5°C (56.3°F). These extremes highlight the variability within the tropical savanna climate, where temperatures can fluctuate significantly between day and night, as well as between seasons. Such variability is crucial for the local biodiversity, which has adapted to these conditions over time.
Precipitation Patterns and Concentration
The Precipitation Concentration Index (PCI) for Antsiranana has shown a slight increase from a baseline of 18.34 to a current value of 18.46. PCI measures how rainfall is distributed over time, with higher values indicating more concentrated precipitation events. This marginal increase suggests that rainfall is becoming slightly more concentrated, potentially leading to more intense, but less frequent, rain events. Such changes can affect water availability and agriculture, critical components of Madagascar's regional climate goals.
Implications for Regional Climate Goals
Madagascar has been actively working towards sustainable climate practices, focusing on reducing vulnerability to climate change impacts. The warming trends and shifting precipitation patterns in Antsiranana provide valuable insights for policymakers and researchers. Understanding these localised changes is essential for developing strategies that align with national climate objectives, ensuring resilience and adaptability in the face of evolving climatic conditions.
Station Statistics
10-Year Trend
High: +0.50 °C/decade
Low: +0.08 °C/decade
Rain: -0.03 mm/decade
25-Year Trend
High: +0.28 °C/decade
Low: +0.29 °C/decade
Rain: +0.18 mm/decade
50-Year Trend
High: +0.42 °C/decade
Low: +0.07 °C/decade
Rain: -0.04 mm/decade
All-Time Trend
High: +0.42 °C/decade
Low: +0.07 °C/decade
Rain: -0.04 mm/decade
Percentage Above-Average Days
Last 12 Months: 39.5%
This Year: 12.3%
Precipitation Concentration Index (PCI) ℹ️
Last 12 Months: 15.7
Historical Average: 19.4
Percentile Rank of Last 12 Months ℹ️
High: 75th percentile
Low: 89th percentile
Rain: 47th percentile
Change in Variance ℹ️
High: -28.3%
Low: -13.7%
Intraday: -31.2%
Data Coverage
91.1%
First Year of Data
1973
Station Location
Historical Weather Records
| Max High | Avg High | Min High | Max Avg | Avg Avg | Min Avg | Max Low | Avg Low | Min Low | Max Precipitation | Avg Precipitation | Max Snow | Avg Snow | |
|---|---|---|---|---|---|---|---|---|---|---|---|---|---|
| Record | 39.0 °C | — | 23.9 °C | 32.8 °C | — | 20.5 °C | 26.8 °C | — | 13.5 °C | 300.0 mm | — | — | — |
| January | 36.3 °C | 31.0 °C | 25.6 °C | 32.8 °C | 27.0 °C | 23.0 °C | 26.2 °C | 23.3 °C | 17.0 °C | 192.0 mm | 9.2 mm | — | — |
| February | 34.6 °C | 30.7 °C | 25.0 °C | 31.0 °C | 26.9 °C | 23.1 °C | 26.7 °C | 23.2 °C | 16.6 °C | 194.1 mm | 9.1 mm | — | — |
| March | 34.8 °C | 31.0 °C | 26.0 °C | 30.8 °C | 27.1 °C | 21.8 °C | 26.2 °C | 23.2 °C | 18.0 °C | 173.0 mm | 6.5 mm | — | — |
| April | 37.0 °C | 31.3 °C | 25.1 °C | 31.0 °C | 27.3 °C | 23.4 °C | 25.7 °C | 22.9 °C | 17.8 °C | 71.1 mm | 2.9 mm | — | — |
| May | 34.2 °C | 30.8 °C | 25.0 °C | 31.6 °C | 26.6 °C | 22.0 °C | 25.0 °C | 21.9 °C | 16.2 °C | 21.1 mm | 0.9 mm | — | — |
| June | 33.2 °C | 29.6 °C | 24.1 °C | 28.9 °C | 25.2 °C | 21.2 °C | 24.0 °C | 20.4 °C | 13.5 °C | 22.1 mm | 0.7 mm | — | — |
| July | 32.2 °C | 29.1 °C | 23.9 °C | 28.1 °C | 24.6 °C | 20.7 °C | 23.2 °C | 19.6 °C | 13.8 °C | 16.0 mm | 0.7 mm | — | — |
| August | 33.0 °C | 29.3 °C | 24.5 °C | 28.0 °C | 24.7 °C | 20.5 °C | 23.2 °C | 19.7 °C | 14.5 °C | 20.1 mm | 0.6 mm | — | — |
| September | 33.5 °C | 30.1 °C | 25.2 °C | 28.9 °C | 25.4 °C | 21.3 °C | 24.0 °C | 20.3 °C | 14.7 °C | 50.0 mm | 0.5 mm | — | — |
| October | 35.2 °C | 31.1 °C | 26.1 °C | 30.3 °C | 26.4 °C | 22.4 °C | 24.6 °C | 21.4 °C | 16.3 °C | 300.0 mm | 0.9 mm | — | — |
| November | 36.1 °C | 32.0 °C | 25.3 °C | 32.1 °C | 27.4 °C | 22.6 °C | 25.6 °C | 22.6 °C | 18.2 °C | 240.0 mm | 1.5 mm | — | — |
| December | 39.0 °C | 32.2 °C | 25.2 °C | 32.2 °C | 27.7 °C | 22.1 °C | 26.8 °C | 23.3 °C | 18.7 °C | 132.1 mm | 4.9 mm | — | — |
Data Visualisations
Remove WatermarksCurrent Year Climate Trends vs Historical
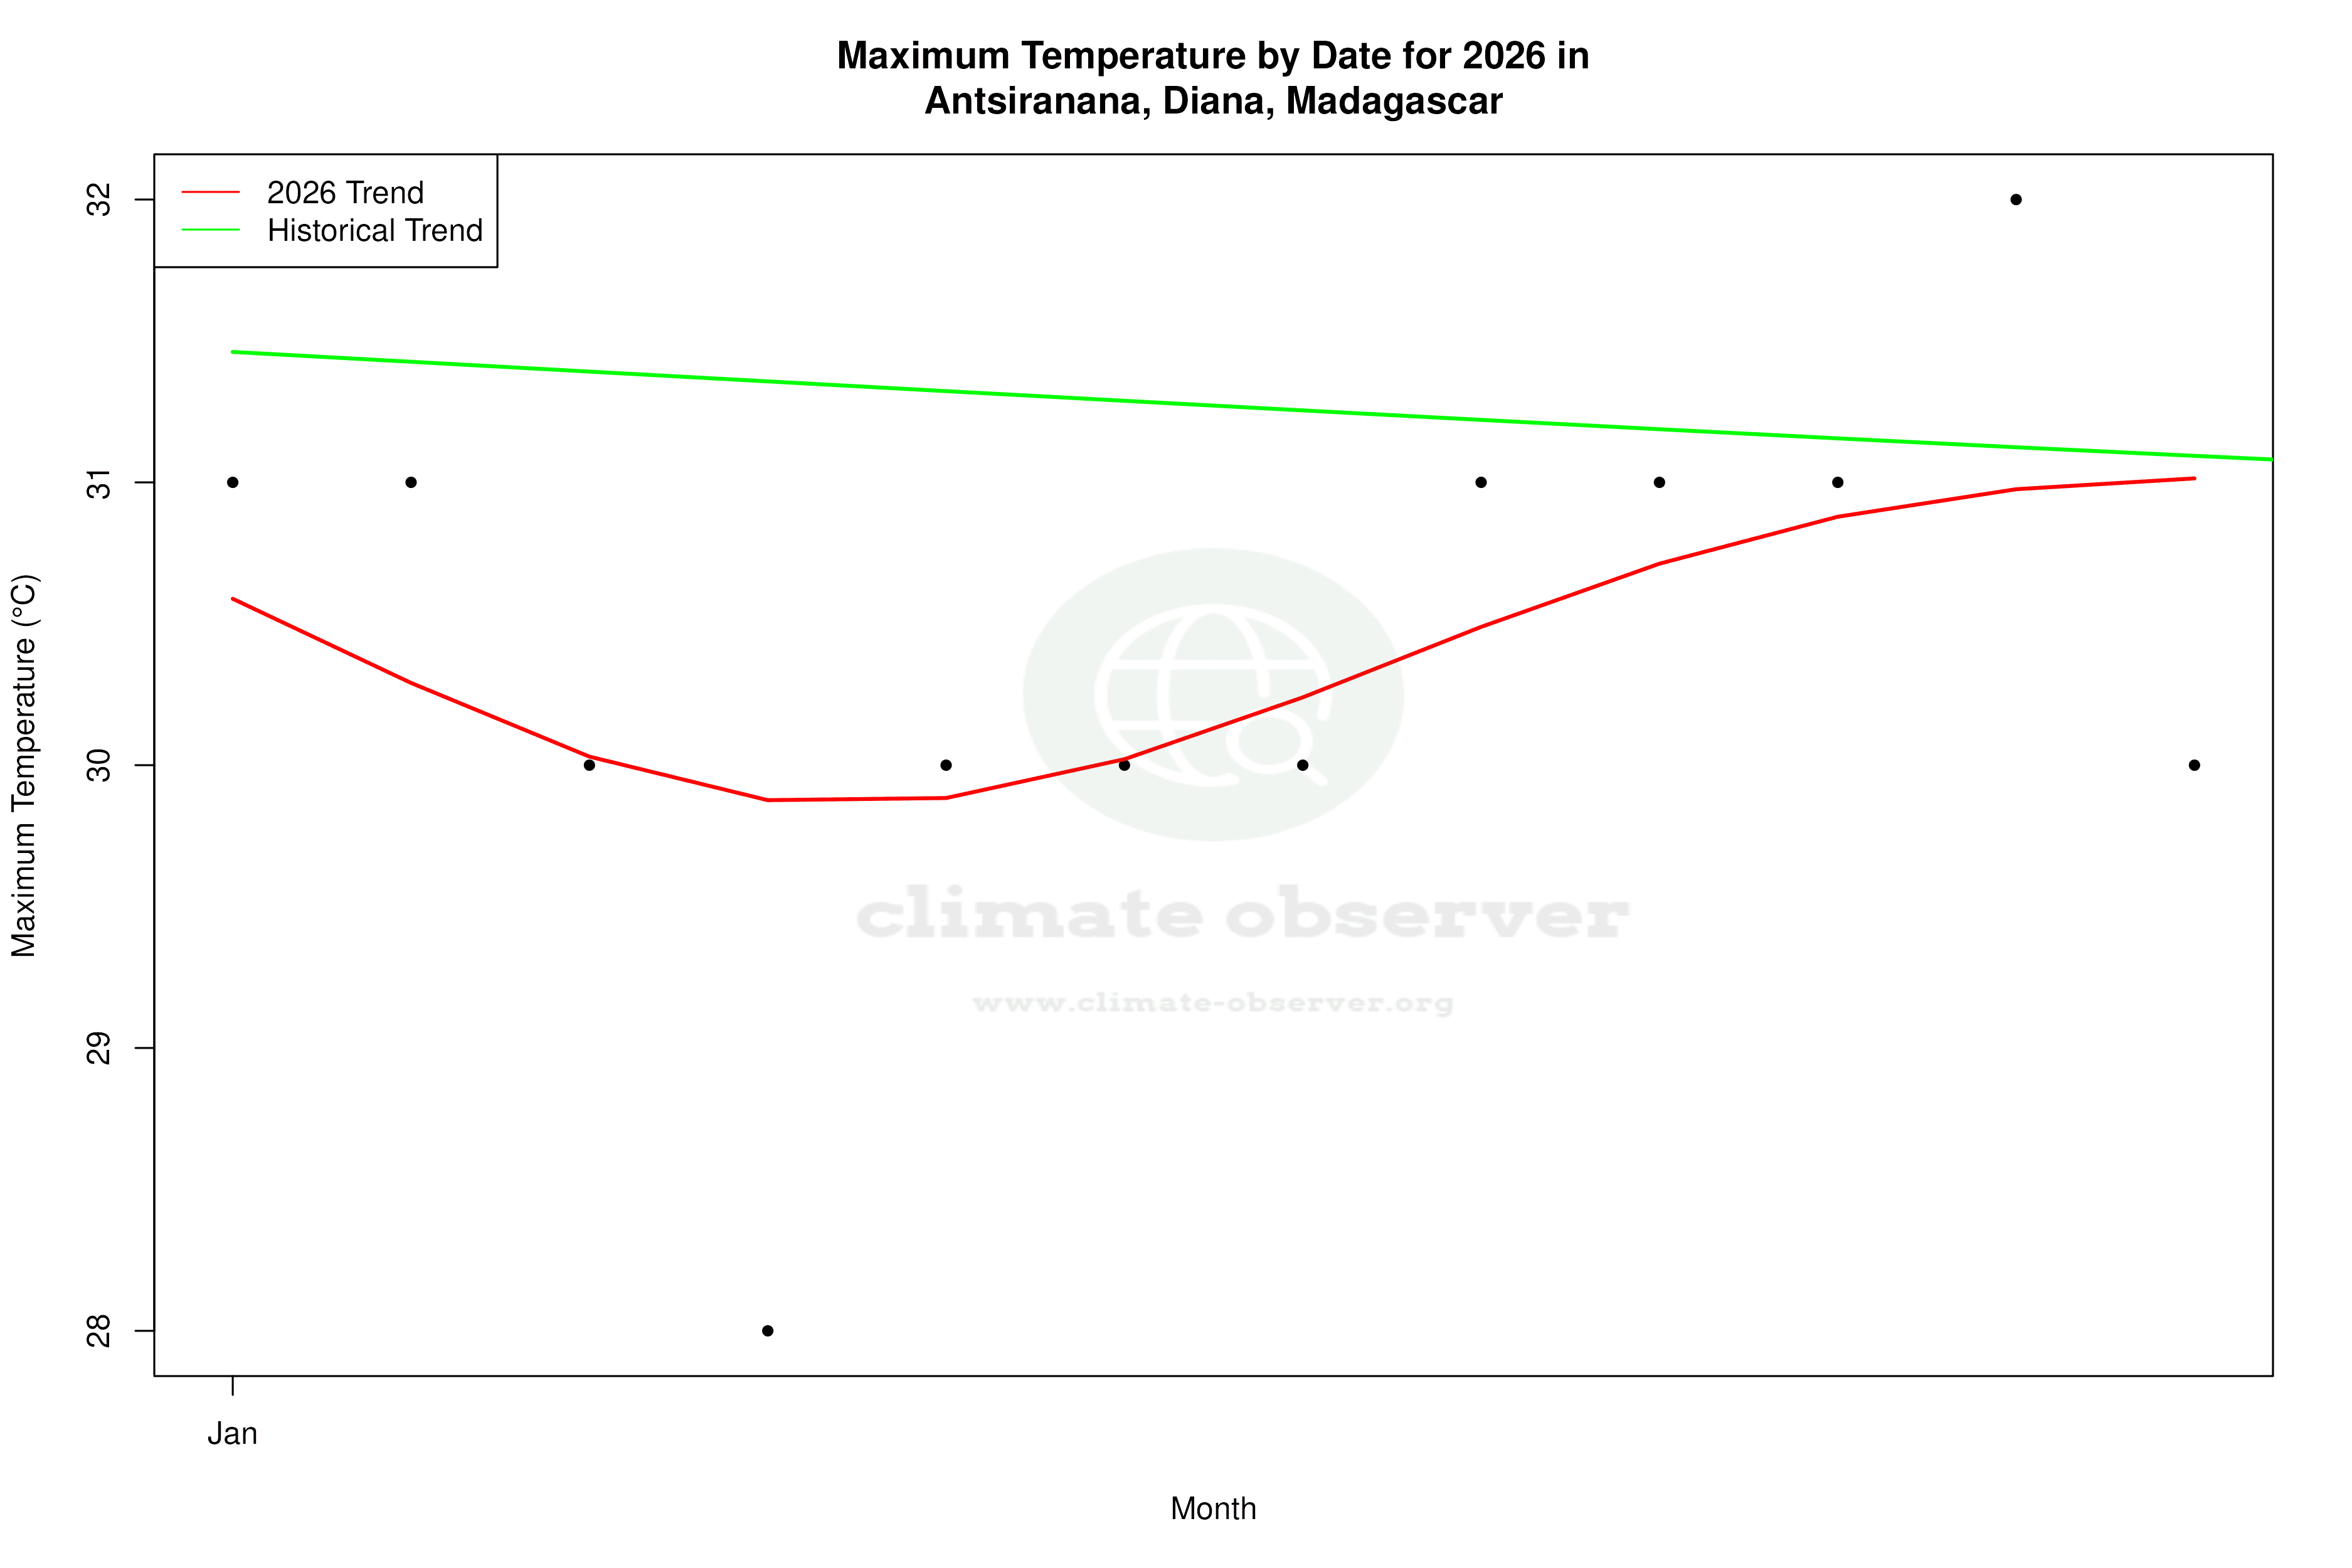


Max Temperature this Year | 1 of 6
Climate 12-Month Moving Averages


Max Temperature 12-Month MA | 1 of 6
Daily Data Points and Averages Throughout the Year


Average Max Temperature Throughout Year | 1 of 5
