Climate for Station: Dzaoudzi Pamandzi, Mayotte, Mayotte [France]
Loading live weather...
Climate Analysis & Overview
Dzaoudzi Pamandzi is experiencing a warming trend, with both high and low temperatures rising over the past decade. The Precipitation Concentration Index indicates a more even distribution of rainfall, which may influence local climate strategies in Mayotte.
Tropical Climate Dynamics
Dzaoudzi Pamandzi, located at -12.805, 45.281 in Mayotte, France, falls under the tropical savanna climate (Aw) according to the Köppen classification. This climate is characterised by a distinct wet and dry season, influenced by its proximity to the Indian Ocean. The station's geographical position on Pamandzi Island contributes to its climatic patterns, with oceanic currents moderating temperatures and affecting precipitation.
Temperature Trends and Implications
Over the past decade, Dzaoudzi Pamandzi has experienced a warming trend, with average high temperatures increasing by 0.52°C (0.94°F) and lows by 0.95°C (1.71°F). When considering the all-time data, the warming is evident with highs rising by 0.75°C (1.35°F) and lows by 0.30°C (0.54°F). These trends suggest a consistent rise in temperatures, which could impact local ecosystems and human activities. The record high temperature stands at 36.0°C (96.8°F), while the lowest recorded temperature is 14.9°C (58.8°F), indicating a relatively narrow range of extreme temperatures.
Evolving Precipitation Patterns
The Precipitation Concentration Index (PCI) for Dzaoudzi Pamandzi has decreased from a baseline of 18.9 to a current value of 14.5. This indicates a more even distribution of rainfall throughout the year, as a lower PCI suggests less concentration of precipitation in a few heavy events. This shift could be beneficial for agriculture and water management, reducing the risk of flooding and improving water availability during the dry season.
Regional Climate Goals and Adaptation
Mayotte, as part of France, is committed to the European Union's climate goals, which include reducing greenhouse gas emissions and adapting to climate change impacts. The warming trends and changes in precipitation patterns at Dzaoudzi Pamandzi provide valuable data for regional planning. Understanding these shifts is crucial for developing strategies to mitigate climate impacts, such as investing in sustainable infrastructure and enhancing resilience to extreme weather events.
Localised Weather Events and Future Considerations
Recent weather events in Mayotte, such as cyclones and heavy rainfall, underscore the importance of monitoring climate trends. The data from Dzaoudzi Pamandzi can help predict future weather patterns and inform local authorities about necessary preparations. As temperatures continue to rise and precipitation becomes more evenly distributed, ongoing research and adaptation efforts will be vital in ensuring the region's sustainable development and climate resilience.
Station Statistics
10-Year Trend
High: +0.27 °C/decade
Low: +1.01 °C/decade
Rain: -0.52 mm/decade
25-Year Trend
High: +1.12 °C/decade
Low: +0.27 °C/decade
Rain: -0.06 mm/decade
50-Year Trend
High: +0.74 °C/decade
Low: +0.30 °C/decade
Rain: -0.11 mm/decade
All-Time Trend
High: +0.74 °C/decade
Low: +0.30 °C/decade
Rain: -0.11 mm/decade
Percentage Above-Average Days
Last 12 Months: 49.0%
This Year: 20.3%
Precipitation Concentration Index (PCI) ℹ️
Last 12 Months: 18.6
Historical Average: 18.9
Percentile Rank of Last 12 Months ℹ️
High: 84th percentile
Low: 93rd percentile
Rain: 41st percentile
Change in Variance ℹ️
High: -31.6%
Low: -12.1%
Intraday: -30.5%
Data Coverage
92.3%
First Year of Data
1973
Station Location
Historical Weather Records
| Max High | Avg High | Min High | Max Avg | Avg Avg | Min Avg | Max Low | Avg Low | Min Low | Max Precipitation | Avg Precipitation | Max Snow | Avg Snow | |
|---|---|---|---|---|---|---|---|---|---|---|---|---|---|
| Record | 36.0 °C | — | 23.4 °C | 31.5 °C | — | 21.5 °C | 29.6 °C | — | 14.9 °C | 220.0 mm | — | — | — |
| January | 34.5 °C | 30.0 °C | 26.2 °C | 31.3 °C | 27.9 °C | 21.5 °C | 29.4 °C | 25.7 °C | 21.0 °C | 194.1 mm | 8.8 mm | — | — |
| February | 34.0 °C | 30.1 °C | 26.0 °C | 30.4 °C | 27.9 °C | 22.1 °C | 29.6 °C | 25.8 °C | 20.0 °C | 126.0 mm | 7.4 mm | — | — |
| March | 33.8 °C | 30.3 °C | 26.6 °C | 31.0 °C | 28.1 °C | 22.2 °C | 29.4 °C | 25.8 °C | 21.0 °C | 192.0 mm | 6.7 mm | — | — |
| April | 35.8 °C | 30.3 °C | 26.9 °C | 31.5 °C | 28.2 °C | 23.6 °C | 29.6 °C | 25.8 °C | 20.2 °C | 80.0 mm | 3.4 mm | — | — |
| May | 36.0 °C | 29.5 °C | 25.6 °C | 30.3 °C | 27.5 °C | 23.8 °C | 29.0 °C | 25.1 °C | 18.8 °C | 119.9 mm | 1.1 mm | — | — |
| June | 32.0 °C | 28.2 °C | 24.9 °C | 28.9 °C | 26.3 °C | 22.2 °C | 27.4 °C | 23.8 °C | 16.2 °C | 26.9 mm | 0.5 mm | — | — |
| July | 30.7 °C | 27.3 °C | 23.8 °C | 27.1 °C | 25.3 °C | 21.6 °C | 26.0 °C | 22.5 °C | 15.2 °C | 39.9 mm | 0.4 mm | — | — |
| August | 31.0 °C | 27.3 °C | 23.8 °C | 27.0 °C | 25.1 °C | 21.6 °C | 25.7 °C | 21.7 °C | 14.9 °C | 220.0 mm | 0.5 mm | — | — |
| September | 32.5 °C | 27.9 °C | 23.4 °C | 28.3 °C | 25.5 °C | 21.9 °C | 25.6 °C | 22.1 °C | 14.9 °C | 59.9 mm | 0.7 mm | — | — |
| October | 33.7 °C | 28.8 °C | 24.7 °C | 29.1 °C | 26.6 °C | 22.6 °C | 27.1 °C | 23.5 °C | 18.0 °C | 59.9 mm | 1.2 mm | — | — |
| November | 34.1 °C | 29.6 °C | 25.8 °C | 30.8 °C | 27.5 °C | 23.5 °C | 28.6 °C | 24.8 °C | 17.4 °C | 160.0 mm | 2.7 mm | — | — |
| December | 35.0 °C | 30.1 °C | 26.4 °C | 30.4 °C | 27.9 °C | 22.7 °C | 29.1 °C | 25.5 °C | 21.0 °C | 111.0 mm | 5.2 mm | — | — |
Data Visualisations
Remove WatermarksCurrent Year Climate Trends vs Historical


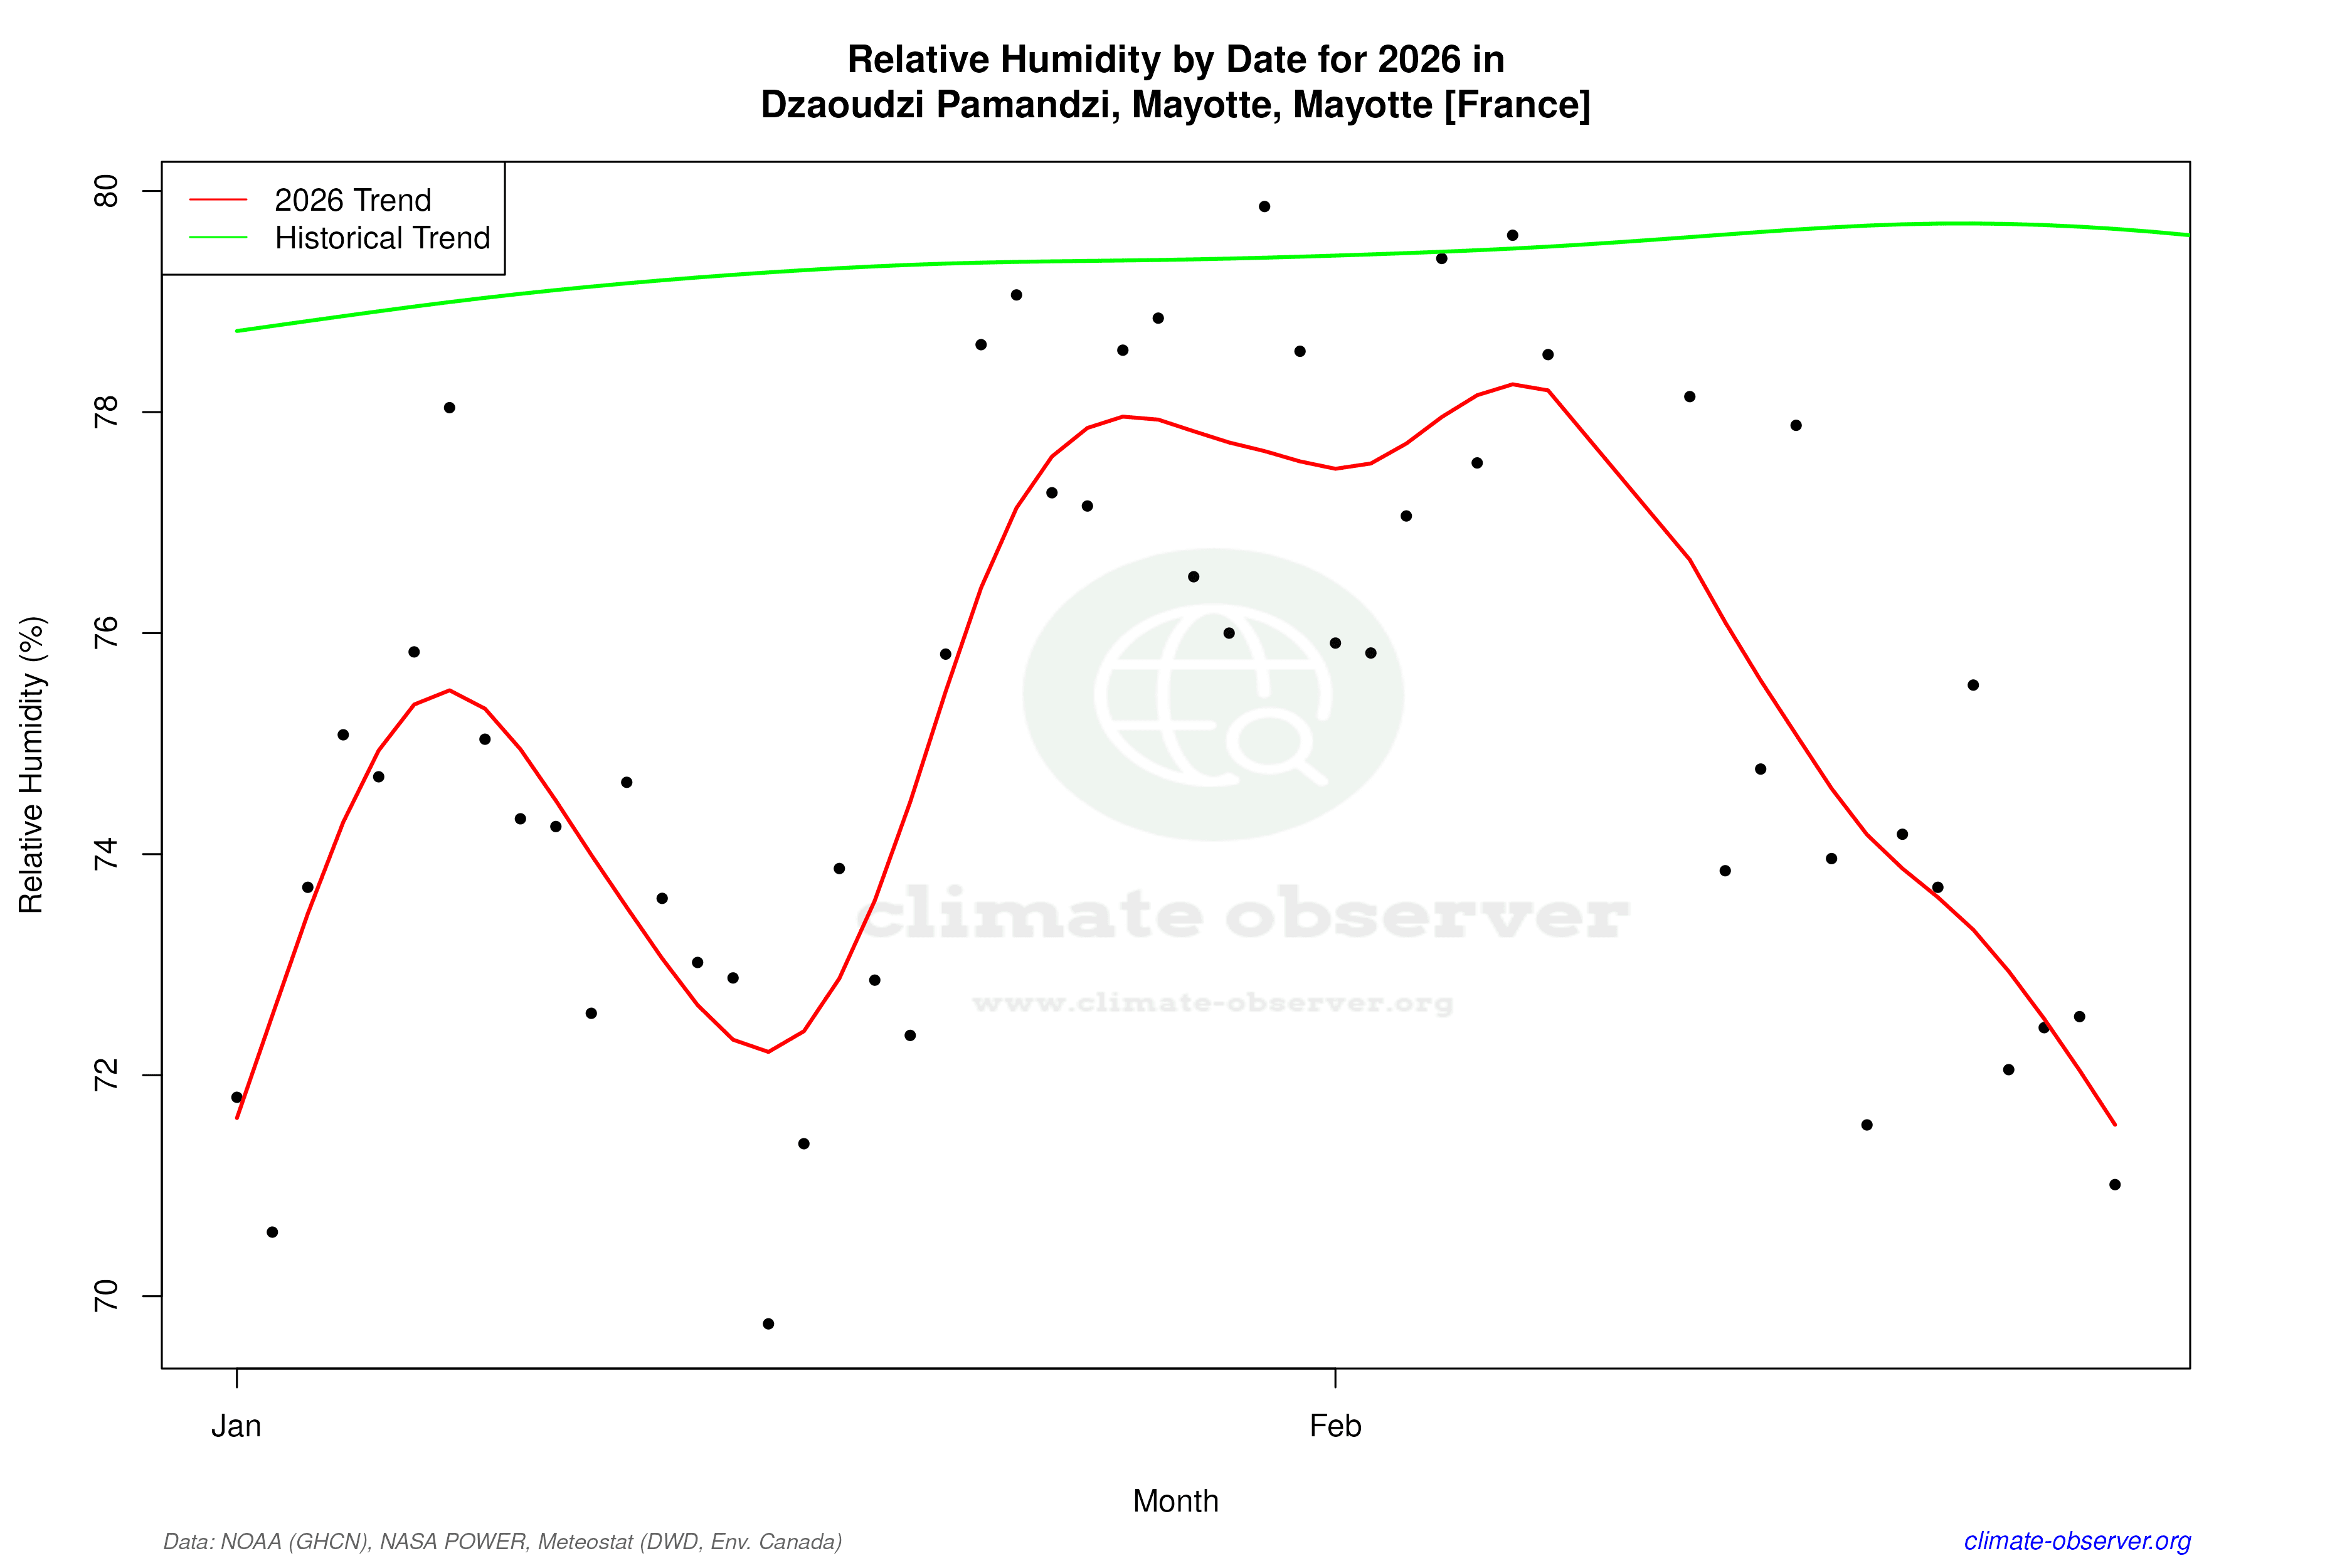

Max Temperature this Year | 1 of 6
Climate 12-Month Moving Averages


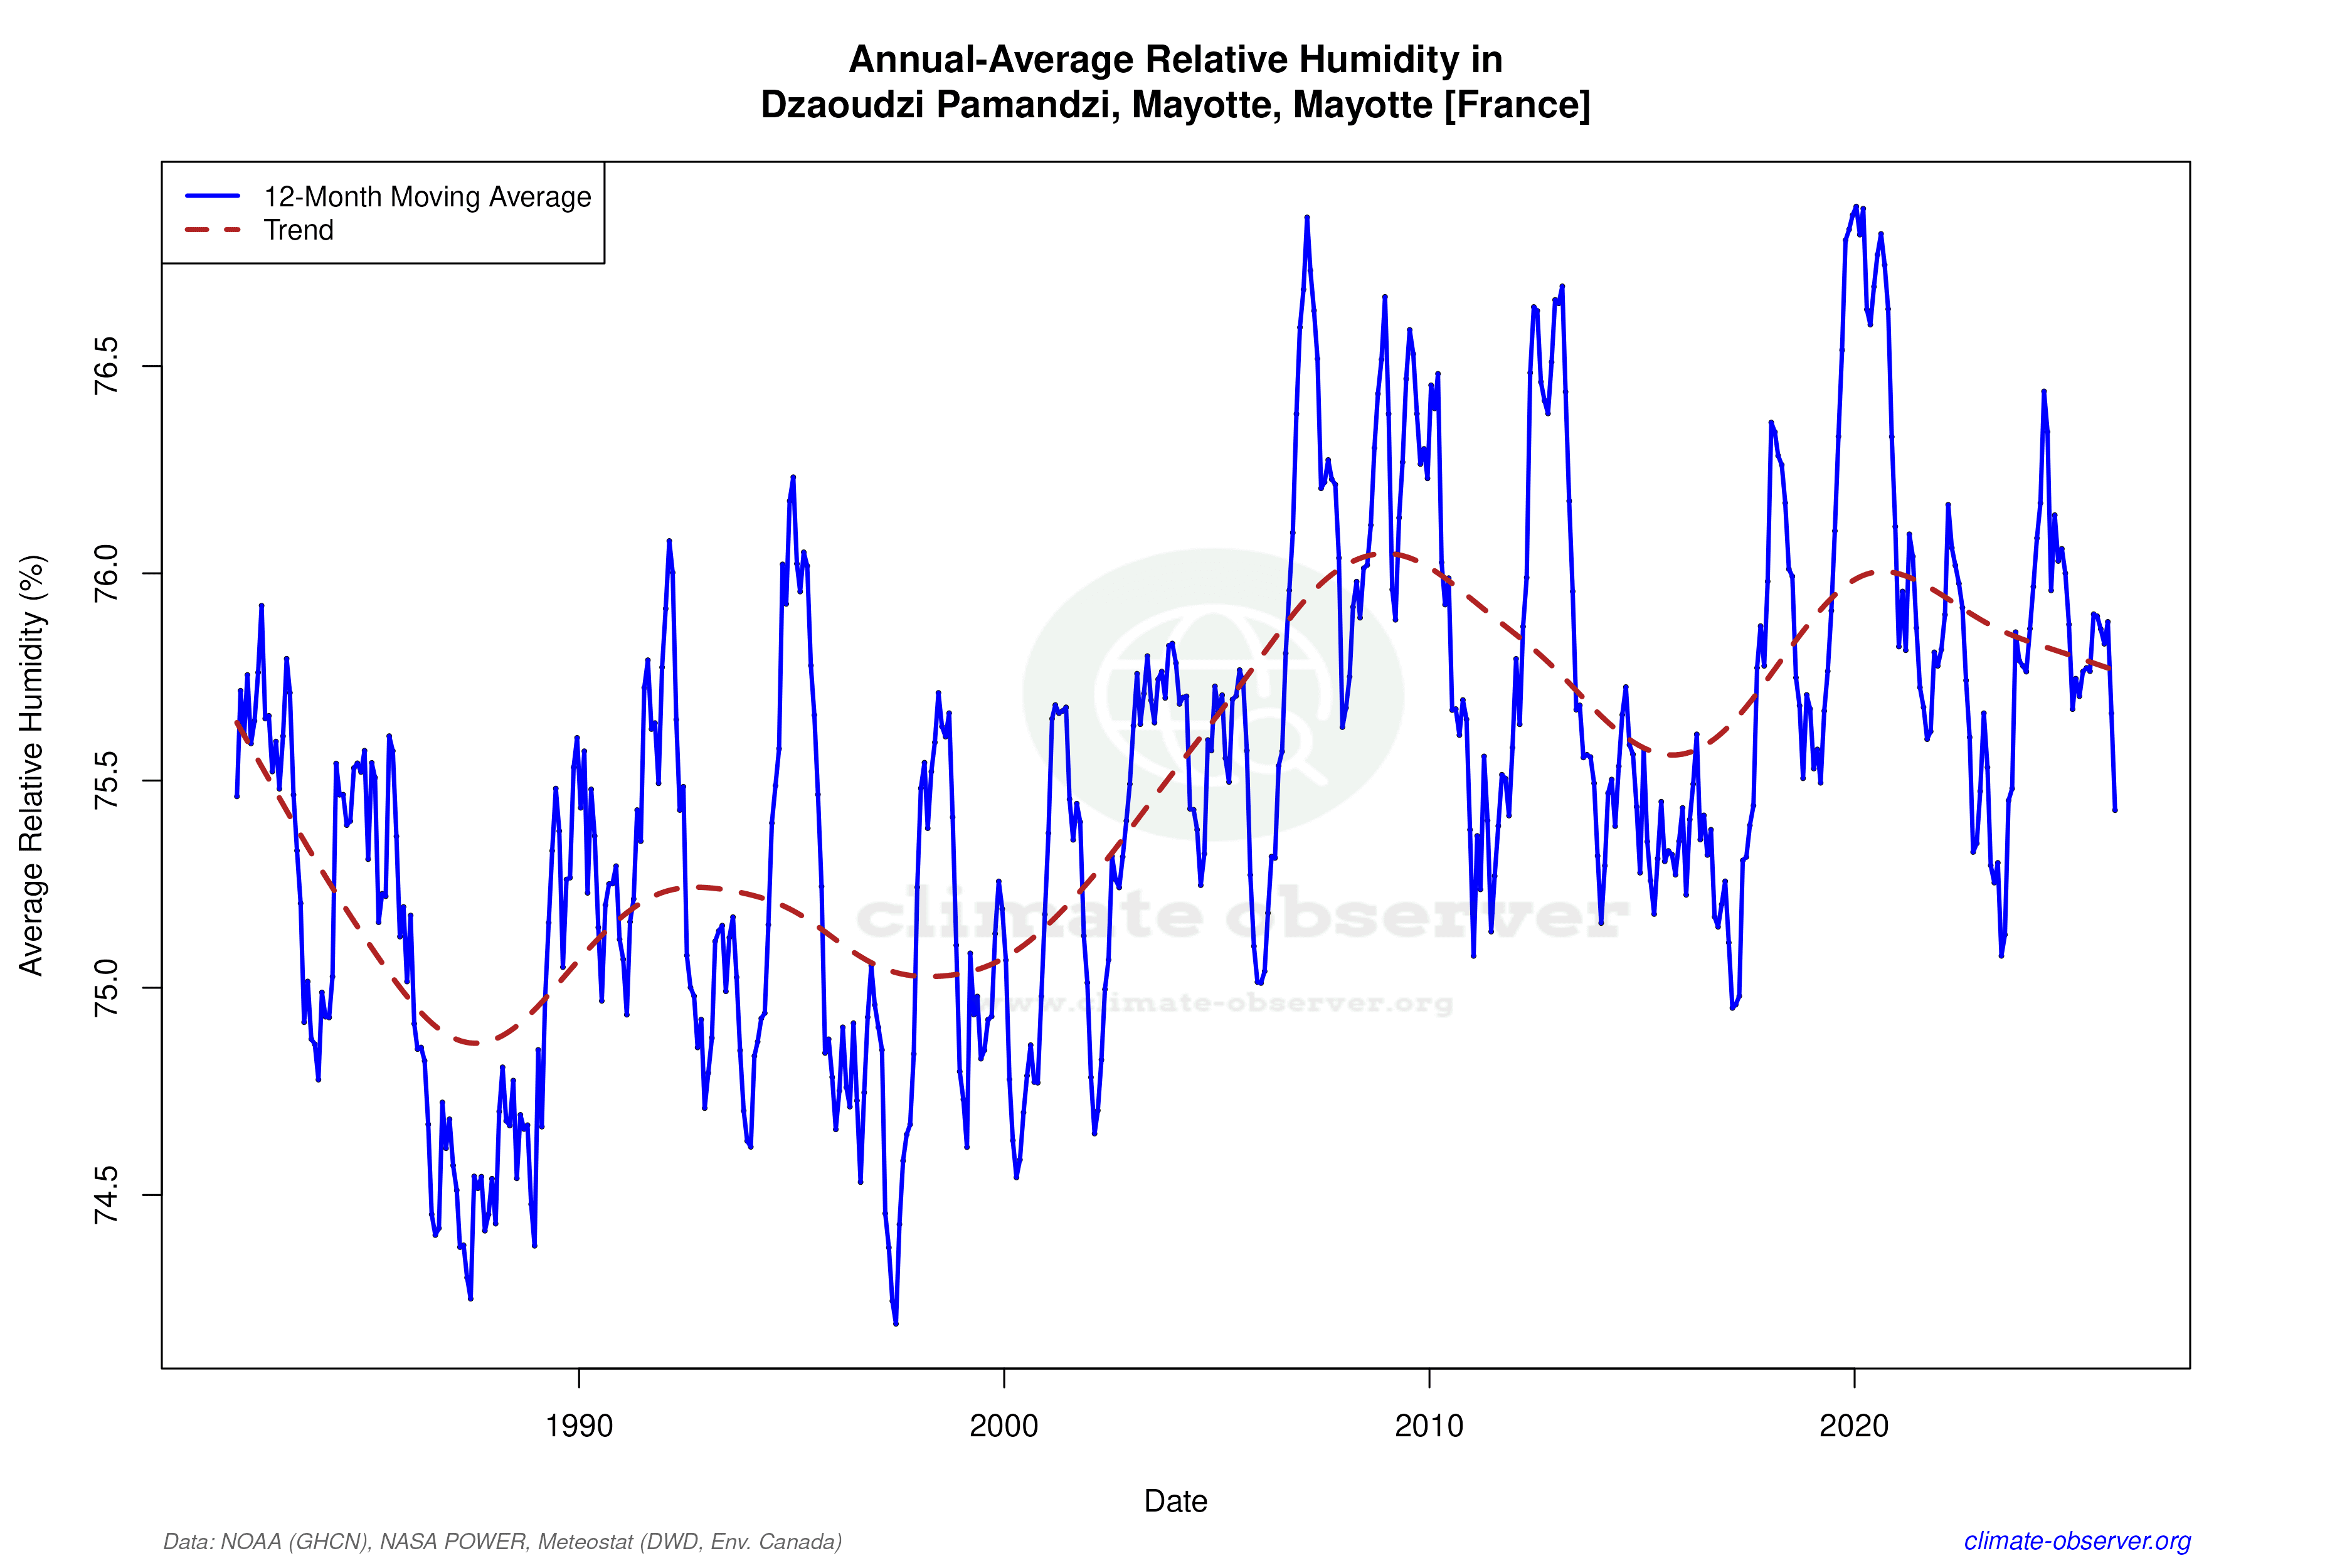

Max Temperature 12-Month MA | 1 of 6
Daily Data Points and Averages Throughout the Year


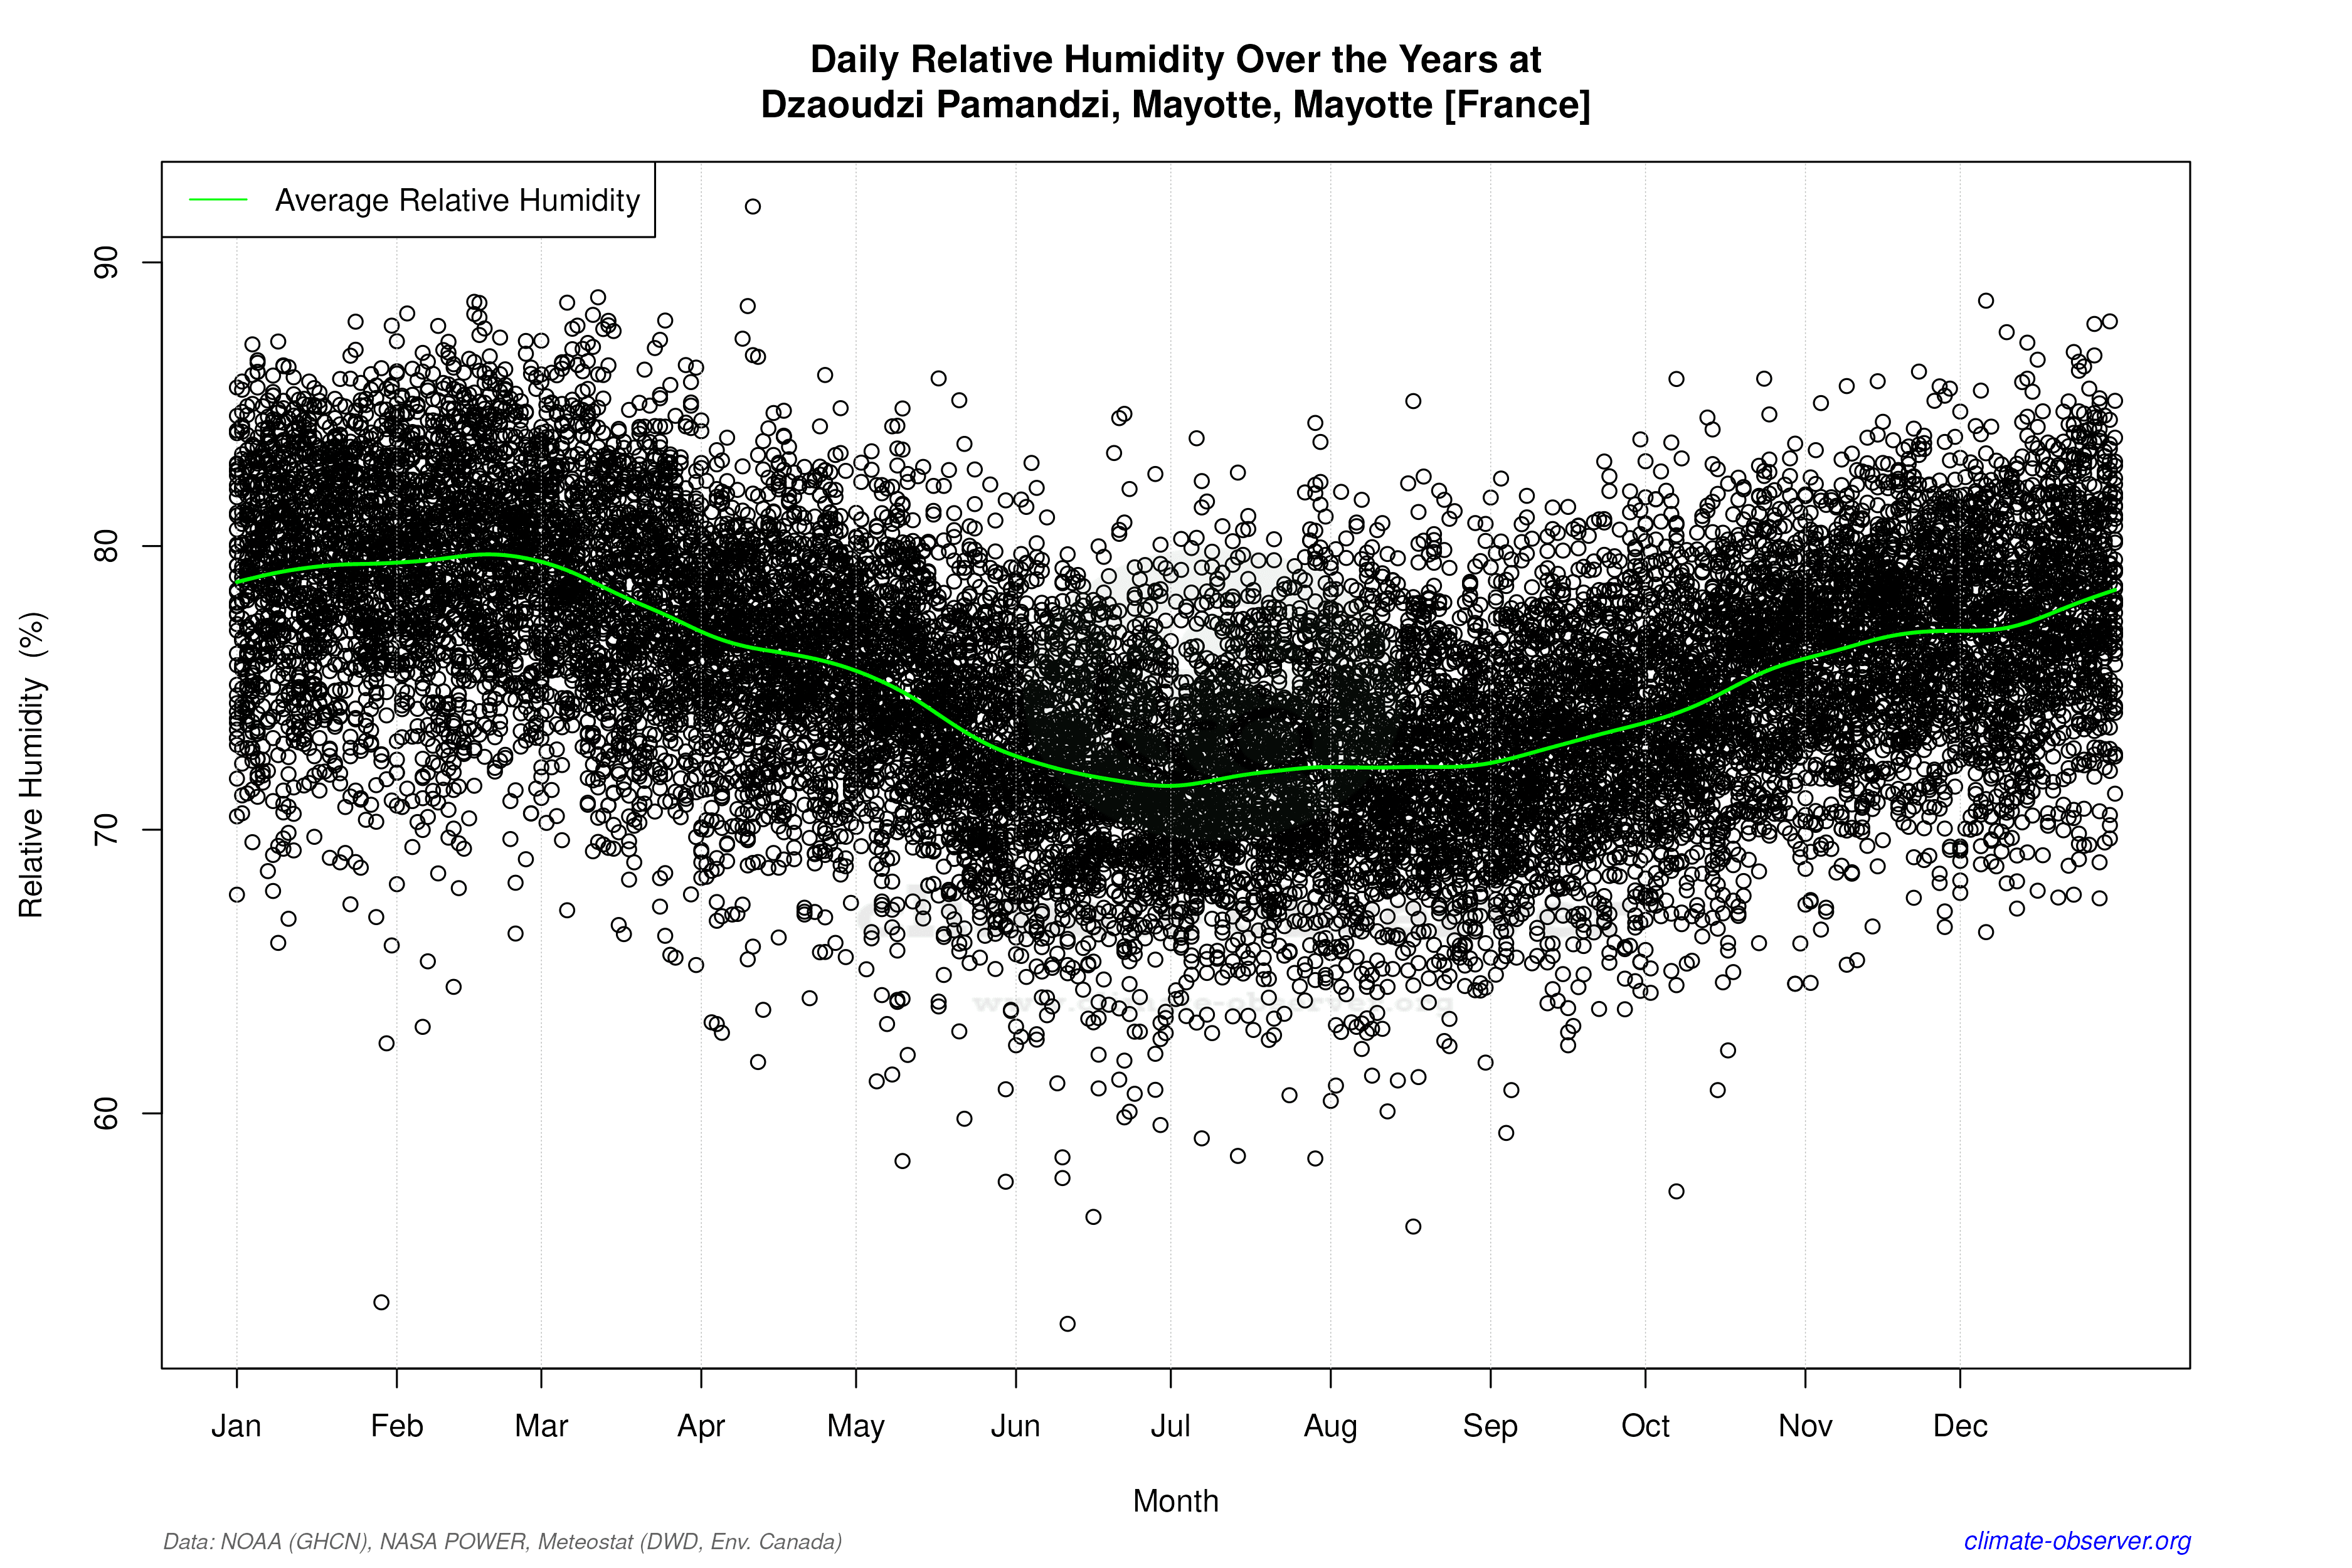

Average Max Temperature Throughout Year | 1 of 5
