Climate for Station: Dalanzadgad, Umnugobi Province, Mongolia
Loading live weather...
Climate Analysis & Overview
Dalanzadgad, nestled in Mongolia's desert region, is experiencing contrasting temperature trends. While all-time data shows slight warming, recent years reveal a cooling trend for highs and a warming trend for lows. Precipitation is becoming more evenly distributed, indicating a shift in weather patterns.
Desert Climate Dynamics
Dalanzadgad is classified under the Köppen climate classification as a cold desert climate (BWk), characterised by arid conditions with significant temperature variations between day and night. Situated in the Ömnögovi Province of Mongolia, the region's geography, dominated by the Gobi Desert, influences its climate. The absence of large water bodies and the presence of vast arid landscapes contribute to its extreme temperature records, with a maximum of 39.9°C (103.8°F) and a minimum of -36.1°C (-33.0°F).
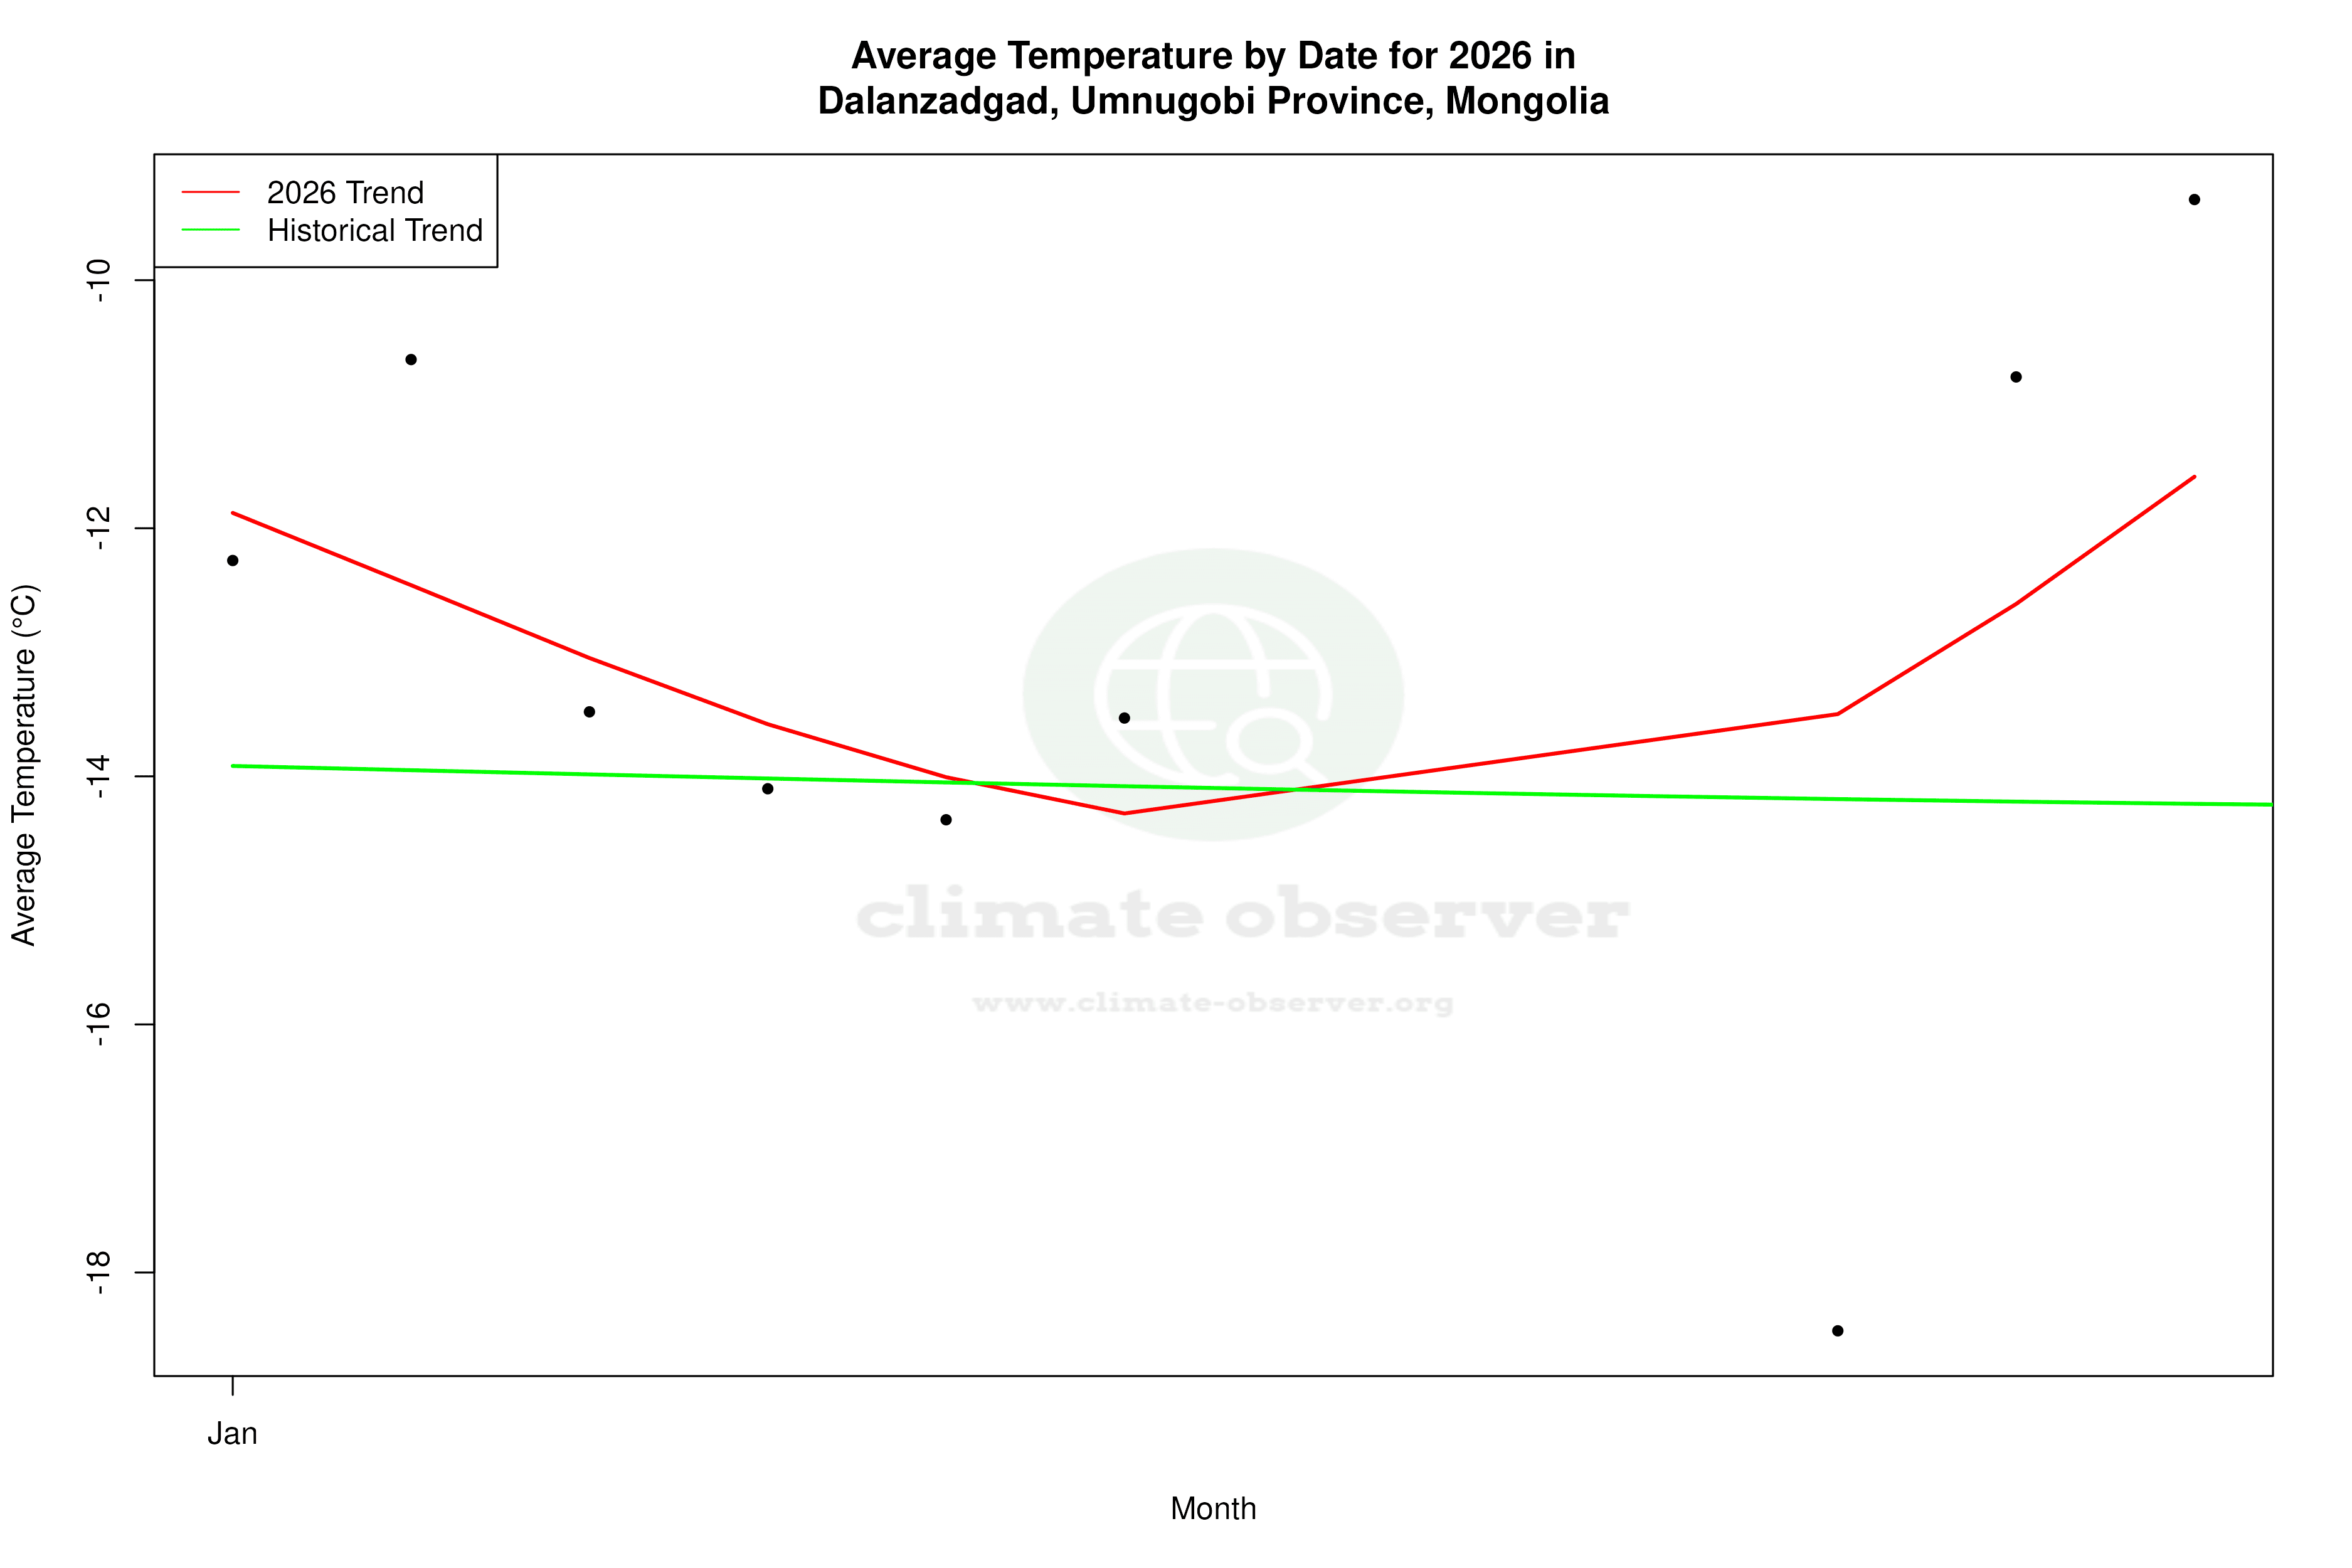
Temperature Trends: A Tale of Two Intervals
The long-term temperature trends in Dalanzadgad indicate a slight warming, with all-time highs increasing by 0.18°C (0.32°F) and lows by 0.26°C (0.47°F). However, the last decade presents a more complex picture. High temperatures have cooled by 1.25°C (2.25°F), while low temperatures have warmed by 1.51°C (2.72°F). This divergence suggests a narrowing of the diurnal temperature range, possibly due to changes in atmospheric conditions or land use.
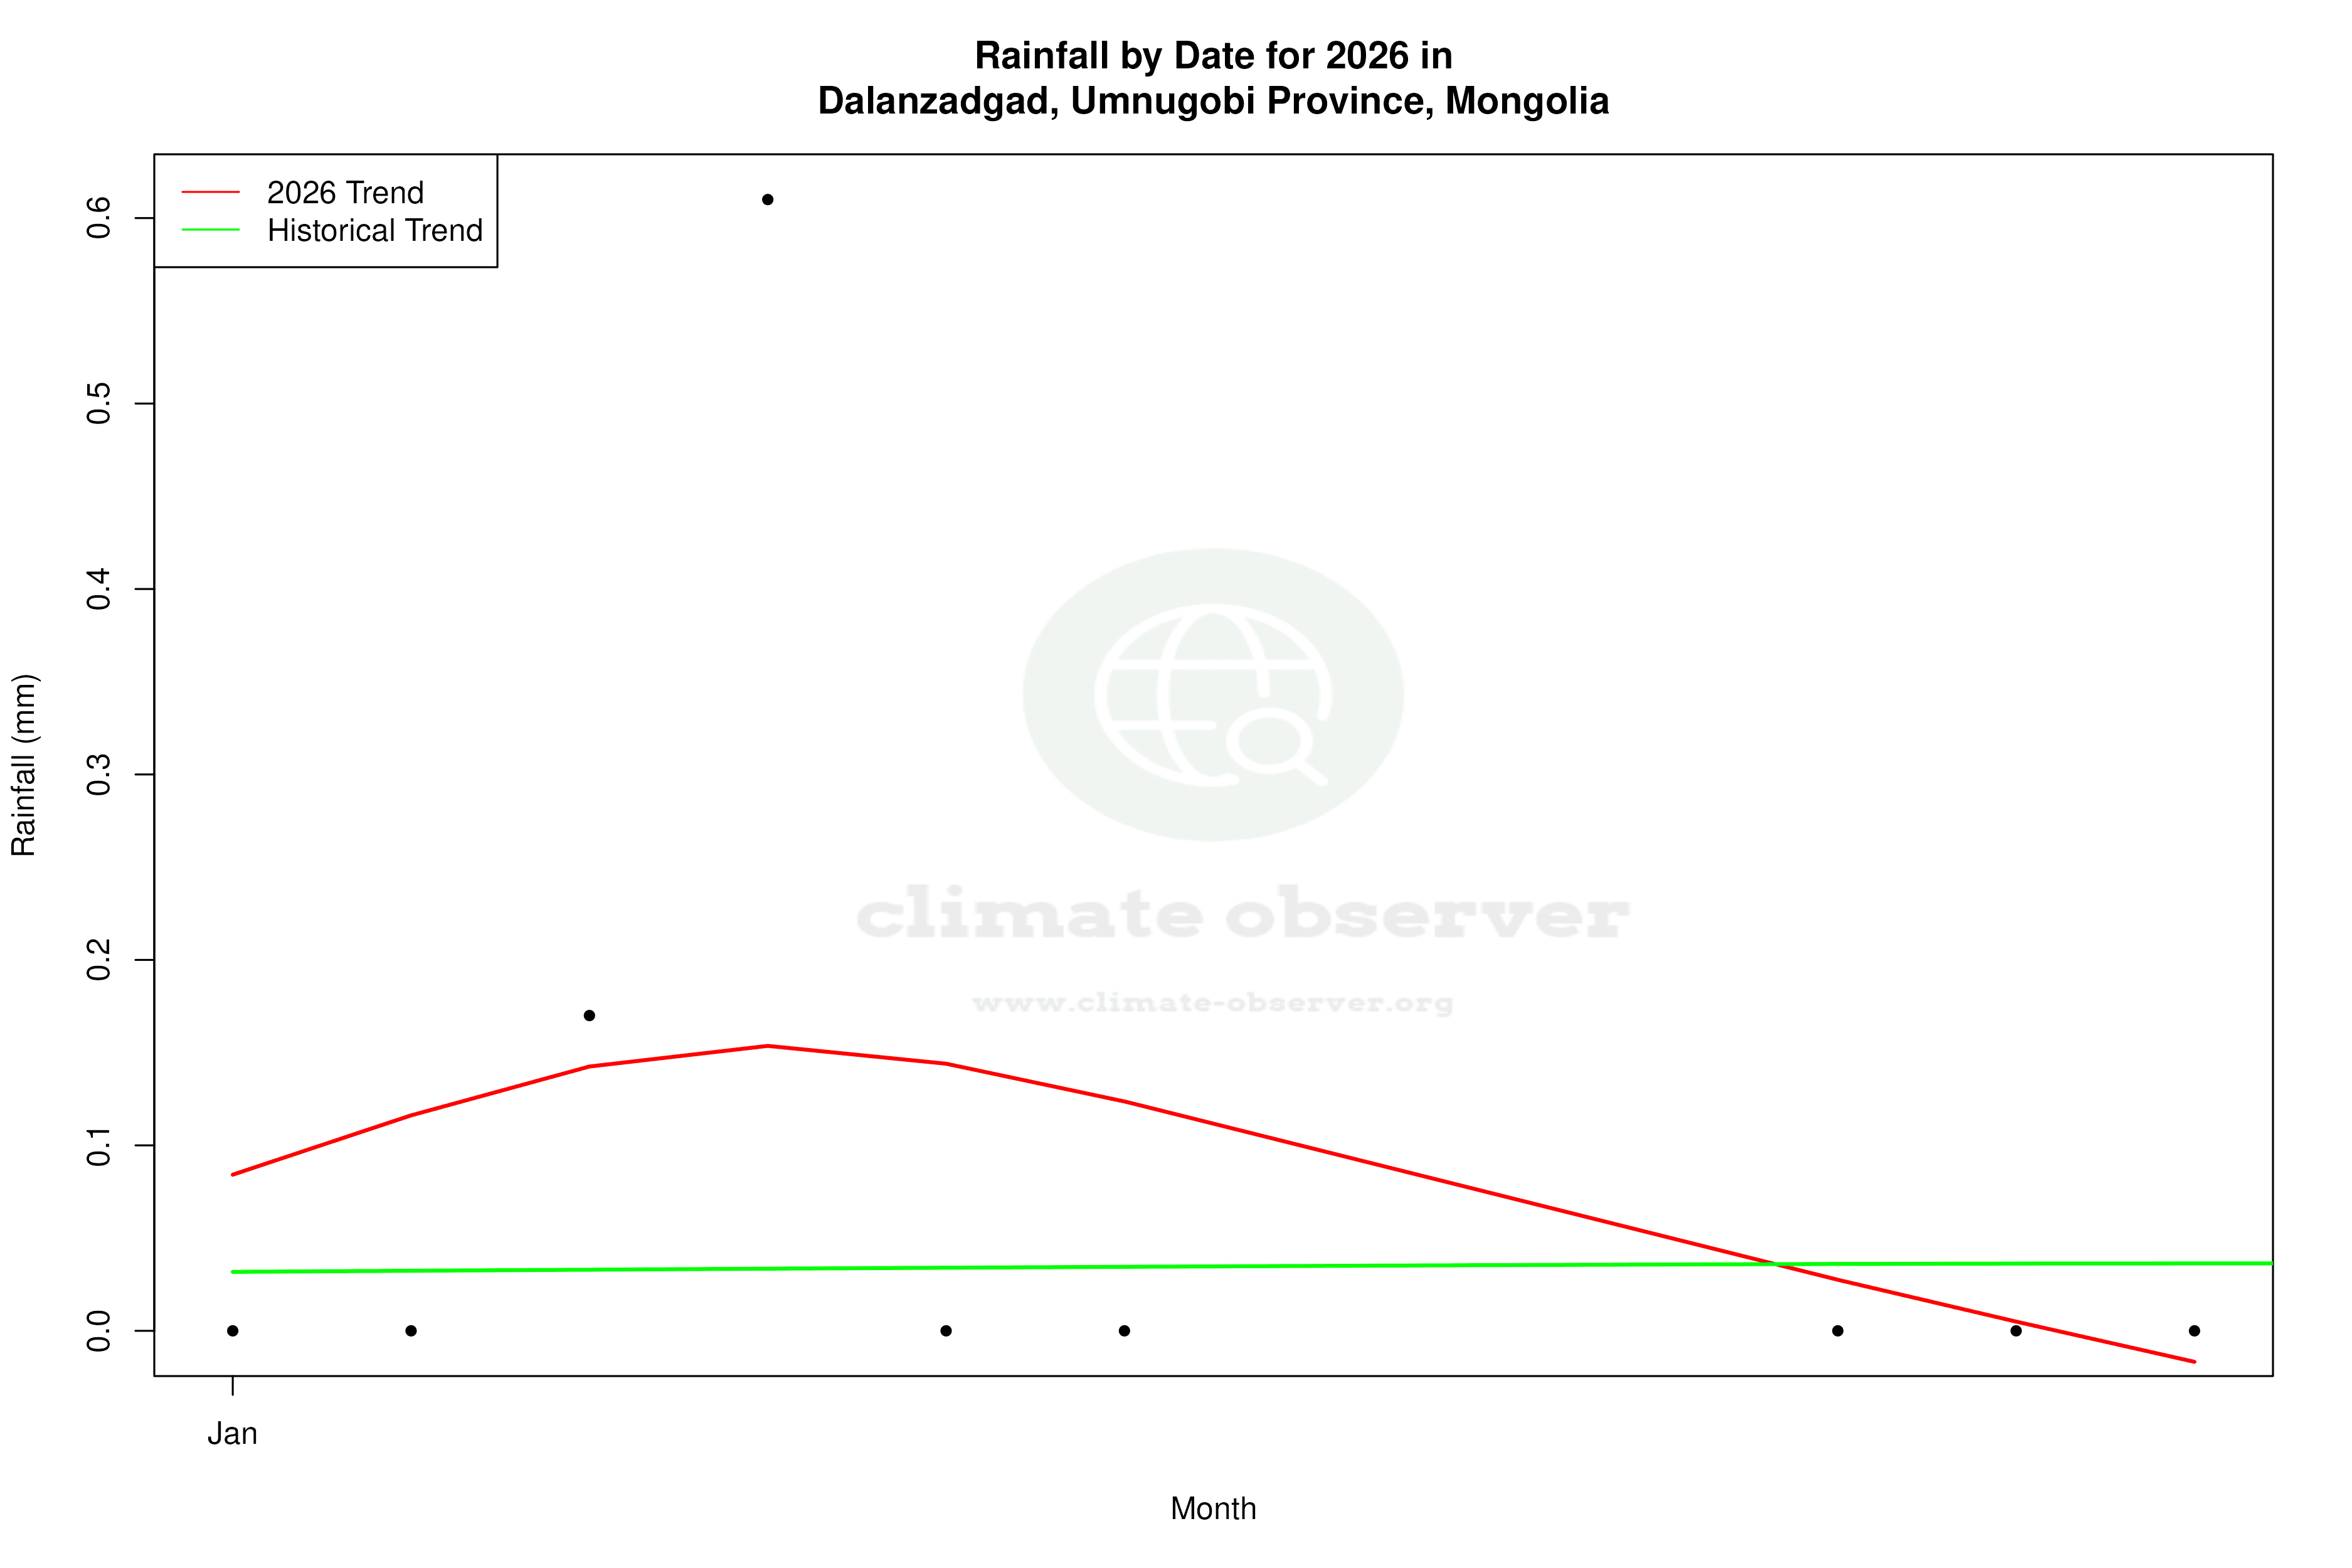
Precipitation Patterns: From Concentration to Distribution
The Precipitation Concentration Index (PCI) for Dalanzadgad has decreased from a baseline of 23.4 to a current value of 18.8. A PCI over 20 indicates highly concentrated precipitation events, while a decrease suggests a shift towards more evenly distributed rainfall throughout the year. This significant change may impact local agriculture and water resource management, aligning with Mongolia's regional climate goals to adapt to evolving precipitation patterns.
Regional Thermal Oscillations
Mongolia's climate strategy focuses on mitigating the impacts of temperature fluctuations. The contrasting temperature trends in Dalanzadgad, with cooling highs and warming lows over the past decade, could influence local ecosystems and human activities. These oscillations may require adaptive measures to ensure sustainable development in the region.
Implications of Recent Weather Events
Recent weather events, such as dust storms and heatwaves, highlight the challenges posed by Dalanzadgad's evolving climate. The region's adaptation strategies must consider these events alongside the observed trends. The shift towards more evenly distributed precipitation could mitigate some impacts of extreme weather, offering a glimmer of resilience in an otherwise harsh environment.
Station Statistics
10-Year Trend
High: -1.43 °C/decade
Low: +1.73 °C/decade
Rain: +0.11 mm/decade
25-Year Trend
High: +0.14 °C/decade
Low: +0.56 °C/decade
Rain: +0.10 mm/decade
50-Year Trend
High: +0.17 °C/decade
Low: +0.16 °C/decade
Rain: +0.04 mm/decade
All-Time Trend
High: +0.18 °C/decade
Low: +0.27 °C/decade
Rain: +0.02 mm/decade
Percentage Above-Average Days
Last 12 Months: 53.4%
This Year: 54.5%
Precipitation Concentration Index (PCI) ℹ️
Last 12 Months: 26.8
Historical Average: 25.2
Percentile Rank of Last 12 Months ℹ️
High: 29th percentile
Low: 99th percentile
Rain: 93rd percentile
Change in Variance ℹ️
High: +1.4%
Low: -6.6%
Intraday: +13.4%
Data Coverage
92.8%
First Year of Data
1956
Station Location
Historical Weather Records
| Max High | Avg High | Min High | Max Avg | Avg Avg | Min Avg | Max Low | Avg Low | Min Low | Max Precipitation | Avg Precipitation | Max Snow | Avg Snow | |
|---|---|---|---|---|---|---|---|---|---|---|---|---|---|
| Record | 39.9 °C | — | -26.1 °C | 34.8 °C | — | -28.5 °C | 25.9 °C | — | -36.1 °C | 79.2 mm | — | — | — |
| January | 9.4 °C | -7.3 °C | -25.2 °C | 4.0 °C | -14.0 °C | -28.5 °C | -4.4 °C | -20.2 °C | -33.1 °C | 4.0 mm | 0.0 mm | — | — |
| February | 14.7 °C | -3.0 °C | -24.4 °C | 9.2 °C | -9.6 °C | -25.9 °C | 0.8 °C | -16.8 °C | -34.2 °C | 8.8 mm | 0.1 mm | — | — |
| March | 21.9 °C | 5.0 °C | -15.2 °C | 15.1 °C | -1.6 °C | -19.9 °C | 9.2 °C | -9.0 °C | -27.8 °C | 9.0 mm | 0.1 mm | — | — |
| April | 30.7 °C | 13.9 °C | -7.7 °C | 23.2 °C | 7.4 °C | -13.7 °C | 16.3 °C | -0.6 °C | -20.2 °C | 19.0 mm | 0.1 mm | — | — |
| May | 33.8 °C | 21.1 °C | 0.4 °C | 28.3 °C | 14.6 °C | -2.7 °C | 22.8 °C | 6.8 °C | -8.9 °C | 30.0 mm | 0.3 mm | — | — |
| June | 37.4 °C | 26.4 °C | 7.8 °C | 31.4 °C | 20.0 °C | 5.0 °C | 24.0 °C | 12.7 °C | -1.1 °C | 53.0 mm | 0.6 mm | — | — |
| July | 39.9 °C | 28.3 °C | 15.1 °C | 34.8 °C | 22.3 °C | 10.6 °C | 25.9 °C | 15.5 °C | 2.7 °C | 79.2 mm | 1.1 mm | — | — |
| August | 37.5 °C | 26.4 °C | 12.0 °C | 31.3 °C | 20.3 °C | 6.2 °C | 25.2 °C | 13.6 °C | 1.8 °C | 58.2 mm | 1.0 mm | — | — |
| September | 32.4 °C | 20.5 °C | 1.2 °C | 28.2 °C | 14.2 °C | -1.8 °C | 20.5 °C | 7.1 °C | -9.7 °C | 33.2 mm | 0.4 mm | — | — |
| October | 29.0 °C | 12.2 °C | -9.5 °C | 20.0 °C | 5.5 °C | -12.4 °C | 16.6 °C | -1.5 °C | -17.1 °C | 18.7 mm | 0.1 mm | — | — |
| November | 20.1 °C | 2.2 °C | -18.9 °C | 12.1 °C | -4.5 °C | -23.8 °C | 6.5 °C | -10.7 °C | -28.9 °C | 6.0 mm | 0.1 mm | — | — |
| December | 12.6 °C | -5.4 °C | -26.1 °C | 6.9 °C | -11.9 °C | -27.1 °C | 2.1 °C | -18.0 °C | -36.1 °C | 6.6 mm | 0.0 mm | — | — |
Data Visualisations
Remove WatermarksCurrent Year Climate Trends vs Historical


Max Temperature this Year | 1 of 6
Climate 12-Month Moving Averages


Max Temperature 12-Month MA | 1 of 6
Daily Data Points and Averages Throughout the Year


Average Max Temperature Throughout Year | 1 of 5
