Climate for Station: Nioro Du Sahel, Kayes Region, Mali
Loading live weather...
Climate Analysis & Overview
Nioro Du Sahel, located in the Kayes region of Mali, is experiencing a notable warming trend, with both highs and lows increasing over the last decade. This warming is coupled with a significant rise in the concentration of precipitation, suggesting more intense and less frequent rainfall events.
Climate Dynamics of Nioro Du Sahel
Nioro Du Sahel is situated at coordinates 15.233, -9.35, nestled within the semi-arid Sahel region of Mali. This area is characterised by a hot desert climate, classified under the Köppen system as BWh. The geography of Nioro Du Sahel, with its flat terrain and lack of significant water bodies, contributes to its extreme temperatures and limited rainfall. The all-time temperature trends show a 0.24°C (0.43°F) rise in highs and a 0.12°C (0.22°F) rise in lows, indicating a gradual warming over the years.
Recent Thermal Trends
In the past decade, the temperature trends in Nioro Du Sahel have intensified, with highs increasing by 0.78°C (1.40°F) and lows by 0.68°C (1.22°F). This suggests a more pronounced warming in recent years, which could be attributed to global climate change and regional environmental factors. The highest recorded temperature stands at 48.3°C (118.9°F), while the lowest is 1.5°C (34.7°F), showcasing the extreme thermal range of the region.
Precipitation Patterns and Implications
The Precipitation Concentration Index (PCI) for Nioro Du Sahel has risen significantly from a baseline of 28.4 to the current 40.4. PCI measures the distribution of rainfall over time, with higher values indicating more concentrated precipitation events. This increase suggests that rainfall is becoming less frequent but more intense, a pattern that could lead to challenges in water management and agriculture. Such concentrated precipitation can exacerbate flooding risks and soil erosion, impacting local livelihoods.
Regional Climate Context
Mali's climate goals focus on adapting to and mitigating the impacts of climate change, particularly in vulnerable regions like the Sahel. Recent weather events, such as prolonged droughts and sudden heavy rains, underscore the need for robust climate resilience strategies. The warming trends and changing precipitation patterns in Nioro Du Sahel highlight the urgency for targeted interventions to support sustainable development in the region.
Implications for Future Climate Strategy
The data from Nioro Du Sahel underscores the importance of integrating climate science into regional planning. With a warming trend and increased precipitation concentration, strategies must focus on enhancing water conservation, improving agricultural practices, and building infrastructure that can withstand extreme weather events. These measures will be crucial in safeguarding the well-being of communities in this arid landscape.
Station Statistics
10-Year Trend
High: +0.48 °C/decade
Low: +0.31 °C/decade
Rain: -1.43 mm/decade
25-Year Trend
High: -0.14 °C/decade
Low: +0.18 °C/decade
Rain: +0.35 mm/decade
50-Year Trend
High: +0.24 °C/decade
Low: +0.12 °C/decade
Rain: +0.14 mm/decade
All-Time Trend
High: +0.24 °C/decade
Low: +0.12 °C/decade
Rain: +0.14 mm/decade
Percentage Above-Average Days
Last 12 Months: 49.0%
This Year: 63.2%
Precipitation Concentration Index (PCI) ℹ️
Last 12 Months: 32.0
Historical Average: 28.2
Percentile Rank of Last 12 Months ℹ️
High: 41st percentile
Low: 54th percentile
Rain: 43rd percentile
Change in Variance ℹ️
High: +5.9%
Low: +7.3%
Intraday: +2.1%
Data Coverage
79.0%
First Year of Data
1961
Station Location
Historical Weather Records
| Max High | Avg High | Min High | Max Avg | Avg Avg | Min Avg | Max Low | Avg Low | Min Low | Max Precipitation | Avg Precipitation | Max Snow | Avg Snow | |
|---|---|---|---|---|---|---|---|---|---|---|---|---|---|
| Record | 48.3 °C | — | 18.9 °C | 40.8 °C | — | 11.3 °C | 35.3 °C | — | 1.5 °C | 239.5 mm | — | — | — |
| January | 41.0 °C | 31.7 °C | 18.9 °C | 34.4 °C | 23.5 °C | 14.8 °C | 27.0 °C | 15.0 °C | 1.5 °C | 3.2 mm | 0.0 mm | — | — |
| February | 43.5 °C | 34.8 °C | 20.9 °C | 38.1 °C | 26.4 °C | 16.7 °C | 30.0 °C | 17.5 °C | 9.0 °C | 2.9 mm | 0.0 mm | — | — |
| March | 47.4 °C | 38.1 °C | 27.4 °C | 39.2 °C | 29.8 °C | 19.3 °C | 32.4 °C | 20.8 °C | 9.0 °C | 22.1 mm | 0.0 mm | — | — |
| April | 48.3 °C | 40.9 °C | 29.0 °C | 40.0 °C | 33.3 °C | 22.0 °C | 34.0 °C | 24.9 °C | 14.0 °C | 38.5 mm | 0.1 mm | — | — |
| May | 46.5 °C | 41.8 °C | 28.9 °C | 40.8 °C | 35.2 °C | 26.8 °C | 35.0 °C | 28.1 °C | 18.2 °C | 42.9 mm | 0.5 mm | — | — |
| June | 47.3 °C | 40.0 °C | 28.9 °C | 40.7 °C | 33.9 °C | 23.9 °C | 35.3 °C | 27.8 °C | 17.0 °C | 239.5 mm | 2.3 mm | — | — |
| July | 44.0 °C | 35.3 °C | 26.6 °C | 38.5 °C | 30.2 °C | 23.6 °C | 31.8 °C | 25.2 °C | 15.0 °C | 126.0 mm | 5.0 mm | — | — |
| August | 44.7 °C | 32.8 °C | 23.9 °C | 34.4 °C | 28.3 °C | 22.1 °C | 30.0 °C | 23.9 °C | 14.5 °C | 147.1 mm | 6.7 mm | — | — |
| September | 42.6 °C | 34.1 °C | 25.0 °C | 35.4 °C | 28.9 °C | 22.4 °C | 29.2 °C | 23.7 °C | 15.8 °C | 112.0 mm | 4.1 mm | — | — |
| October | 42.7 °C | 37.1 °C | 26.8 °C | 36.8 °C | 30.3 °C | 23.2 °C | 30.2 °C | 23.1 °C | 13.9 °C | 41.9 mm | 0.9 mm | — | — |
| November | 41.2 °C | 35.9 °C | 26.2 °C | 36.8 °C | 27.9 °C | 19.0 °C | 28.4 °C | 19.2 °C | 10.0 °C | 220.0 mm | 0.2 mm | — | — |
| December | 40.4 °C | 32.2 °C | 21.0 °C | 33.8 °C | 24.1 °C | 11.3 °C | 25.0 °C | 15.7 °C | 6.0 °C | 50.0 mm | 0.1 mm | — | — |
Data Visualisations
Remove WatermarksCurrent Year Climate Trends vs Historical


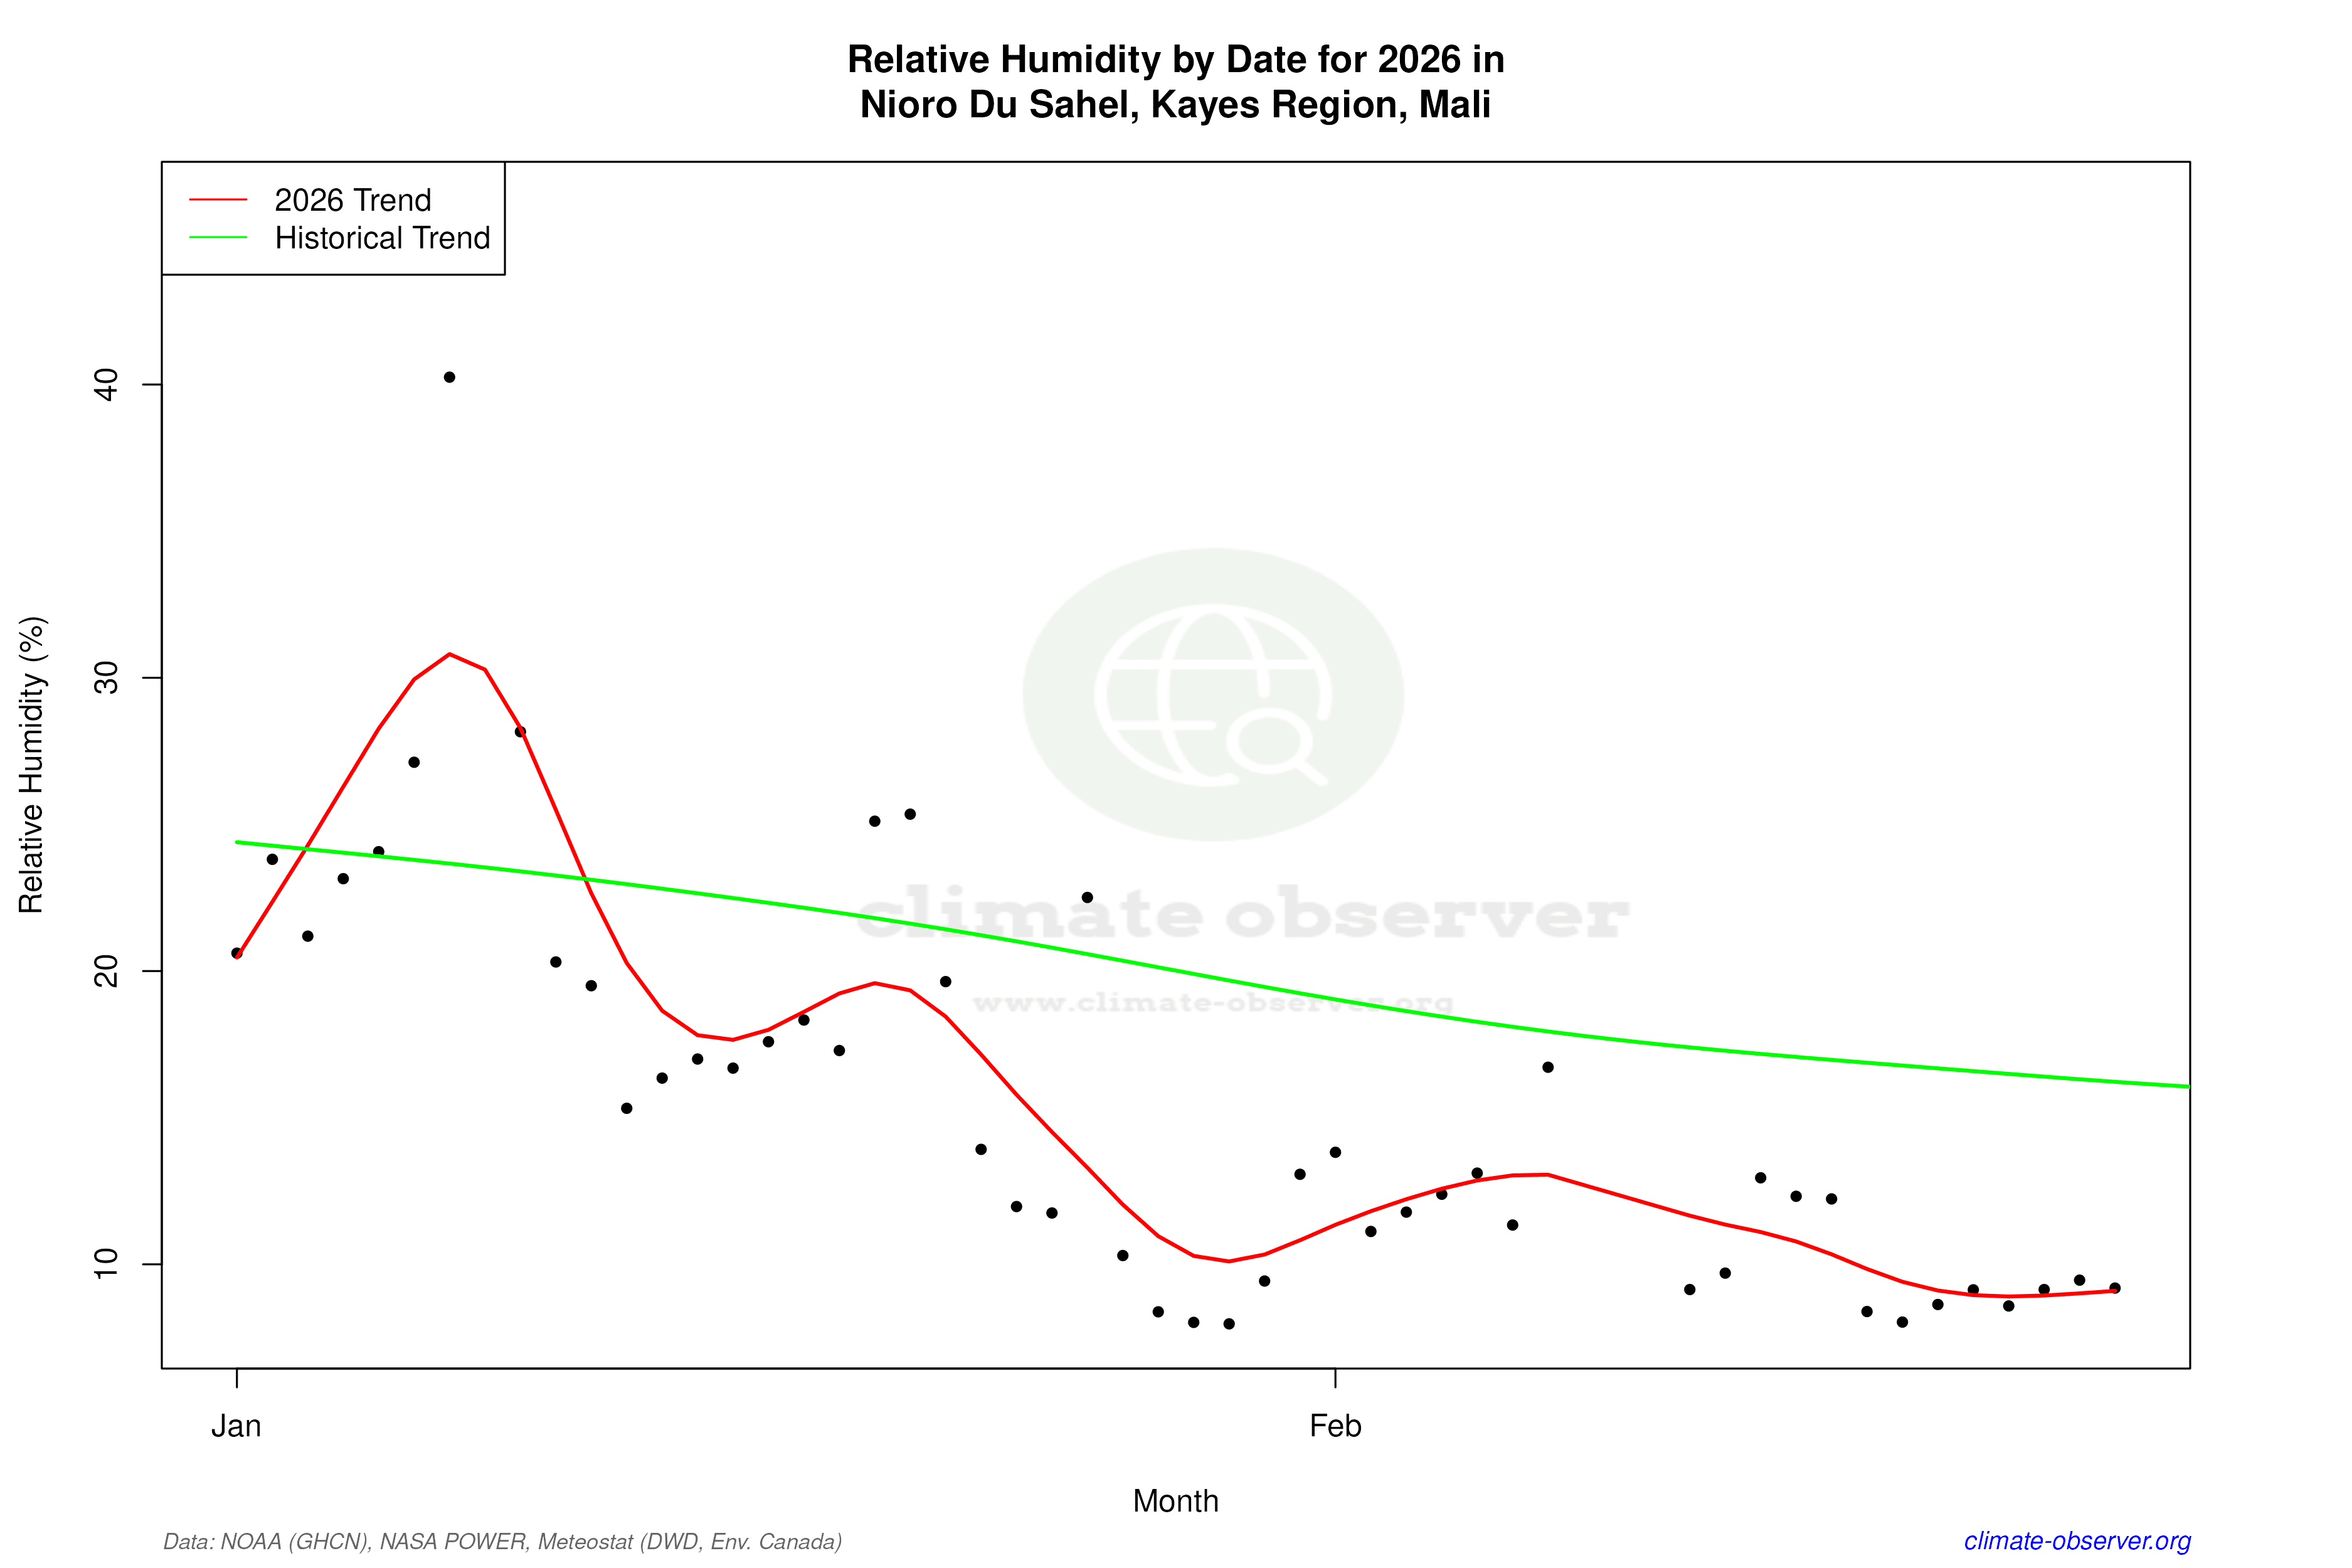

Max Temperature this Year | 1 of 6
Climate 12-Month Moving Averages


Max Temperature 12-Month MA | 1 of 6
Daily Data Points and Averages Throughout the Year


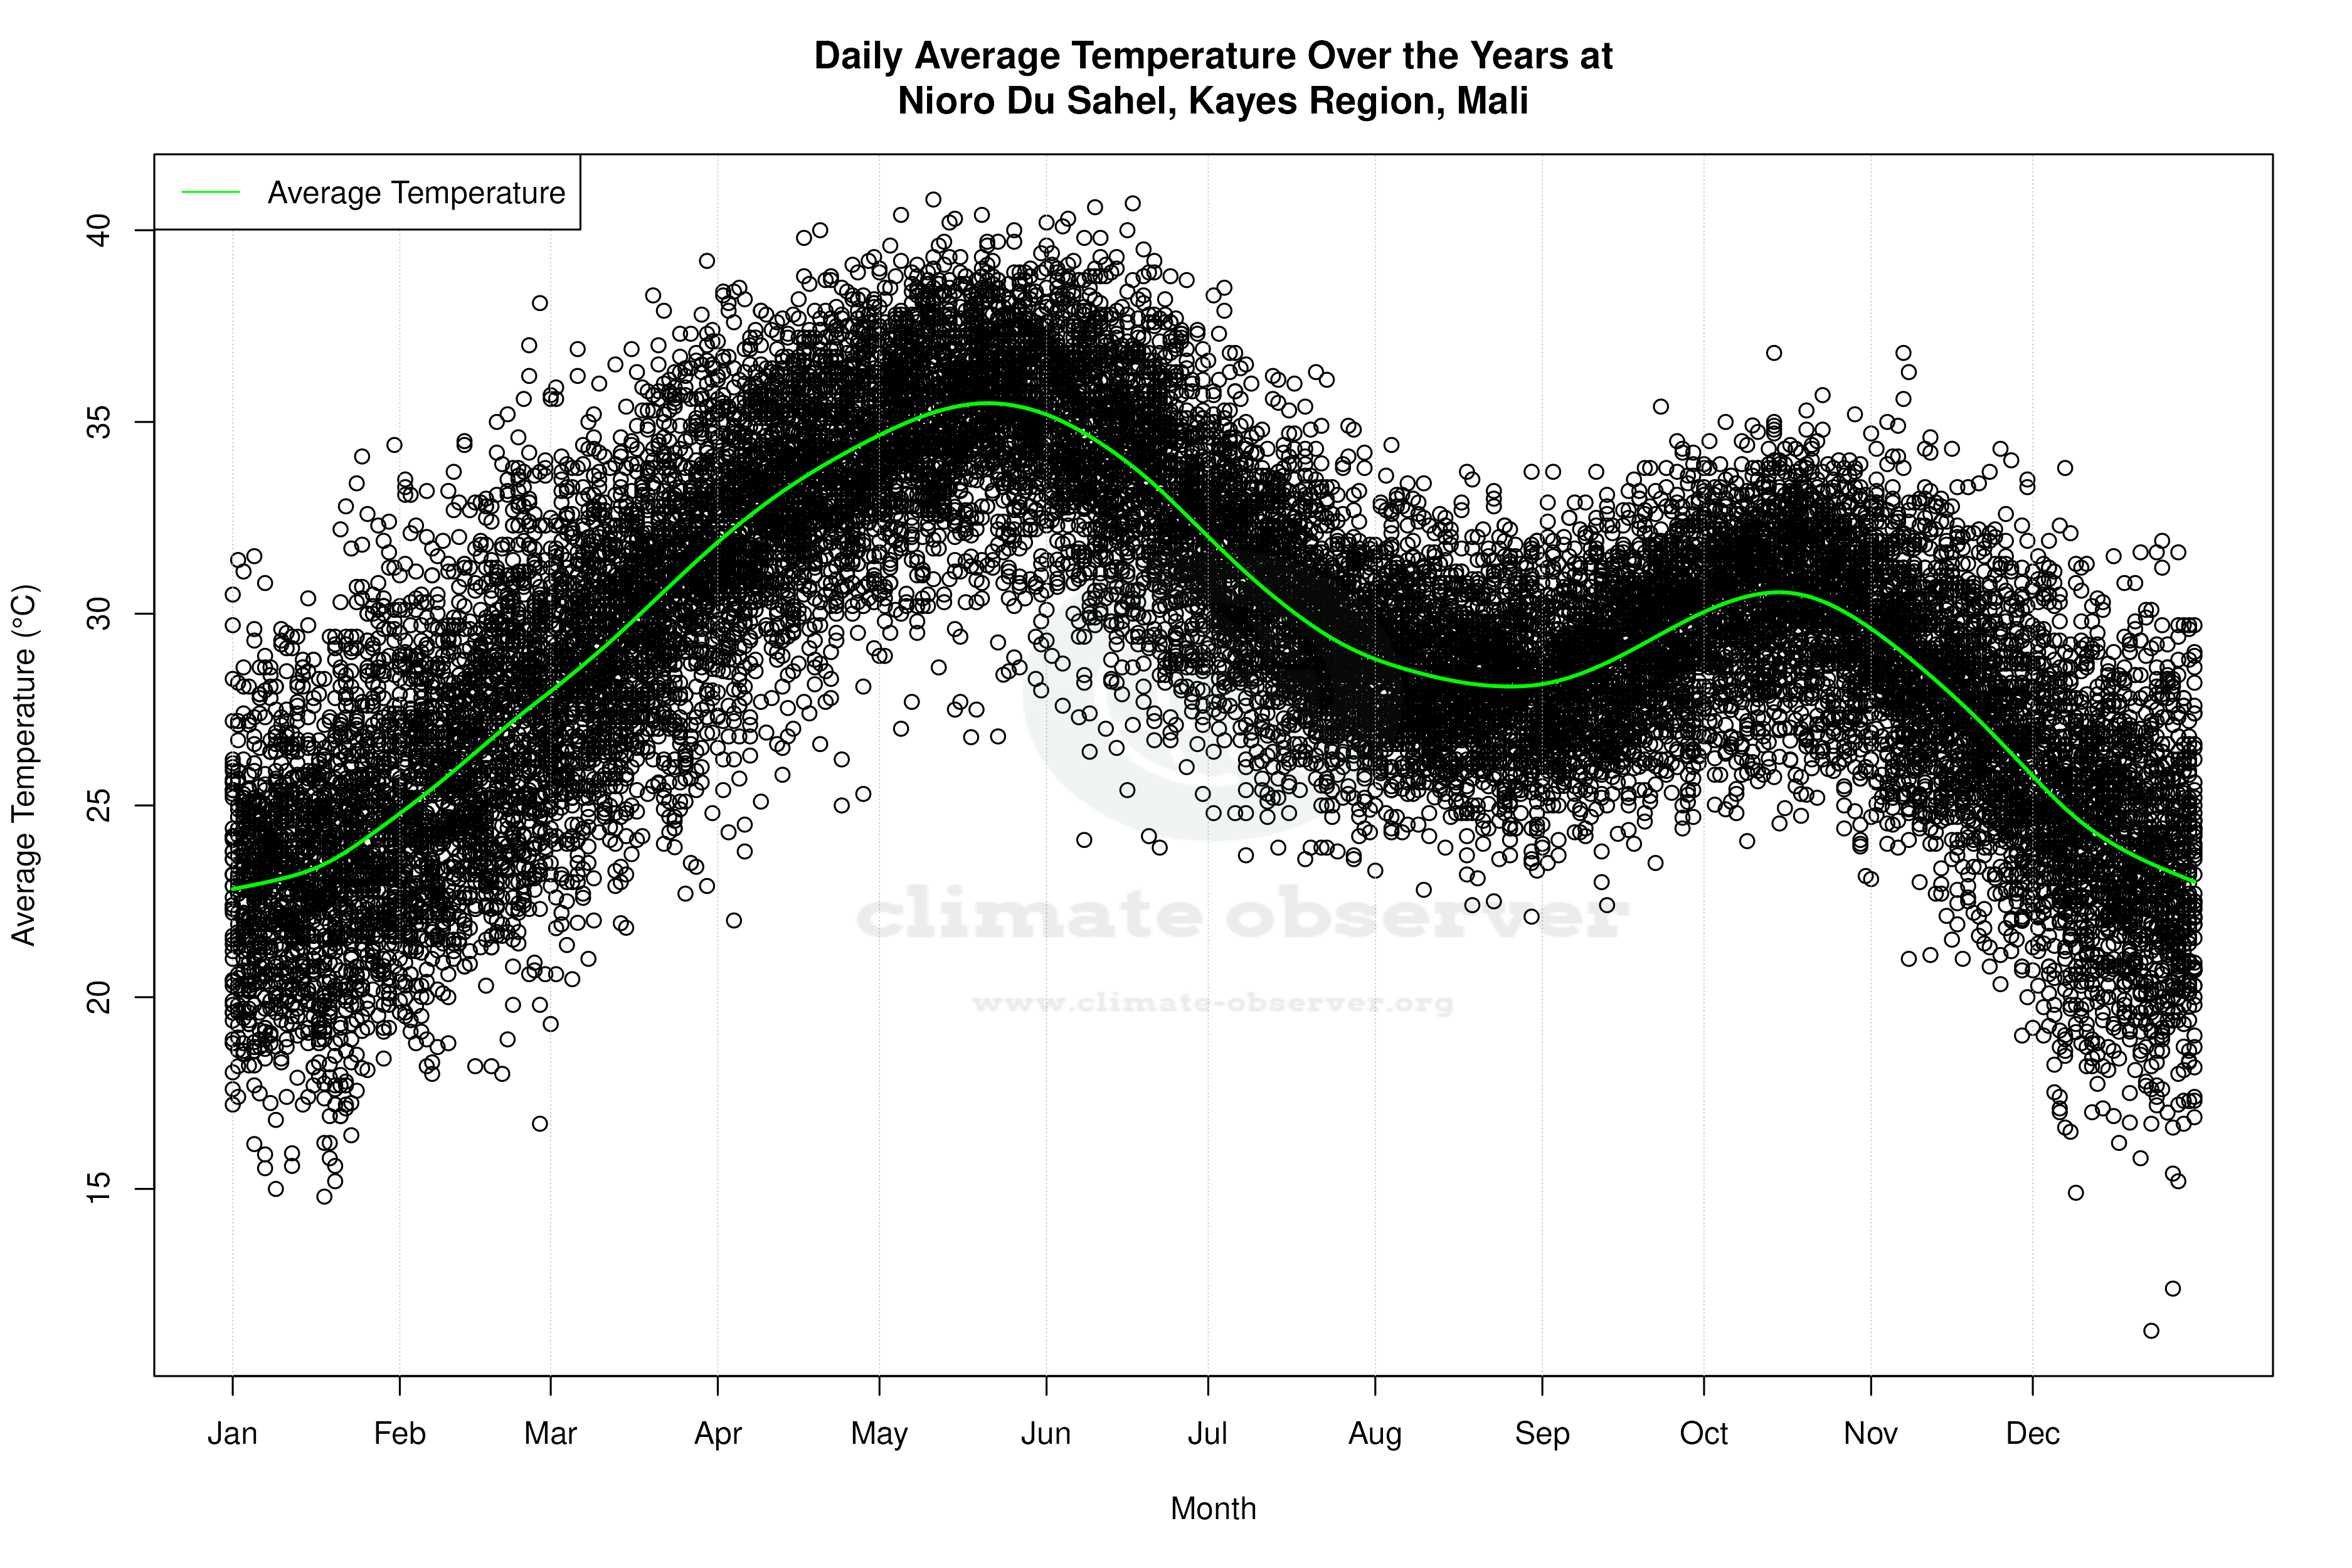


Average Max Temperature Throughout Year | 1 of 5
