Climate for Station: Oujda, Oriental, Morocco
Loading live weather...
Climate Analysis & Overview
Oujda, situated in Morocco's Oriental region, is experiencing a warming trend with significant increases in both high and low temperatures over the past decade. The precipitation pattern has become more evenly distributed, indicating a shift in rainfall dynamics. These changes are crucial for understanding regional climate adaptation strategies.
Warming Trends in Oujda
Oujda, located at latitude 34.78°N and longitude -1.93°E, experiences a semi-arid climate under the Köppen classification. The city is witnessing a notable warming trend, particularly over the past decade. The 10-year data reveals a rise in high temperatures by 1.29°C (2.32°F) and low temperatures by 1.81°C (3.26°F). These figures are significantly higher than the all-time trends, which show a rise of 0.25°C (0.45°F) for highs and 0.15°C (0.27°F) for lows. This discrepancy highlights a recent acceleration in warming, which could have implications for local agriculture and water resources.
Temperature Extremes
Oujda's temperature extremes are marked by a record high of 47.3°C (117.1°F) and a record low of -7.1°C (19.2°F). These extremes underscore the city's climate variability, influenced by its proximity to the Atlas Mountains and the Mediterranean Sea. The mountains can lead to cooler temperatures, while the sea moderates the climate, preventing it from becoming excessively hot or cold.
Precipitation Patterns
The Precipitation Concentration Index (PCI) for Oujda has decreased from a baseline of 15.6 to a current value of 13.1. This indicates that rainfall is now more evenly distributed throughout the year, rather than being concentrated in a few heavy events. Such a shift can be beneficial for agriculture, reducing the risk of flood damage and improving water availability for crops. However, it also requires adjustments in water management practices to optimise resource use.
Regional Climate Context
Oujda's climate trends are part of broader regional changes in Morocco, which is actively pursuing climate adaptation strategies. The country's goals include enhancing water resource management and improving agricultural resilience. Understanding local climate dynamics, such as those in Oujda, is essential for aligning with these national objectives. The recent warming and changes in precipitation distribution in Oujda provide critical insights into how local conditions are evolving in response to broader climatic shifts.
Implications for Future Planning
The observed climate trends in Oujda necessitate proactive planning to mitigate potential impacts. The warming trend, particularly the sharp rise in temperatures over the past decade, could exacerbate heat stress on both humans and ecosystems. Meanwhile, the more even distribution of rainfall offers opportunities to improve water management systems. These insights are vital for policymakers and stakeholders as they develop strategies to enhance the region's climate resilience.
Station Statistics
10-Year Trend
High: +1.22 °C/decade
Low: +2.21 °C/decade
Rain: -0.52 mm/decade
25-Year Trend
High: +0.63 °C/decade
Low: +0.56 °C/decade
Rain: -0.11 mm/decade
50-Year Trend
High: +0.64 °C/decade
Low: +0.43 °C/decade
Rain: -0.01 mm/decade
All-Time Trend
High: +0.25 °C/decade
Low: +0.16 °C/decade
Rain: -0.01 mm/decade
Percentage Above-Average Days
Last 12 Months: 52.1%
This Year: 51.3%
Precipitation Concentration Index (PCI) ℹ️
Last 12 Months: 15.0
Historical Average: 17.3
Percentile Rank of Last 12 Months ℹ️
High: 93rd percentile
Low: 99th percentile
Rain: 50th percentile
Change in Variance ℹ️
High: +0.5%
Low: +8.7%
Intraday: -9.3%
Data Coverage
65.7%
First Year of Data
1910
Station Location
Historical Weather Records
| Max High | Avg High | Min High | Max Avg | Avg Avg | Min Avg | Max Low | Avg Low | Min Low | Max Precipitation | Avg Precipitation | Max Snow | Avg Snow | |
|---|---|---|---|---|---|---|---|---|---|---|---|---|---|
| Record | 47.3 °C | — | -1.0 °C | 35.8 °C | — | -0.3 °C | 29.0 °C | — | -7.1 °C | 123.0 mm | — | — | — |
| January | 28.0 °C | 15.8 °C | -1.0 °C | 18.8 °C | 9.7 °C | -0.3 °C | 16.0 °C | 4.1 °C | -7.1 °C | 62.0 mm | 1.1 mm | — | — |
| February | 33.1 °C | 17.4 °C | 3.0 °C | 21.0 °C | 10.9 °C | 1.0 °C | 17.0 °C | 5.2 °C | -4.0 °C | 64.0 mm | 1.0 mm | — | — |
| March | 35.4 °C | 19.3 °C | 5.0 °C | 24.5 °C | 12.7 °C | 2.5 °C | 19.0 °C | 6.5 °C | -5.0 °C | 55.1 mm | 1.3 mm | — | — |
| April | 39.5 °C | 21.5 °C | 8.0 °C | 27.8 °C | 14.6 °C | 6.4 °C | 20.8 °C | 8.2 °C | -2.4 °C | 45.0 mm | 1.2 mm | — | — |
| May | 41.6 °C | 25.3 °C | 12.0 °C | 31.0 °C | 17.9 °C | 9.4 °C | 24.0 °C | 11.3 °C | 1.0 °C | 123.0 mm | 1.0 mm | — | — |
| June | 44.0 °C | 29.5 °C | 17.0 °C | 34.2 °C | 22.0 °C | 13.5 °C | 26.0 °C | 14.9 °C | 4.0 °C | 62.8 mm | 0.3 mm | — | — |
| July | 47.3 °C | 33.8 °C | 18.0 °C | 35.1 °C | 25.5 °C | 17.8 °C | 29.0 °C | 17.9 °C | 9.0 °C | 21.0 mm | 0.1 mm | — | — |
| August | 46.7 °C | 34.3 °C | 21.5 °C | 35.8 °C | 25.9 °C | 17.4 °C | 28.5 °C | 18.5 °C | 7.0 °C | 38.9 mm | 0.1 mm | — | — |
| September | 42.8 °C | 30.1 °C | 17.0 °C | 32.6 °C | 22.4 °C | 13.9 °C | 26.0 °C | 15.8 °C | 2.0 °C | 43.2 mm | 0.5 mm | — | — |
| October | 39.4 °C | 25.5 °C | 11.0 °C | 28.9 °C | 18.3 °C | 8.8 °C | 22.8 °C | 12.3 °C | 1.0 °C | 48.0 mm | 0.8 mm | — | — |
| November | 32.6 °C | 20.0 °C | 7.0 °C | 26.2 °C | 13.7 °C | 5.3 °C | 22.0 °C | 8.2 °C | -1.5 °C | 104.2 mm | 1.1 mm | — | — |
| December | 31.0 °C | 16.8 °C | 2.6 °C | 22.5 °C | 10.8 °C | 0.2 °C | 18.0 °C | 5.5 °C | -6.0 °C | 89.9 mm | 1.1 mm | — | — |
Data Visualisations
Remove WatermarksCurrent Year Climate Trends vs Historical


Max Temperature this Year | 1 of 6
Climate 12-Month Moving Averages


Max Temperature 12-Month MA | 1 of 6
Daily Data Points and Averages Throughout the Year


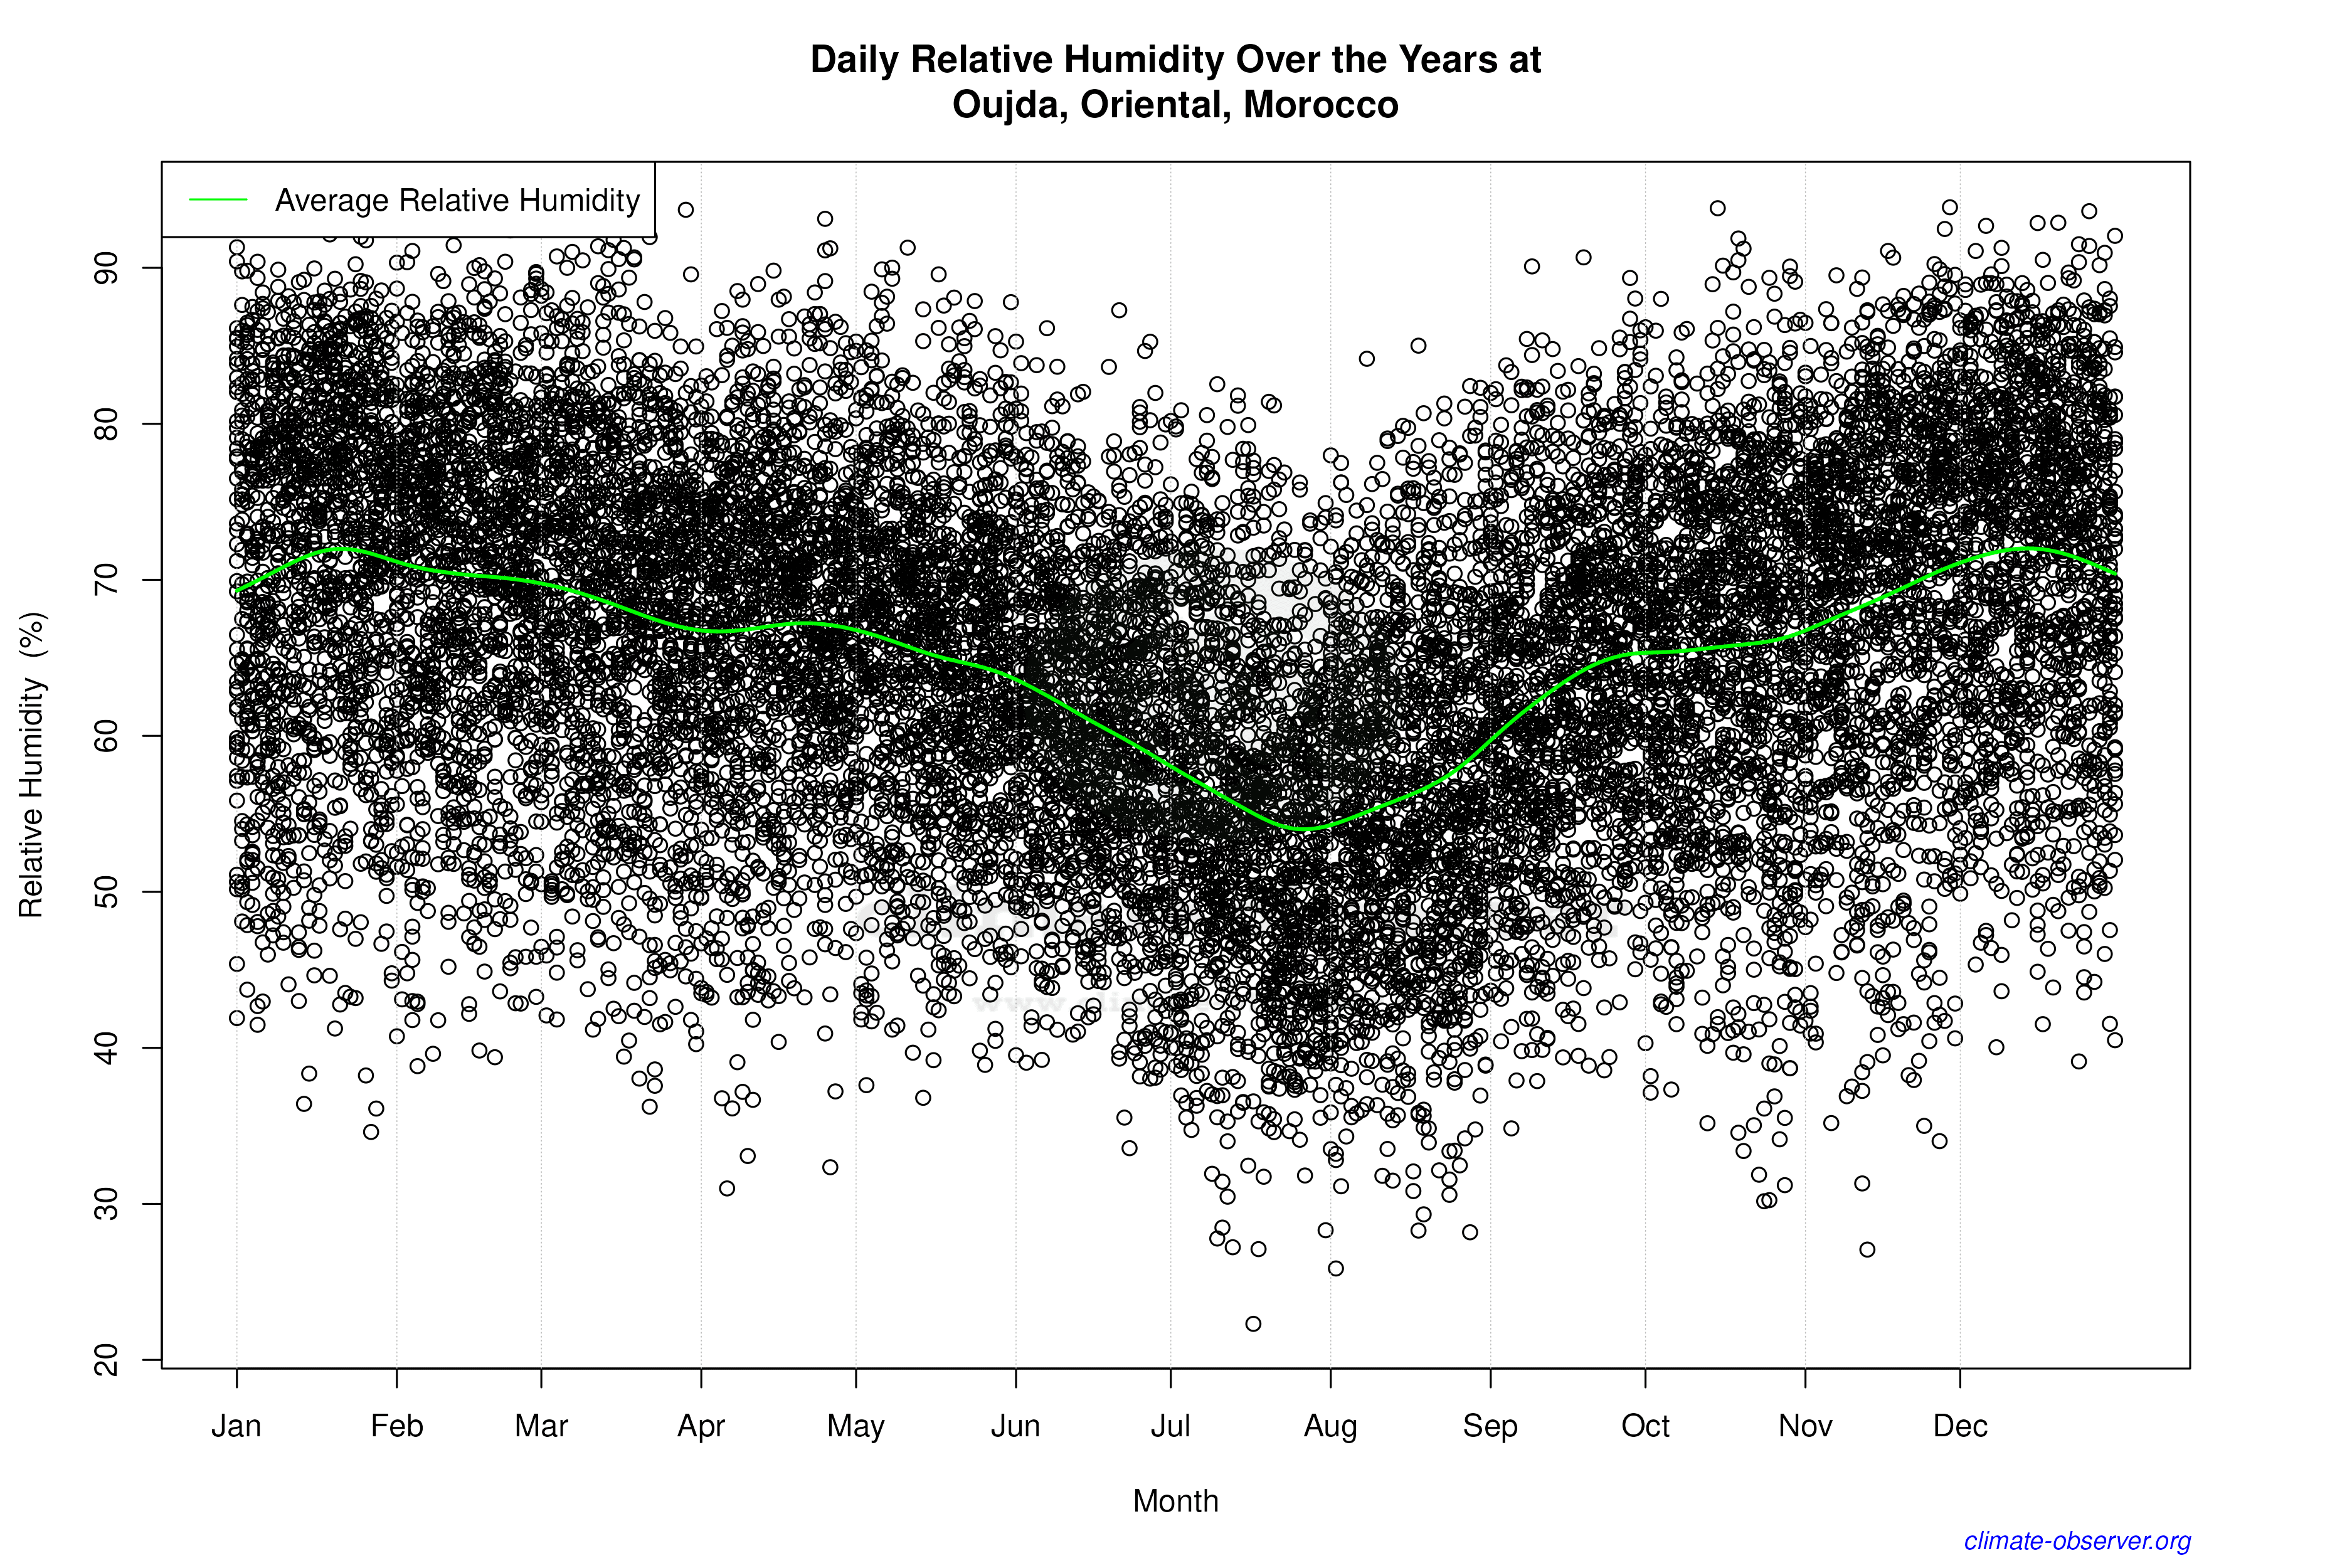

Average Max Temperature Throughout Year | 1 of 5
