Climate for Station: Sale, Rabat-Sale-Kenitra, Morocco
Loading live weather...
Climate Analysis & Overview
Sale, Morocco, is experiencing a subtle climate shift with a general warming trend, though recent years have seen a slight cooling in low temperatures. The region's precipitation is becoming more evenly distributed, suggesting a shift in rainfall patterns. This nuanced climate profile is critical for understanding local impacts in the context of Morocco's climate goals.
Warming Trends and Cooling Contrasts
Sale, located in Morocco's coastal region, exhibits a complex climate profile influenced by the Atlantic Ocean's moderating effects. The all-time temperature trends indicate a warming with highs increasing by 0.11°C (0.20°F). However, the lows show a cooling trend of 0.02°C (0.04°F). This duality highlights the intricate balance of Sale's climate dynamics, where the broader warming is tempered by cooler nights. Over the past decade, this pattern is accentuated with highs rising by 0.76°C (1.37°F), while lows have cooled by 0.06°C (0.11°F), suggesting a more pronounced diurnal temperature range in recent years.
Extreme Temperature Records
Sale's climate is marked by notable temperature extremes, indicative of its Mediterranean climate classification. The record high temperature reached 42.81°C (109.06°F), while the record low plummeted to -3.2°C (26.24°F). These extremes are shaped by the region's geographical positioning and the influence of seasonal weather patterns. The high temperatures are often driven by Saharan air incursions, while the lows are moderated by the proximity to the ocean.
Evolving Precipitation Patterns
The Precipitation Concentration Index (PCI) offers insights into the distribution of rainfall events. Sale's PCI has decreased from a baseline of 19.9 to a current value of 17.3, indicating a more even distribution of rainfall throughout the year. This shift suggests a move away from intense, sporadic rainfall events towards a more consistent pattern, which could have implications for water resource management and agricultural practices in the region.
Regional Climate Context
In the broader context of Morocco's climate strategy, Sale's evolving climate profile aligns with national efforts to adapt to climate variability. The country's initiatives focus on enhancing water security and sustainable agriculture, both of which are influenced by the changes in temperature and precipitation patterns observed in Sale. Understanding these localised climate dynamics is crucial for implementing effective adaptation measures.
Geographical Influences on Climate
Sale's climate is heavily influenced by its geographical features. Situated near the Atlantic Ocean, the city experiences moderate temperatures with a distinct maritime influence. This geographical setting contributes to the observed temperature trends and precipitation patterns, as the ocean acts as a thermal buffer, reducing the extremities of temperature fluctuations and supporting a more stable climate regime.
Station Statistics
10-Year Trend
High: +0.78 °C/decade
Low: +0.37 °C/decade
Rain: -0.89 mm/decade
25-Year Trend
High: +0.17 °C/decade
Low: -0.14 °C/decade
Rain: -0.06 mm/decade
50-Year Trend
High: +0.22 °C/decade
Low: -0.16 °C/decade
Rain: +0.08 mm/decade
All-Time Trend
High: +0.10 °C/decade
Low: -0.03 °C/decade
Rain: +0.02 mm/decade
Percentage Above-Average Days
Last 12 Months: 51.8%
This Year: 52.4%
Precipitation Concentration Index (PCI) ℹ️
Last 12 Months: 22.7
Historical Average: 20.5
Percentile Rank of Last 12 Months ℹ️
High: 83rd percentile
Low: 56th percentile
Rain: 78th percentile
Change in Variance ℹ️
High: -1.1%
Low: +13.6%
Intraday: +16.1%
Data Coverage
87.5%
First Year of Data
1943
Station Location
Historical Weather Records
| Max High | Avg High | Min High | Max Avg | Avg Avg | Min Avg | Max Low | Avg Low | Min Low | Max Precipitation | Avg Precipitation | Max Snow | Avg Snow | |
|---|---|---|---|---|---|---|---|---|---|---|---|---|---|
| Record | 42.8 °C | — | 7.8 °C | 34.7 °C | — | 2.9 °C | 28.4 °C | — | -3.2 °C | 150.1 mm | — | — | — |
| January | 27.1 °C | 17.3 °C | 8.2 °C | 21.7 °C | 12.0 °C | 2.9 °C | 18.0 °C | 7.8 °C | -3.2 °C | 150.1 mm | 2.8 mm | — | — |
| February | 31.1 °C | 18.1 °C | 7.8 °C | 21.4 °C | 13.0 °C | 4.3 °C | 17.2 °C | 8.4 °C | -2.6 °C | 72.4 mm | 2.3 mm | — | — |
| March | 33.5 °C | 19.9 °C | 11.4 °C | 23.3 °C | 14.4 °C | 8.2 °C | 19.0 °C | 9.7 °C | -0.4 °C | 67.6 mm | 2.0 mm | — | — |
| April | 34.0 °C | 21.0 °C | 12.0 °C | 25.1 °C | 15.9 °C | 9.8 °C | 19.4 °C | 11.1 °C | 2.0 °C | 58.4 mm | 1.6 mm | — | — |
| May | 38.3 °C | 22.9 °C | 14.0 °C | 28.8 °C | 18.2 °C | 12.7 °C | 23.9 °C | 13.4 °C | 5.3 °C | 25.4 mm | 0.7 mm | — | — |
| June | 40.9 °C | 25.0 °C | 19.3 °C | 32.6 °C | 20.6 °C | 15.2 °C | 26.1 °C | 16.3 °C | 8.0 °C | 7.9 mm | 0.1 mm | — | — |
| July | 42.8 °C | 26.9 °C | 21.5 °C | 34.7 °C | 22.5 °C | 17.9 °C | 28.4 °C | 18.2 °C | 11.5 °C | 9.9 mm | 0.0 mm | — | — |
| August | 42.8 °C | 27.4 °C | 22.0 °C | 32.0 °C | 22.9 °C | 17.7 °C | 28.2 °C | 18.5 °C | 9.0 °C | 5.6 mm | 0.0 mm | — | — |
| September | 38.9 °C | 26.3 °C | 20.0 °C | 30.0 °C | 21.5 °C | 15.1 °C | 24.0 °C | 17.1 °C | 7.0 °C | 126.6 mm | 0.3 mm | — | — |
| October | 37.0 °C | 24.5 °C | 15.0 °C | 28.9 °C | 19.1 °C | 12.3 °C | 23.3 °C | 14.7 °C | 5.0 °C | 47.0 mm | 1.4 mm | — | — |
| November | 35.1 °C | 21.1 °C | 11.7 °C | 24.9 °C | 15.5 °C | 8.2 °C | 20.0 °C | 11.2 °C | -0.6 °C | 88.9 mm | 2.9 mm | — | — |
| December | 30.0 °C | 18.3 °C | 7.8 °C | 20.6 °C | 13.2 °C | 5.8 °C | 18.6 °C | 9.1 °C | 0.0 °C | 99.1 mm | 3.1 mm | — | — |
Data Visualisations
Remove WatermarksCurrent Year Climate Trends vs Historical


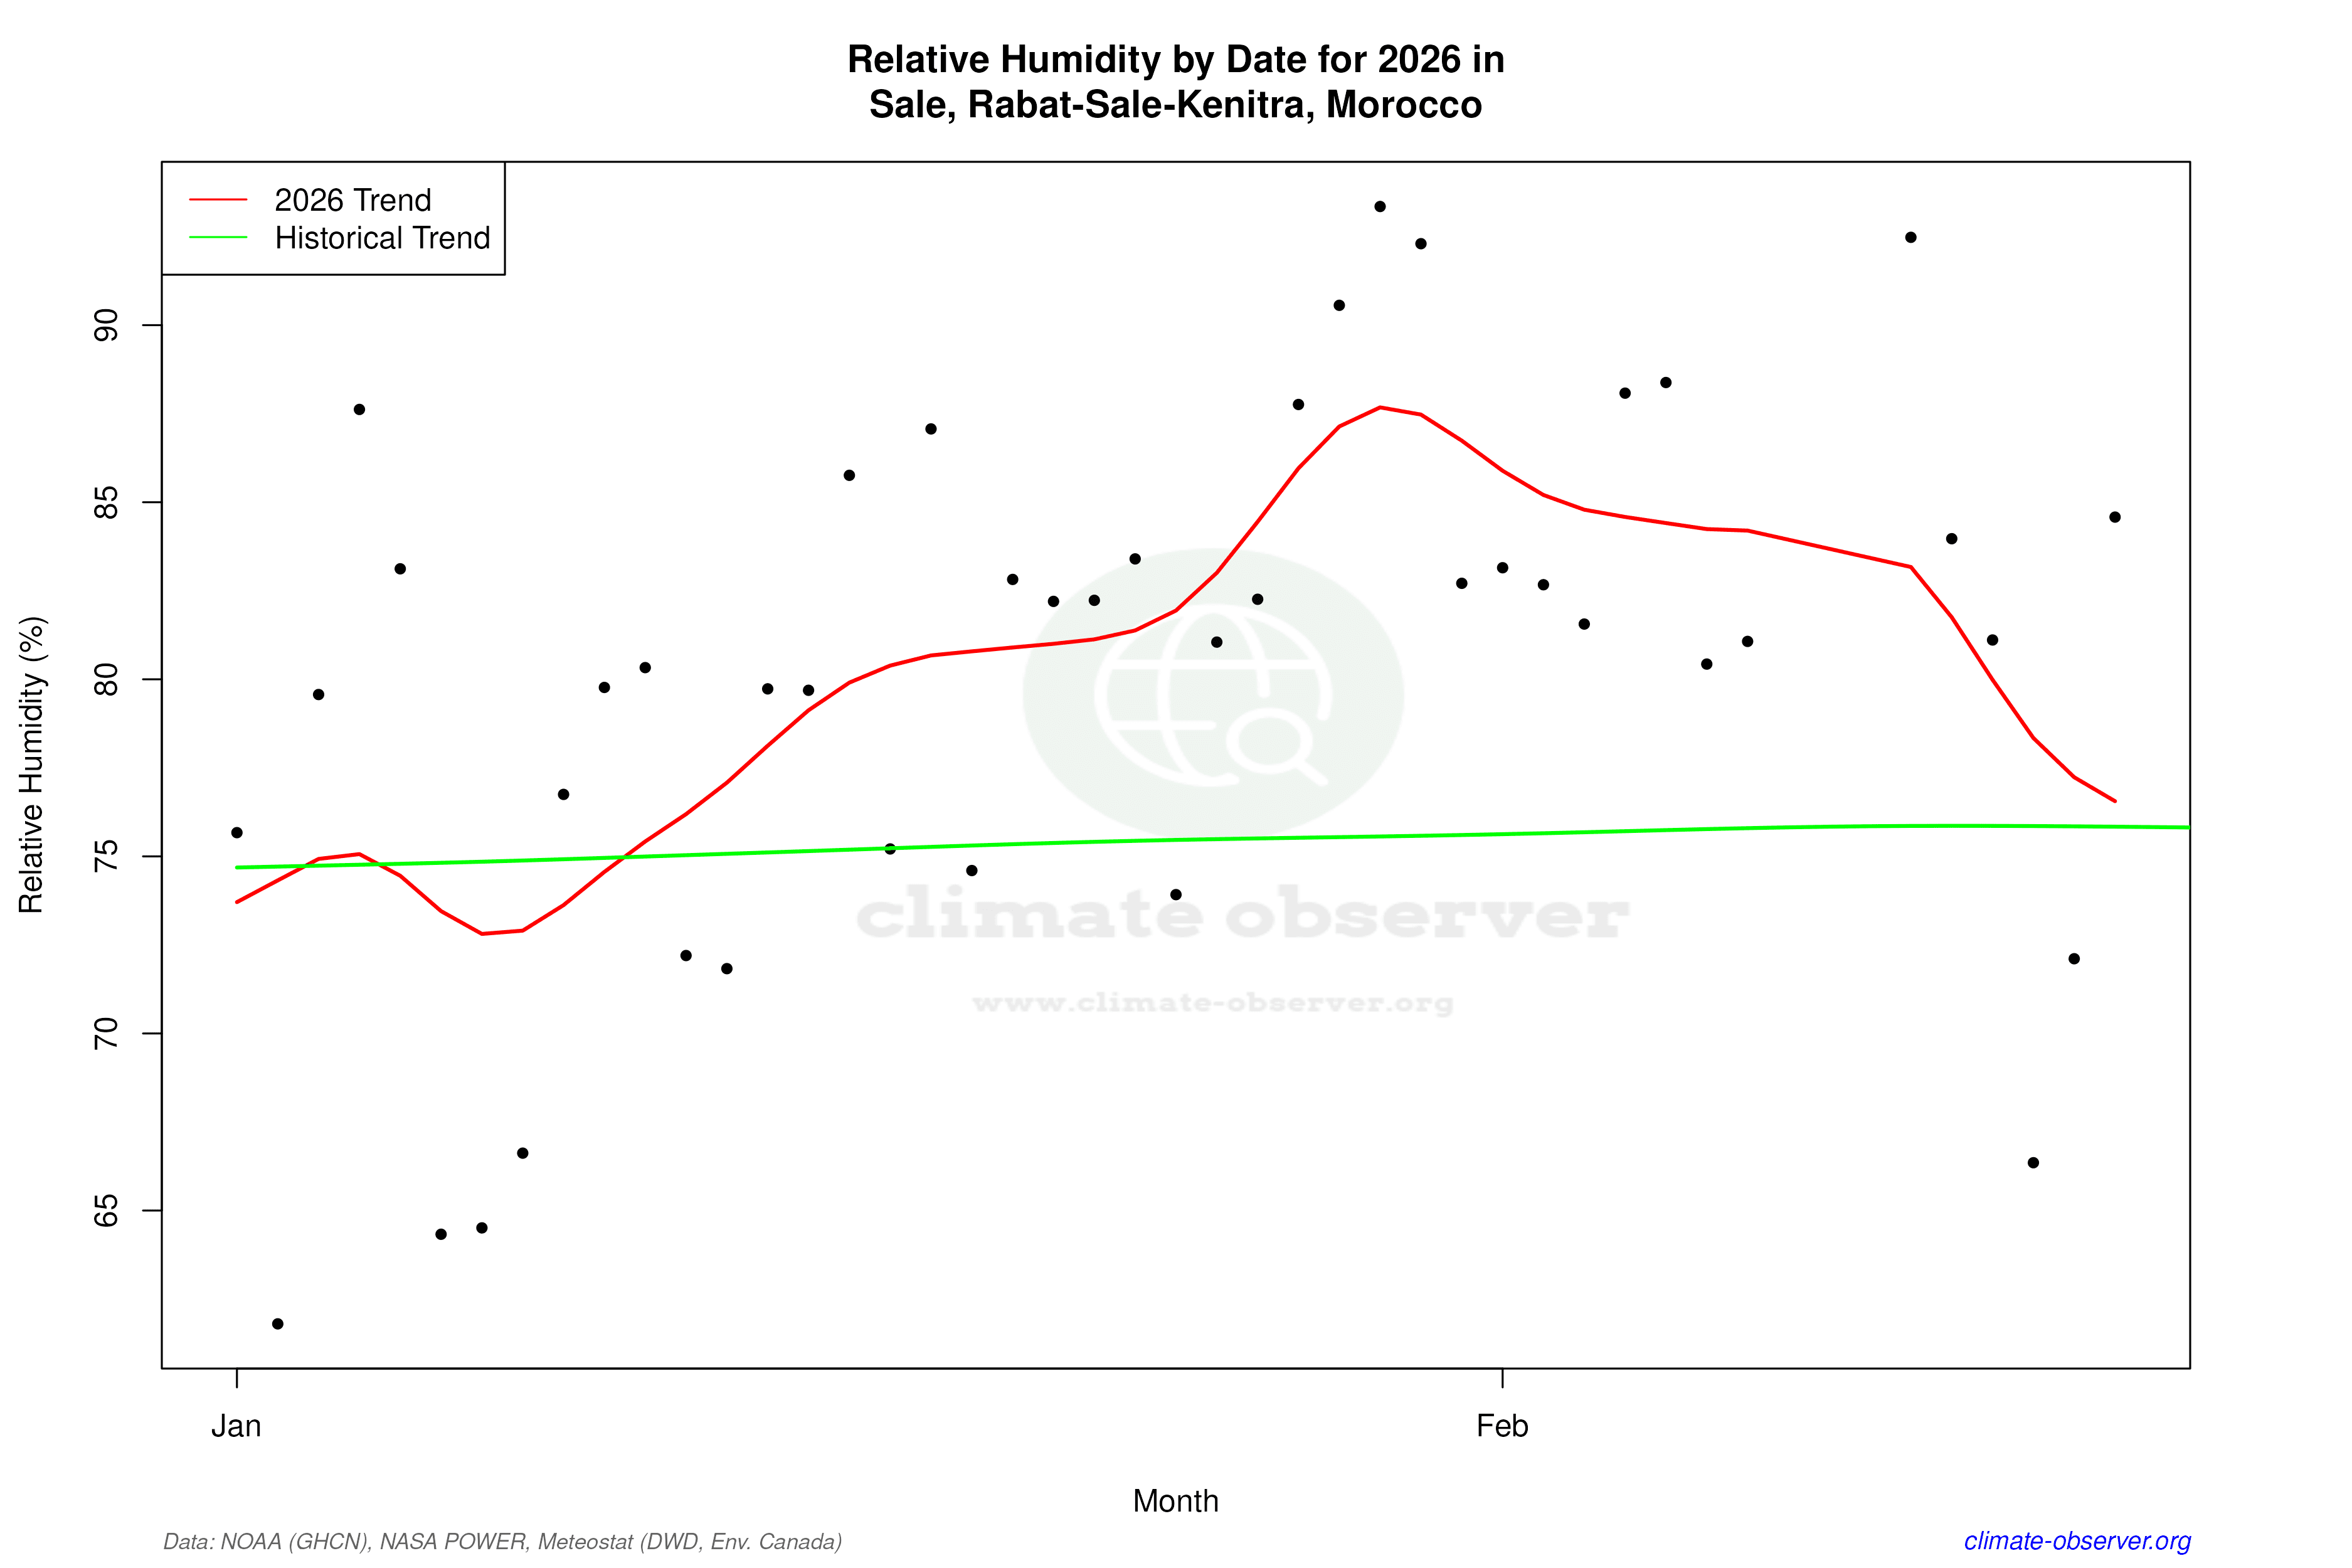

Max Temperature this Year | 1 of 6
Climate 12-Month Moving Averages


Max Temperature 12-Month MA | 1 of 6
Daily Data Points and Averages Throughout the Year


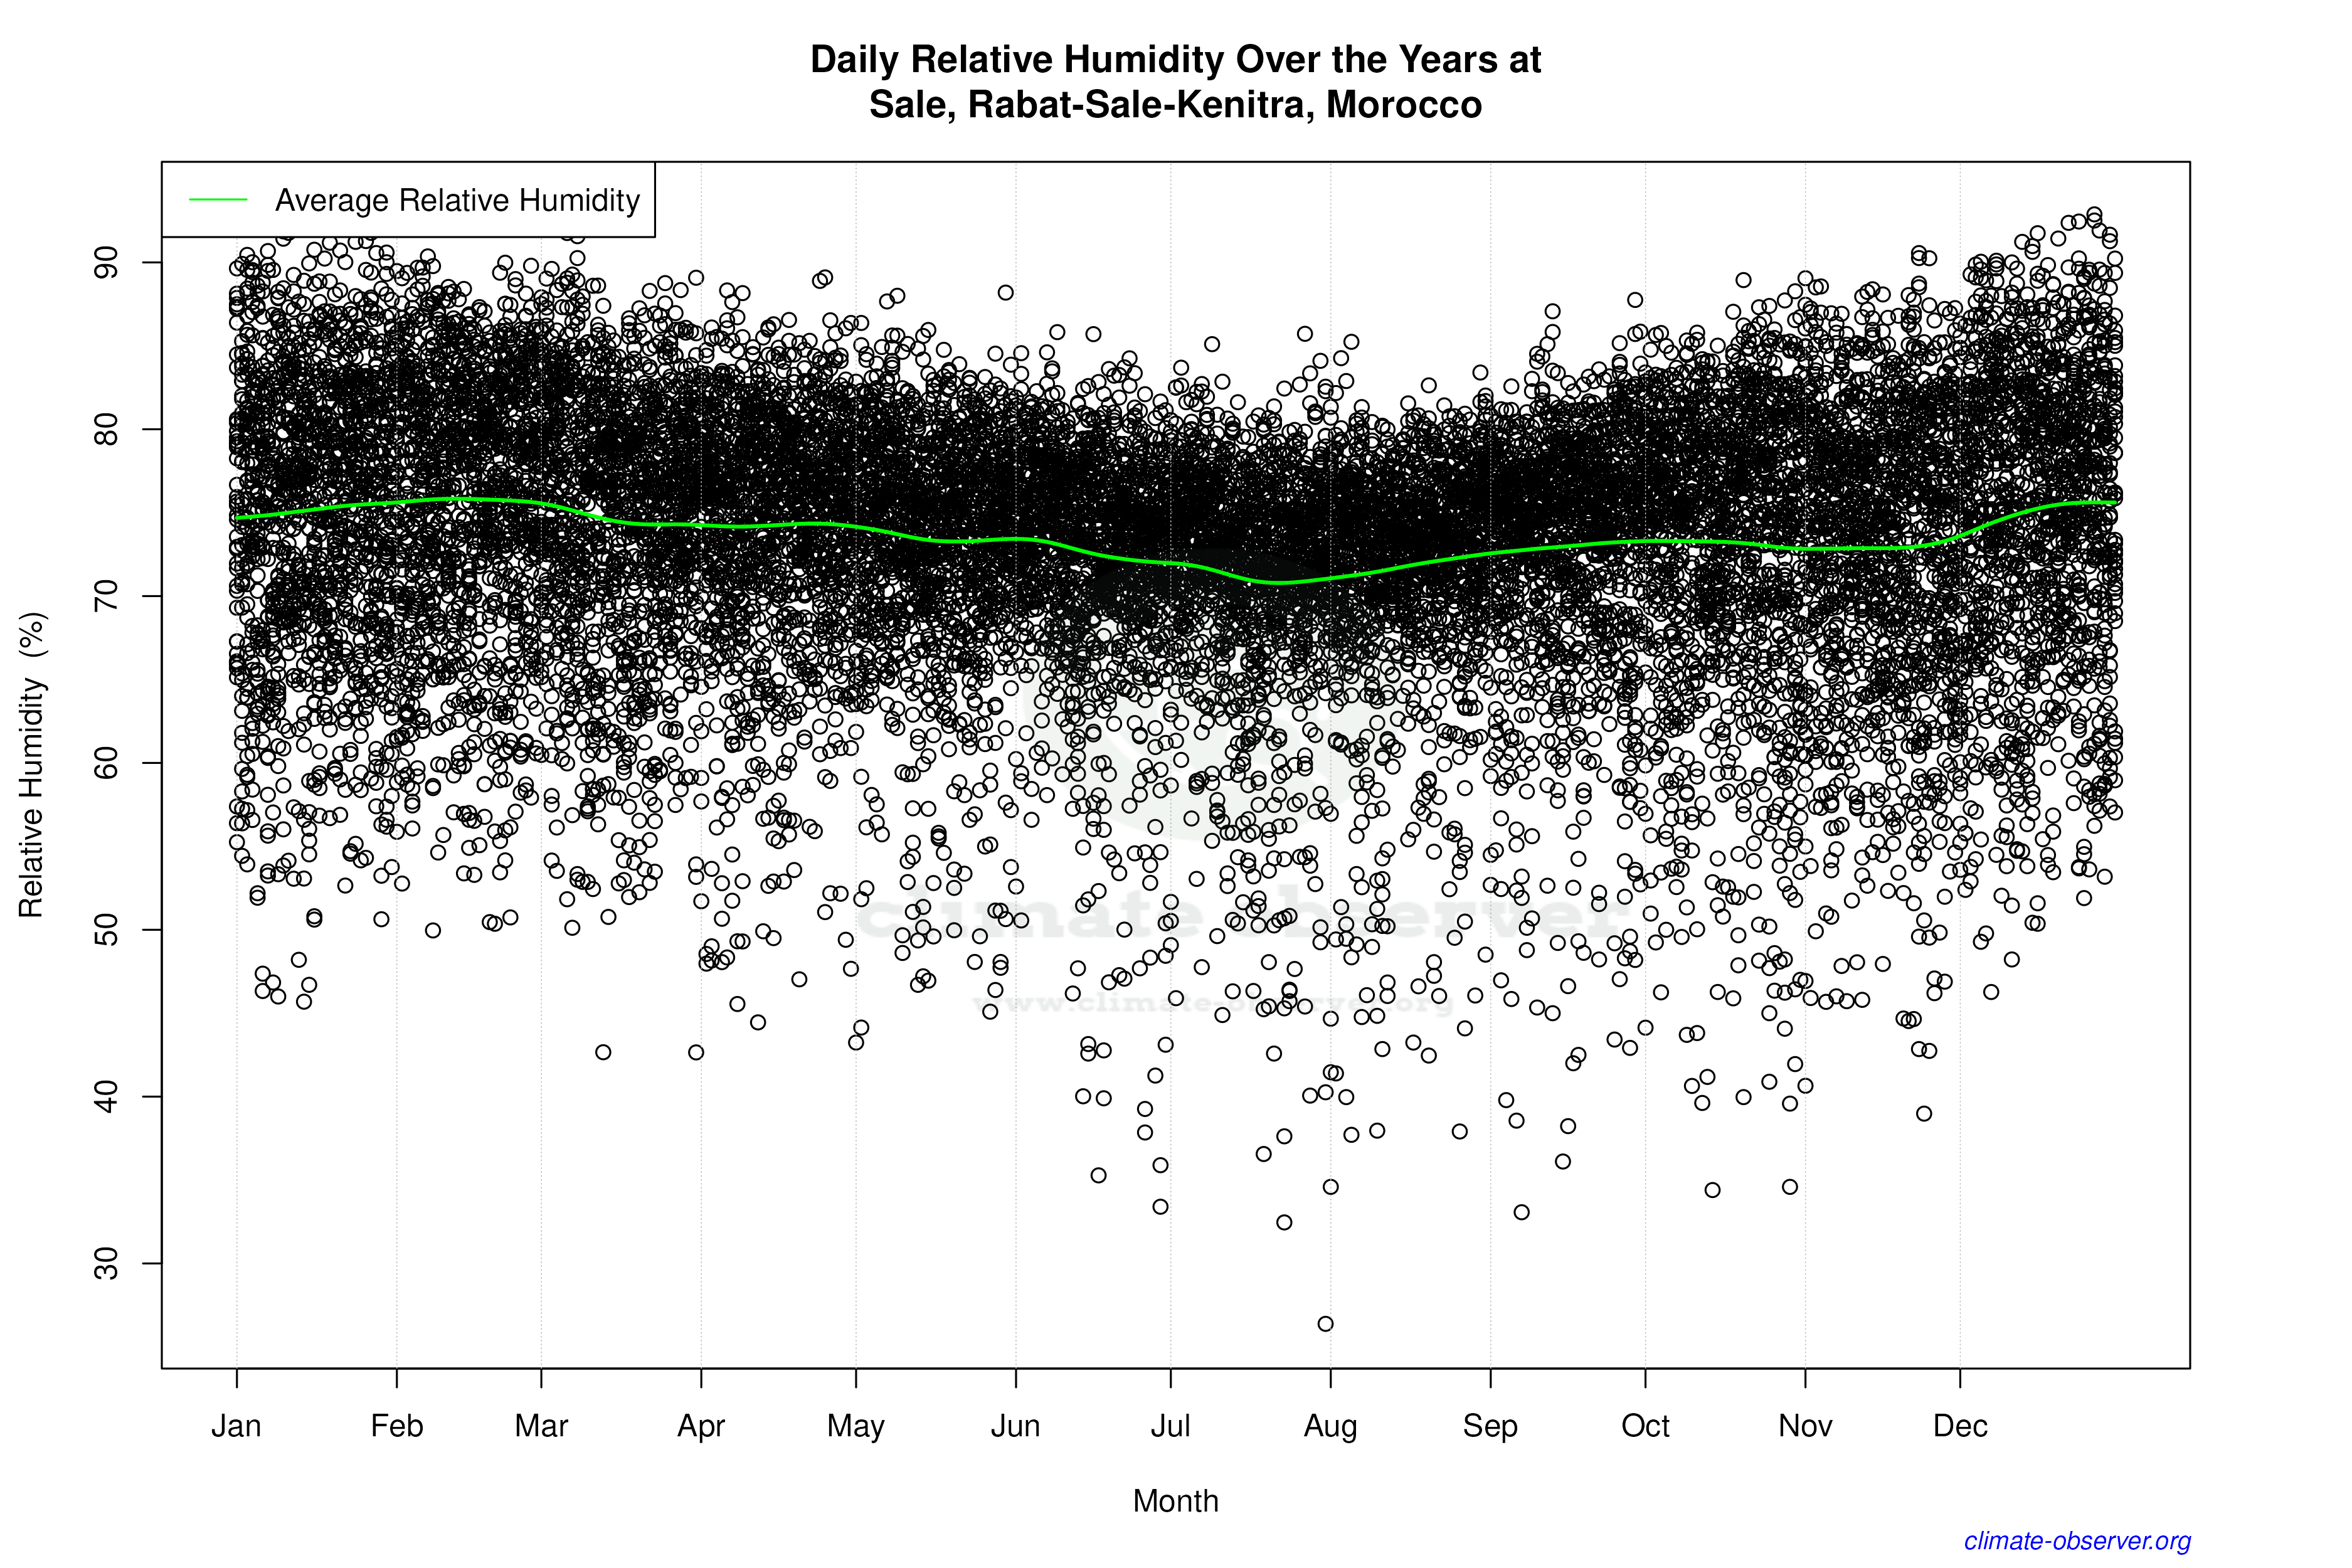

Average Max Temperature Throughout Year | 1 of 5
