Climate for Station: Midway is Henderson Fld Ap, Midway Atoll, Midway Islands [United States}
Loading live weather...
Climate Analysis & Overview
The climate profile for Midway's Henderson Field Airport reveals a nuanced picture of warming trends and evolving precipitation patterns. While long-term data indicates a warming trend, recent years show a more complex interplay of temperature changes. The precipitation has become slightly more evenly distributed, suggesting subtle shifts in weather dynamics.
Subtle Warming Trends
Midway's Henderson Field Airport, located at 28.2°N, -177.3833°W, experiences a tropical savanna climate, classified as 'Aw' under the Köppen system. This classification is characterised by a distinct wet and dry season, with the surrounding Pacific Ocean playing a crucial role in moderating temperatures. Over the all-time record, there is a warming trend in high temperatures of 0.06°C (0.11°F), while low temperatures have increased by 0.23°C (0.41°F). This suggests a general warming pattern, particularly in nighttime temperatures, which can have implications for local biodiversity and energy consumption.
Recent Temperature Variability
In contrast to the long-term warming, the past decade shows a more varied pattern. High temperatures have risen by 0.20°C (0.36°F), indicating a continuation of the warming trend. However, low temperatures have slightly decreased by 0.02°C (0.03°F), a divergence that could be attributed to short-term climatic fluctuations or changes in local atmospheric conditions. This variability highlights the importance of considering both short-term and long-term data in climate assessments.
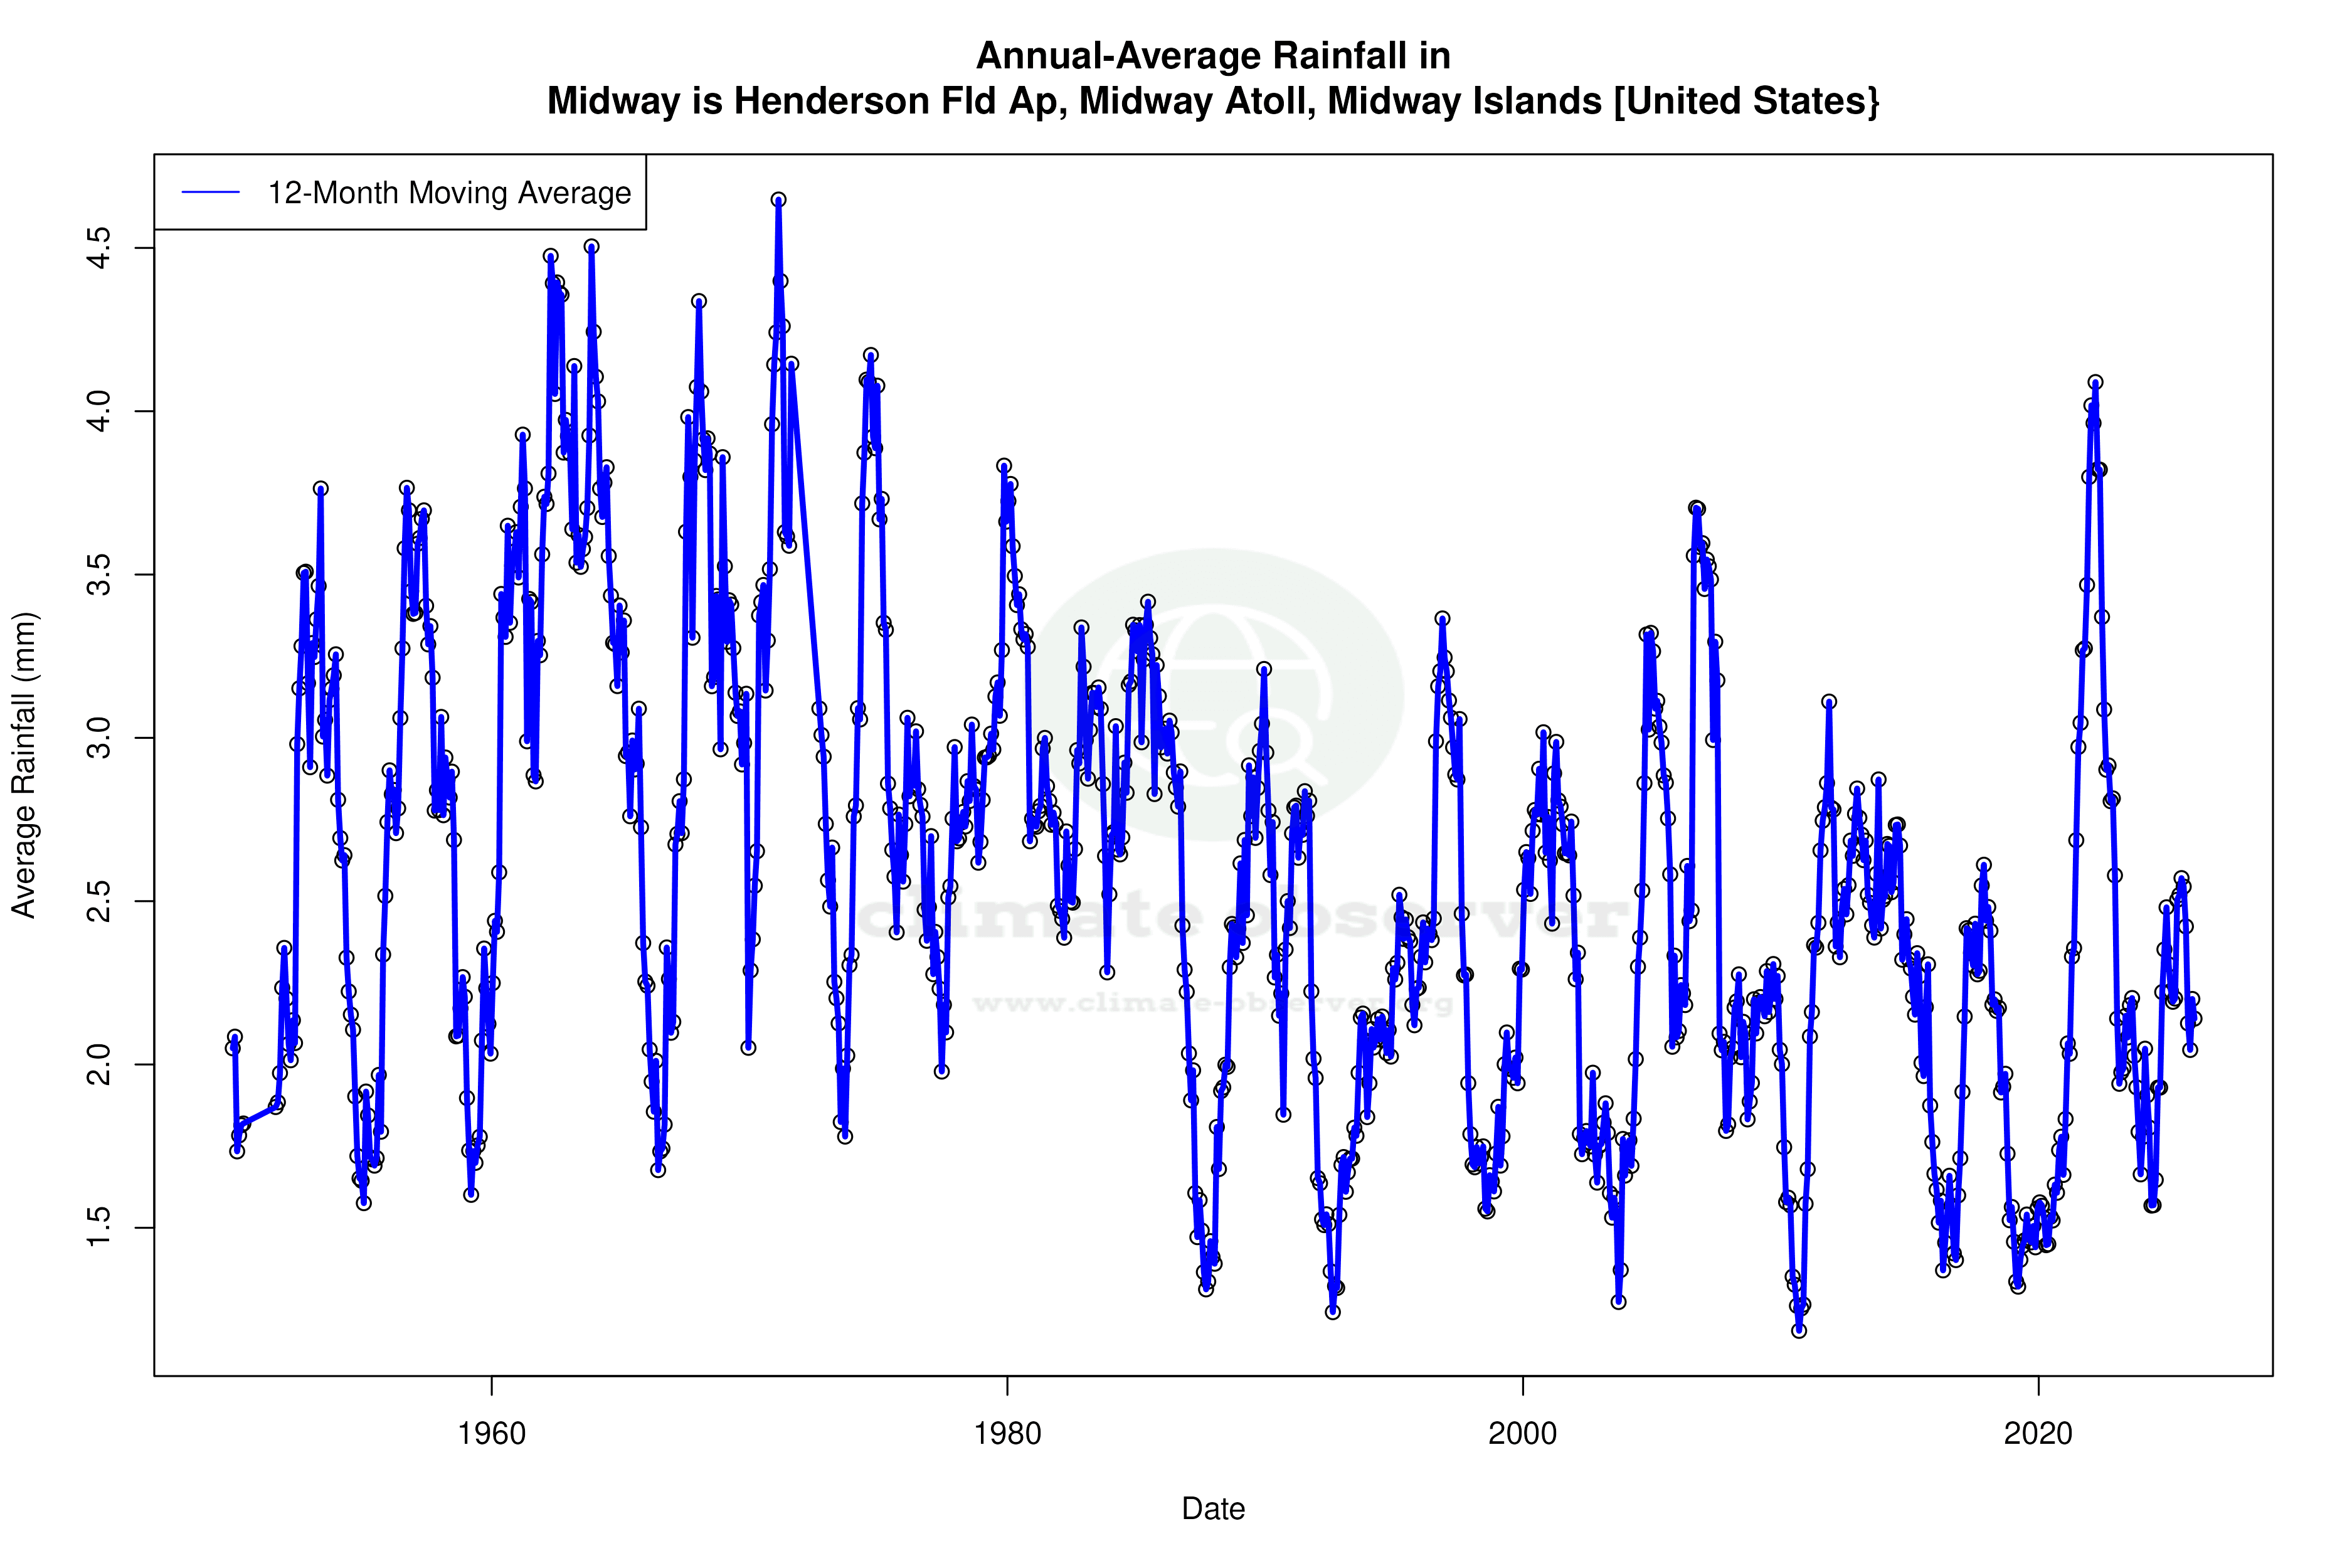
Precipitation Patterns: A Subtle Shift
The Precipitation Concentration Index (PCI) is a measure of how precipitation is distributed over time. A decrease in PCI from a baseline of 12.90 to a current value of 11.57 suggests that precipitation is becoming more evenly distributed throughout the year. This marginal change indicates a slight shift towards more regular rainfall events, which could benefit local ecosystems by reducing the risk of extreme weather events such as droughts or floods.
Temperature Extremes and Records
Midway has experienced temperature extremes with a record high of 35.5°C (95.9°F) and a record low of 9.4°C (48.9°F). These extremes underscore the range of temperatures that can occur in this tropical savanna climate, influenced by oceanic currents and atmospheric conditions.
Regional Climate Goals and Implications
The Midway Islands are part of broader United States efforts to address climate change, focusing on reducing carbon emissions and enhancing resilience to climate impacts. The observed warming trends and changes in precipitation distribution at Henderson Field Airport provide valuable insights into the local manifestations of global climate change. These data points are essential for informing regional climate strategies and ensuring sustainable development in the face of evolving climatic conditions.
Station Statistics
10-Year Trend
High: +0.04 °C/decade
Low: +0.12 °C/decade
Rain: +0.53 mm/decade
25-Year Trend
High: +0.80 °C/decade
Low: -0.43 °C/decade
Rain: -0.04 mm/decade
50-Year Trend
High: -0.01 °C/decade
Low: +0.21 °C/decade
Rain: -0.12 mm/decade
All-Time Trend
High: +0.06 °C/decade
Low: +0.23 °C/decade
Rain: -0.13 mm/decade
Percentage Above-Average Days
Last 12 Months: 47.1%
This Year: 25.7%
Precipitation Concentration Index (PCI) ℹ️
Last 12 Months: 11.2
Historical Average: 11.9
Percentile Rank of Last 12 Months ℹ️
High: 78th percentile
Low: 76th percentile
Rain: 41st percentile
Change in Variance ℹ️
High: -1.3%
Low: -5.2%
Intraday: -37.6%
Data Coverage
94.9%
First Year of Data
1945
Station Location
Historical Weather Records
| Max High | Avg High | Min High | Max Avg | Avg Avg | Min Avg | Max Low | Avg Low | Min Low | Max Precipitation | Avg Precipitation | Max Snow | Avg Snow | |
|---|---|---|---|---|---|---|---|---|---|---|---|---|---|
| Record | 35.5 °C | — | 14.4 °C | 29.6 °C | — | 12.9 °C | 30.0 °C | — | 9.4 °C | 186.2 mm | — | 1778.0 mm | — |
| January | 28.0 °C | 21.1 °C | 15.4 °C | 24.3 °C | 19.3 °C | 13.3 °C | 23.5 °C | 17.4 °C | 9.4 °C | 128.0 mm | 3.5 mm | 0.0 mm | 0.0 mm |
| February | 27.2 °C | 20.8 °C | 15.0 °C | 23.9 °C | 18.9 °C | 14.0 °C | 23.3 °C | 17.0 °C | 10.0 °C | 77.5 mm | 3.2 mm | 0.0 mm | 0.0 mm |
| March | 27.2 °C | 21.2 °C | 14.4 °C | 24.0 °C | 19.2 °C | 12.9 °C | 22.7 °C | 17.6 °C | 10.6 °C | 97.8 mm | 2.3 mm | 0.0 mm | 0.0 mm |
| April | 27.8 °C | 22.2 °C | 15.6 °C | 24.6 °C | 20.1 °C | 13.2 °C | 23.9 °C | 18.5 °C | 11.7 °C | 127.0 mm | 1.8 mm | 0.0 mm | 0.0 mm |
| May | 30.6 °C | 23.7 °C | 17.5 °C | 26.8 °C | 21.7 °C | 16.8 °C | 25.0 °C | 20.2 °C | 12.8 °C | 172.7 mm | 1.8 mm | 0.0 mm | 0.0 mm |
| June | 31.7 °C | 26.5 °C | 19.4 °C | 28.1 °C | 24.4 °C | 18.8 °C | 27.2 °C | 23.0 °C | 16.1 °C | 186.2 mm | 1.7 mm | 1778.0 mm | 1.4 mm |
| July | 33.3 °C | 27.8 °C | 23.6 °C | 29.3 °C | 25.8 °C | 22.3 °C | 27.2 °C | 24.2 °C | 18.9 °C | 97.0 mm | 2.2 mm | 0.0 mm | 0.0 mm |
| August | 35.5 °C | 28.3 °C | 23.9 °C | 29.6 °C | 26.3 °C | 22.4 °C | 30.0 °C | 24.7 °C | 17.8 °C | 115.6 mm | 3.0 mm | 0.0 mm | 0.0 mm |
| September | 33.3 °C | 28.1 °C | 23.0 °C | 29.3 °C | 26.2 °C | 21.6 °C | 27.9 °C | 24.5 °C | 17.8 °C | 94.7 mm | 2.7 mm | 0.0 mm | 0.0 mm |
| October | 32.7 °C | 26.5 °C | 20.0 °C | 29.0 °C | 24.6 °C | 19.0 °C | 27.2 °C | 23.0 °C | 15.0 °C | 173.5 mm | 2.4 mm | 0.0 mm | 0.0 mm |
| November | 33.8 °C | 24.5 °C | 17.2 °C | 26.5 °C | 22.7 °C | 15.3 °C | 25.6 °C | 21.1 °C | 12.8 °C | 157.2 mm | 3.1 mm | 0.0 mm | 0.0 mm |
| December | 27.8 °C | 22.6 °C | 15.9 °C | 25.4 °C | 20.9 °C | 15.2 °C | 24.2 °C | 19.0 °C | 10.6 °C | 124.5 mm | 3.1 mm | 0.0 mm | 0.0 mm |
Data Visualisations
Remove WatermarksCurrent Year Climate Trends vs Historical


Max Temperature this Year | 1 of 6
Climate 12-Month Moving Averages


Max Temperature 12-Month MA | 1 of 6
Daily Data Points and Averages Throughout the Year


Average Max Temperature Throughout Year | 1 of 5