Climate for Station: Nueva Casas Grandes, Chihuahua, Mexico
Loading live weather...
Climate Analysis & Overview
Nueva Casas Grandes is experiencing a complex climate narrative with a warming trend in recent years, juxtaposed against a historical cooling in low temperatures. This region is witnessing a slight decrease in precipitation concentration, indicating a more even distribution of rainfall events.
Desert Climate Dynamics
Nueva Casas Grandes, located in the state of Chihuahua, Mexico, is classified under the Köppen climate classification as a semi-arid climate (BSh). The region's geography, marked by its proximity to the Sierra Madre Occidental mountain range, influences its weather patterns, creating a unique interplay between desert and mountainous climates. The region's climate is characterised by hot summers and mild winters, with significant temperature variability.
Recent Warming Trends
In the past decade, Nueva Casas Grandes has experienced a notable warming trend in high temperatures, with an increase of 0.98°C (1.76°F). This recent warming contrasts with the historical trend, where high temperatures have risen by a more modest 0.06°C (0.11°F). The warming in recent years could be attributed to broader regional climate changes, potentially influenced by anthropogenic factors and natural climate variability.
Historical Cooling of Low Temperatures
Interestingly, the all-time trend for low temperatures shows a cooling of 0.17°C (0.31°F), suggesting a historical decline in minimum temperatures. This cooling trend is less pronounced in the past decade, with lows increasing slightly by 0.07°C (0.13°F). The divergence between recent warming highs and cooling lows over the long term presents a complex climate story that may be influenced by localised geographical factors and broader climate dynamics.
Precipitation Patterns and Distribution
The Precipitation Concentration Index (PCI) for Nueva Casas Grandes has shown a slight decrease from a baseline of 20.23 to a current value of 19.99. This marginal change suggests that rainfall is becoming slightly more evenly distributed throughout the year, although it remains relatively concentrated. A PCI value above 20 indicates highly concentrated precipitation events, so this shift towards a more balanced distribution may have implications for local agriculture and water management strategies.
Extremes and Records
Nueva Casas Grandes has recorded extreme temperatures with a maximum of 43.5°C (110.3°F) and a minimum of -21.5°C (-6.7°F). These records highlight the region's susceptibility to temperature extremes, which can pose challenges for both human habitation and the local ecosystem. The ability to adapt to such extremes is crucial for the resilience of the region's communities and natural systems.
The climate profile of Nueva Casas Grandes is a tapestry of warming trends, historical cooling, and evolving precipitation patterns, set against the backdrop of Mexico's regional climate goals and recent weather events.
Station Statistics
10-Year Trend
High: +0.73 °C/decade
Low: +0.57 °C/decade
Rain: -0.91 mm/decade
25-Year Trend
High: +0.85 °C/decade
Low: +0.36 °C/decade
Rain: -0.13 mm/decade
50-Year Trend
High: +0.59 °C/decade
Low: +0.44 °C/decade
Rain: -0.08 mm/decade
All-Time Trend
High: +0.06 °C/decade
Low: -0.16 °C/decade
Rain: +0.02 mm/decade
Percentage Above-Average Days
Last 12 Months: 56.2%
This Year: 50.0%
Precipitation Concentration Index (PCI) ℹ️
Last 12 Months: 15.0
Historical Average: 19.1
Percentile Rank of Last 12 Months ℹ️
High: 87th percentile
Low: 82nd percentile
Rain: 21st percentile
Change in Variance ℹ️
High: -6.4%
Low: -17.8%
Intraday: -20.8%
Data Coverage
89.6%
First Year of Data
1943
Station Location
Historical Weather Records
| Max High | Avg High | Min High | Max Avg | Avg Avg | Min Avg | Max Low | Avg Low | Min Low | Max Precipitation | Avg Precipitation | Max Snow | Avg Snow | |
|---|---|---|---|---|---|---|---|---|---|---|---|---|---|
| Record | 43.5 °C | — | -8.8 °C | 35.5 °C | — | -12.2 °C | 28.0 °C | — | -21.5 °C | 85.2 mm | — | — | — |
| January | 31.5 °C | 16.4 °C | -5.5 °C | 19.3 °C | 7.4 °C | -6.0 °C | 13.0 °C | -0.5 °C | -21.5 °C | 28.4 mm | 0.5 mm | — | — |
| February | 31.0 °C | 19.0 °C | -8.8 °C | 20.3 °C | 10.0 °C | -12.2 °C | 14.5 °C | 1.1 °C | -14.6 °C | 23.8 mm | 0.6 mm | — | — |
| March | 35.5 °C | 22.3 °C | 3.5 °C | 23.6 °C | 13.4 °C | -0.2 °C | 27.0 °C | 4.2 °C | -8.0 °C | 21.5 mm | 0.3 mm | — | — |
| April | 36.5 °C | 26.5 °C | 8.0 °C | 27.6 °C | 17.5 °C | 2.1 °C | 18.0 °C | 7.5 °C | -5.0 °C | 25.5 mm | 0.2 mm | — | — |
| May | 40.0 °C | 30.7 °C | 16.0 °C | 30.5 °C | 21.9 °C | 7.2 °C | 25.0 °C | 11.2 °C | -0.5 °C | 20.5 mm | 0.2 mm | — | — |
| June | 43.5 °C | 34.9 °C | 21.0 °C | 34.9 °C | 26.3 °C | 15.7 °C | 25.5 °C | 16.3 °C | 5.0 °C | 36.3 mm | 0.6 mm | — | — |
| July | 42.0 °C | 33.3 °C | 21.1 °C | 35.5 °C | 25.4 °C | 17.8 °C | 28.0 °C | 18.0 °C | 9.0 °C | 80.1 mm | 2.8 mm | — | — |
| August | 41.0 °C | 32.0 °C | 19.0 °C | 34.2 °C | 24.1 °C | 16.8 °C | 28.0 °C | 17.1 °C | 7.0 °C | 85.2 mm | 2.6 mm | — | — |
| September | 41.0 °C | 30.3 °C | 15.0 °C | 32.4 °C | 21.9 °C | 11.3 °C | 23.0 °C | 14.3 °C | 4.0 °C | 43.2 mm | 1.5 mm | — | — |
| October | 39.5 °C | 26.6 °C | 7.5 °C | 25.7 °C | 17.5 °C | 2.8 °C | 20.5 °C | 8.8 °C | -6.0 °C | 58.0 mm | 0.8 mm | — | — |
| November | 33.5 °C | 20.9 °C | -1.0 °C | 23.3 °C | 11.6 °C | -3.9 °C | 16.5 °C | 3.0 °C | -11.0 °C | 40.8 mm | 0.5 mm | — | — |
| December | 27.5 °C | 16.6 °C | -1.0 °C | 21.3 °C | 7.6 °C | -4.2 °C | 12.5 °C | -0.3 °C | -14.8 °C | 33.7 mm | 0.6 mm | — | — |
Data Visualisations
Remove WatermarksCurrent Year Climate Trends vs Historical


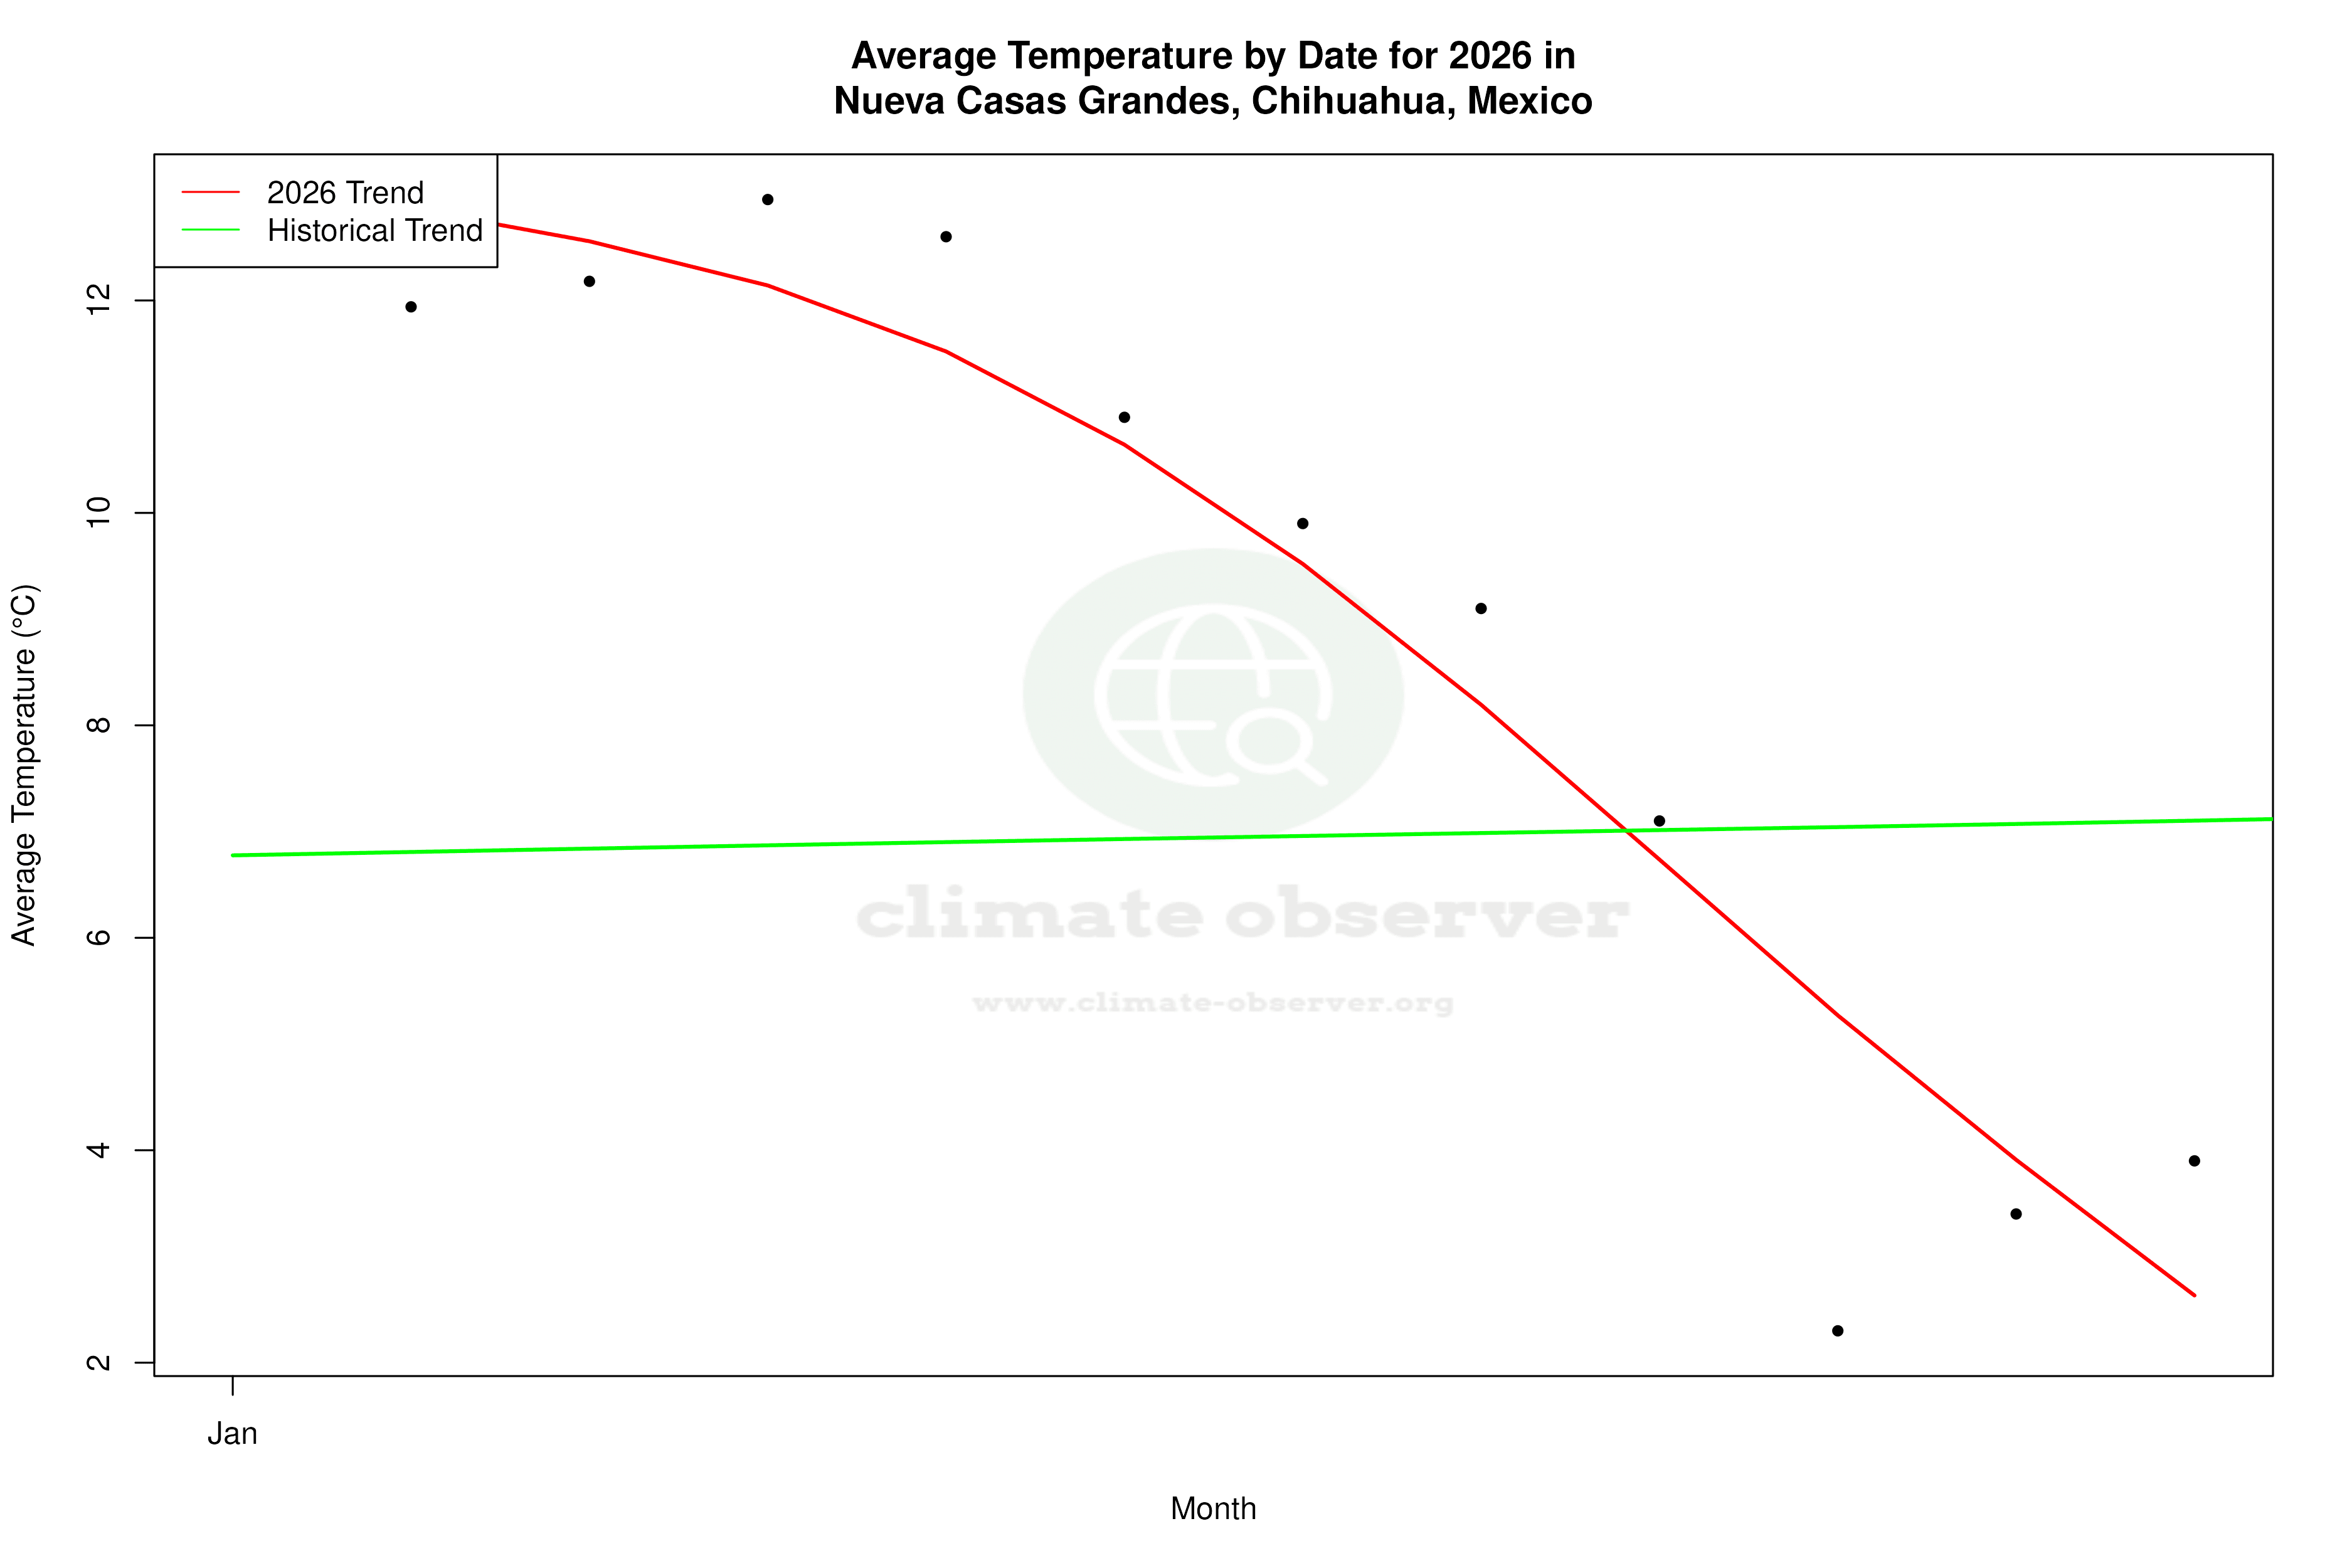


Max Temperature this Year | 1 of 6
Climate 12-Month Moving Averages


Max Temperature 12-Month MA | 1 of 6
Daily Data Points and Averages Throughout the Year


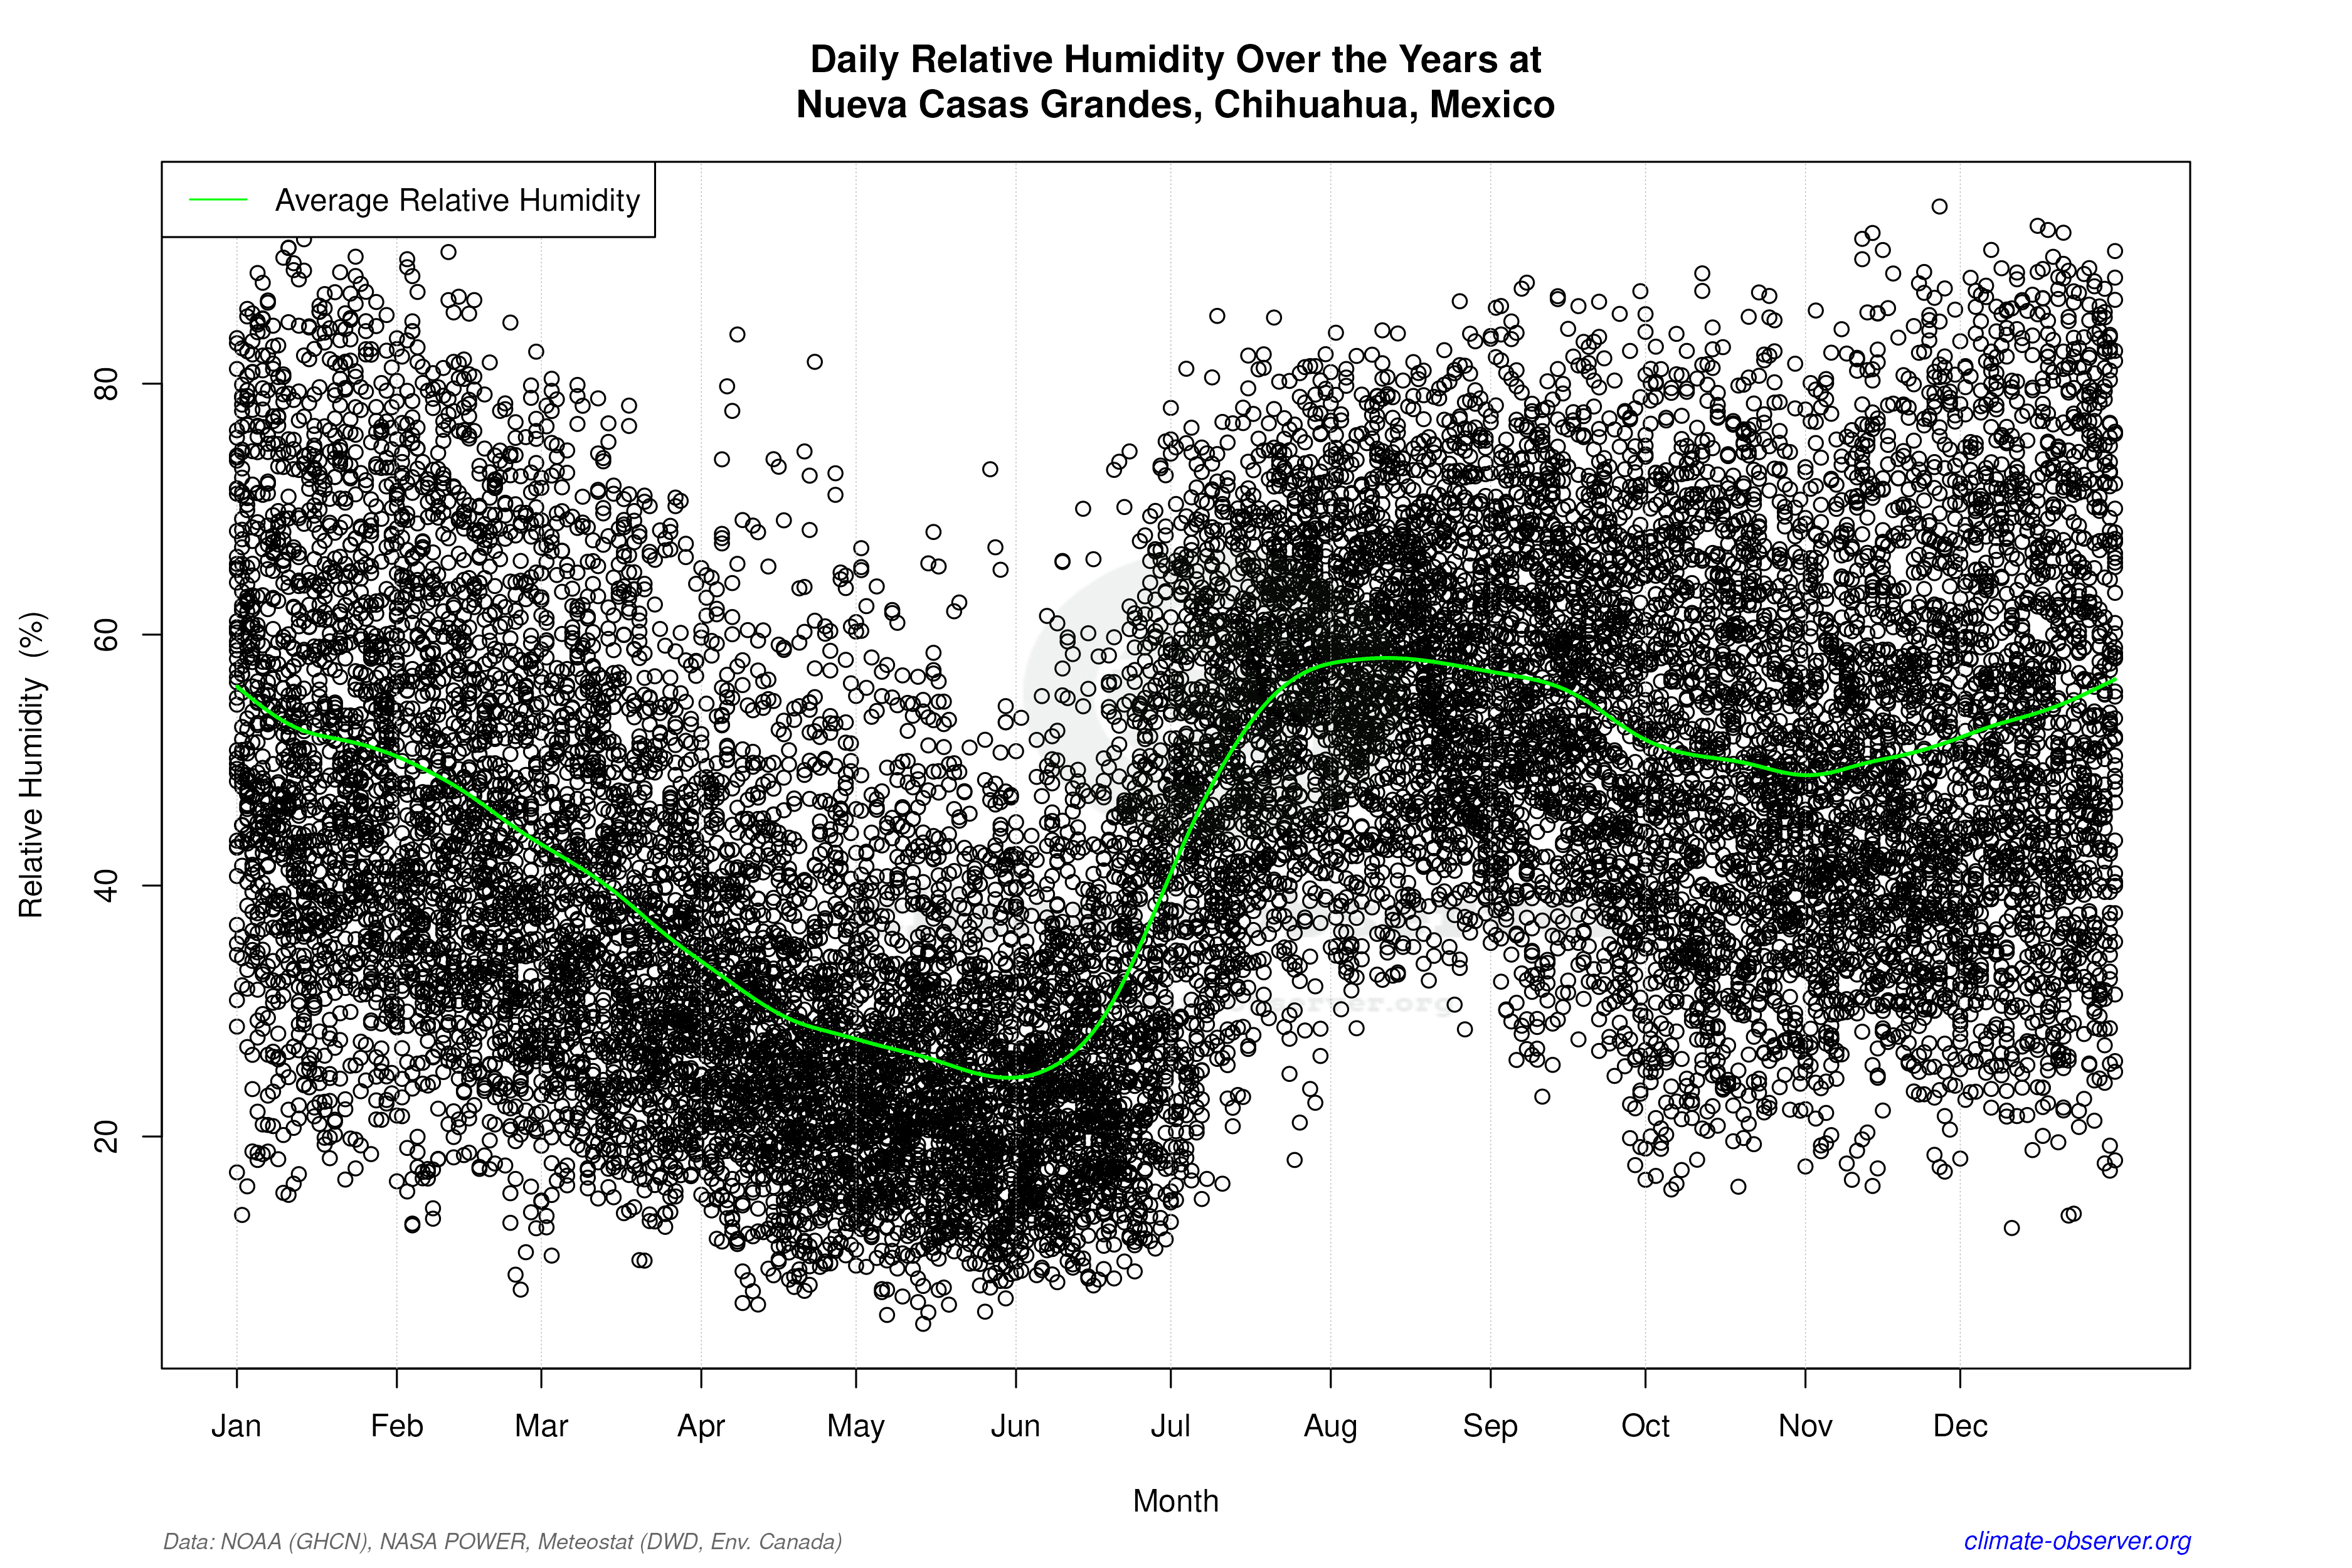

Average Max Temperature Throughout Year | 1 of 5
