Climate for Station: Ciudad Constitucion, Baja California Sur, Mexico
Loading live weather...
Climate Analysis & Overview
Ciudad Constitución's climate reveals a nuanced interplay between long-term warming and recent cooling trends. While all-time data indicates a slight warming, the past decade shows a cooling pattern. The region's precipitation has become more concentrated, pointing to shifts in weather patterns that could impact local agriculture and water resources.
Desert Climate Dynamics
Ciudad Constitución, situated in the arid landscape of Baja California Sur, falls under the BWh category of the Köppen climate classification, indicative of a hot desert climate. The region's climate is shaped by its proximity to the Pacific Ocean and the Sierra de la Giganta mountain range, which influence both temperature and precipitation patterns. Over the long term, the area has experienced a slight warming trend, with all-time high temperatures rising by 0.38°C (0.68°F) and low temperatures increasing by 0.38°C (0.68°F). These changes align with broader regional climate goals in Mexico, which aim to understand and mitigate the impacts of climate change.
Recent Cooling Trend
Interestingly, the past decade has witnessed a reversal of this warming trend, with high temperatures decreasing by 1.88°C (3.39°F) and low temperatures falling by 0.84°C (1.52°F). This cooling trend may be attributed to localised climatic variations or short-term atmospheric changes. It's crucial to monitor these shifts as they could have implications for local ecosystems and human activities.
Precipitation Patterns: A Concentrated Affair
The Precipitation Concentration Index (PCI) for Ciudad Constitución has increased from a baseline of 32.9 to a current value of 35.7. This significant rise indicates that rainfall is becoming more concentrated in fewer events, which can lead to challenges such as increased flood risk and reduced water availability during dry periods. Understanding these changes is vital for managing water resources effectively, especially in a region where agriculture plays a key role in the local economy.
Temperature Extremes and Records
The station has recorded temperature extremes with a maximum of 46.0°C (114.8°F) and a minimum of -3.0°C (26.6°F). These records highlight the potential for extreme weather events in the region, which can have profound effects on both natural and human systems. Such extremes underscore the importance of adaptive strategies to cope with the variability and potential impacts of climate change.
Regional Climate Considerations
The climate profile of Ciudad Constitución is set against the backdrop of Mexico's broader climate initiatives, which focus on reducing greenhouse gas emissions and enhancing resilience to climate impacts. Recent weather events, such as tropical storms, have underscored the need for robust climate adaptation measures. As the region navigates these challenges, continuous monitoring and research will be essential to inform policy and ensure sustainable development.
Station Statistics
10-Year Trend
High: -1.46 °C/decade
Low: -1.26 °C/decade
Rain: -0.34 mm/decade
25-Year Trend
High: +0.19 °C/decade
Low: +0.32 °C/decade
Rain: -0.10 mm/decade
50-Year Trend
High: +0.30 °C/decade
Low: +0.79 °C/decade
Rain: +0.00 mm/decade
All-Time Trend
High: +0.39 °C/decade
Low: +0.37 °C/decade
Rain: -0.00 mm/decade
Percentage Above-Average Days
Last 12 Months: 57.0%
This Year: 78.9%
Precipitation Concentration Index (PCI) ℹ️
Last 12 Months: 39.4
Historical Average: 34.0
Percentile Rank of Last 12 Months ℹ️
High: 75th percentile
Low: 59th percentile
Rain: 10th percentile
Change in Variance ℹ️
High: -14.8%
Low: -5.9%
Intraday: -7.5%
Data Coverage
91.6%
First Year of Data
1959
Station Location
Historical Weather Records
| Max High | Avg High | Min High | Max Avg | Avg Avg | Min Avg | Max Low | Avg Low | Min Low | Max Precipitation | Avg Precipitation | Max Snow | Avg Snow | |
|---|---|---|---|---|---|---|---|---|---|---|---|---|---|
| Record | 46.0 °C | — | 13.0 °C | 36.4 °C | — | 8.8 °C | 27.9 °C | — | -3.0 °C | 162.1 mm | — | — | — |
| January | 36.5 °C | 26.2 °C | 13.0 °C | 26.2 °C | 18.1 °C | 9.9 °C | 20.1 °C | 8.6 °C | -2.0 °C | 39.5 mm | 0.4 mm | — | — |
| February | 38.0 °C | 27.3 °C | 15.1 °C | 28.8 °C | 18.5 °C | 8.8 °C | 18.6 °C | 8.6 °C | -1.5 °C | 25.7 mm | 0.2 mm | — | — |
| March | 38.5 °C | 28.5 °C | 17.0 °C | 27.7 °C | 19.4 °C | 12.0 °C | 18.1 °C | 9.5 °C | 1.0 °C | 32.9 mm | 0.1 mm | — | — |
| April | 42.0 °C | 30.1 °C | 19.7 °C | 29.7 °C | 21.0 °C | 13.9 °C | 20.0 °C | 11.0 °C | 2.0 °C | 7.7 mm | 0.0 mm | — | — |
| May | 45.0 °C | 31.0 °C | 21.0 °C | 33.7 °C | 21.9 °C | 15.9 °C | 22.0 °C | 12.5 °C | 4.0 °C | 5.1 mm | 0.0 mm | — | — |
| June | 45.8 °C | 33.7 °C | 20.0 °C | 34.6 °C | 24.5 °C | 16.8 °C | 25.7 °C | 15.4 °C | 6.0 °C | 33.5 mm | 0.0 mm | — | — |
| July | 45.5 °C | 36.9 °C | 27.0 °C | 36.4 °C | 28.2 °C | 19.8 °C | 27.1 °C | 19.9 °C | 10.0 °C | 50.0 mm | 0.5 mm | — | — |
| August | 44.0 °C | 37.2 °C | 26.5 °C | 36.2 °C | 29.2 °C | 22.9 °C | 27.9 °C | 21.7 °C | 10.0 °C | 162.1 mm | 1.5 mm | — | — |
| September | 46.0 °C | 36.1 °C | 25.5 °C | 34.8 °C | 28.4 °C | 22.2 °C | 27.7 °C | 21.1 °C | 10.0 °C | 108.0 mm | 1.7 mm | — | — |
| October | 43.0 °C | 33.8 °C | 24.0 °C | 34.5 °C | 25.4 °C | 17.8 °C | 27.1 °C | 16.8 °C | 5.0 °C | 107.4 mm | 0.5 mm | — | — |
| November | 39.4 °C | 30.1 °C | 20.0 °C | 29.3 °C | 21.6 °C | 13.2 °C | 22.0 °C | 12.2 °C | 2.0 °C | 59.0 mm | 0.3 mm | — | — |
| December | 36.2 °C | 26.7 °C | 17.0 °C | 28.3 °C | 18.8 °C | 11.3 °C | 20.6 °C | 9.6 °C | -3.0 °C | 70.0 mm | 0.5 mm | — | — |
Data Visualisations
Remove WatermarksCurrent Year Climate Trends vs Historical


Max Temperature this Year | 1 of 6
Climate 12-Month Moving Averages


Max Temperature 12-Month MA | 1 of 6
Daily Data Points and Averages Throughout the Year


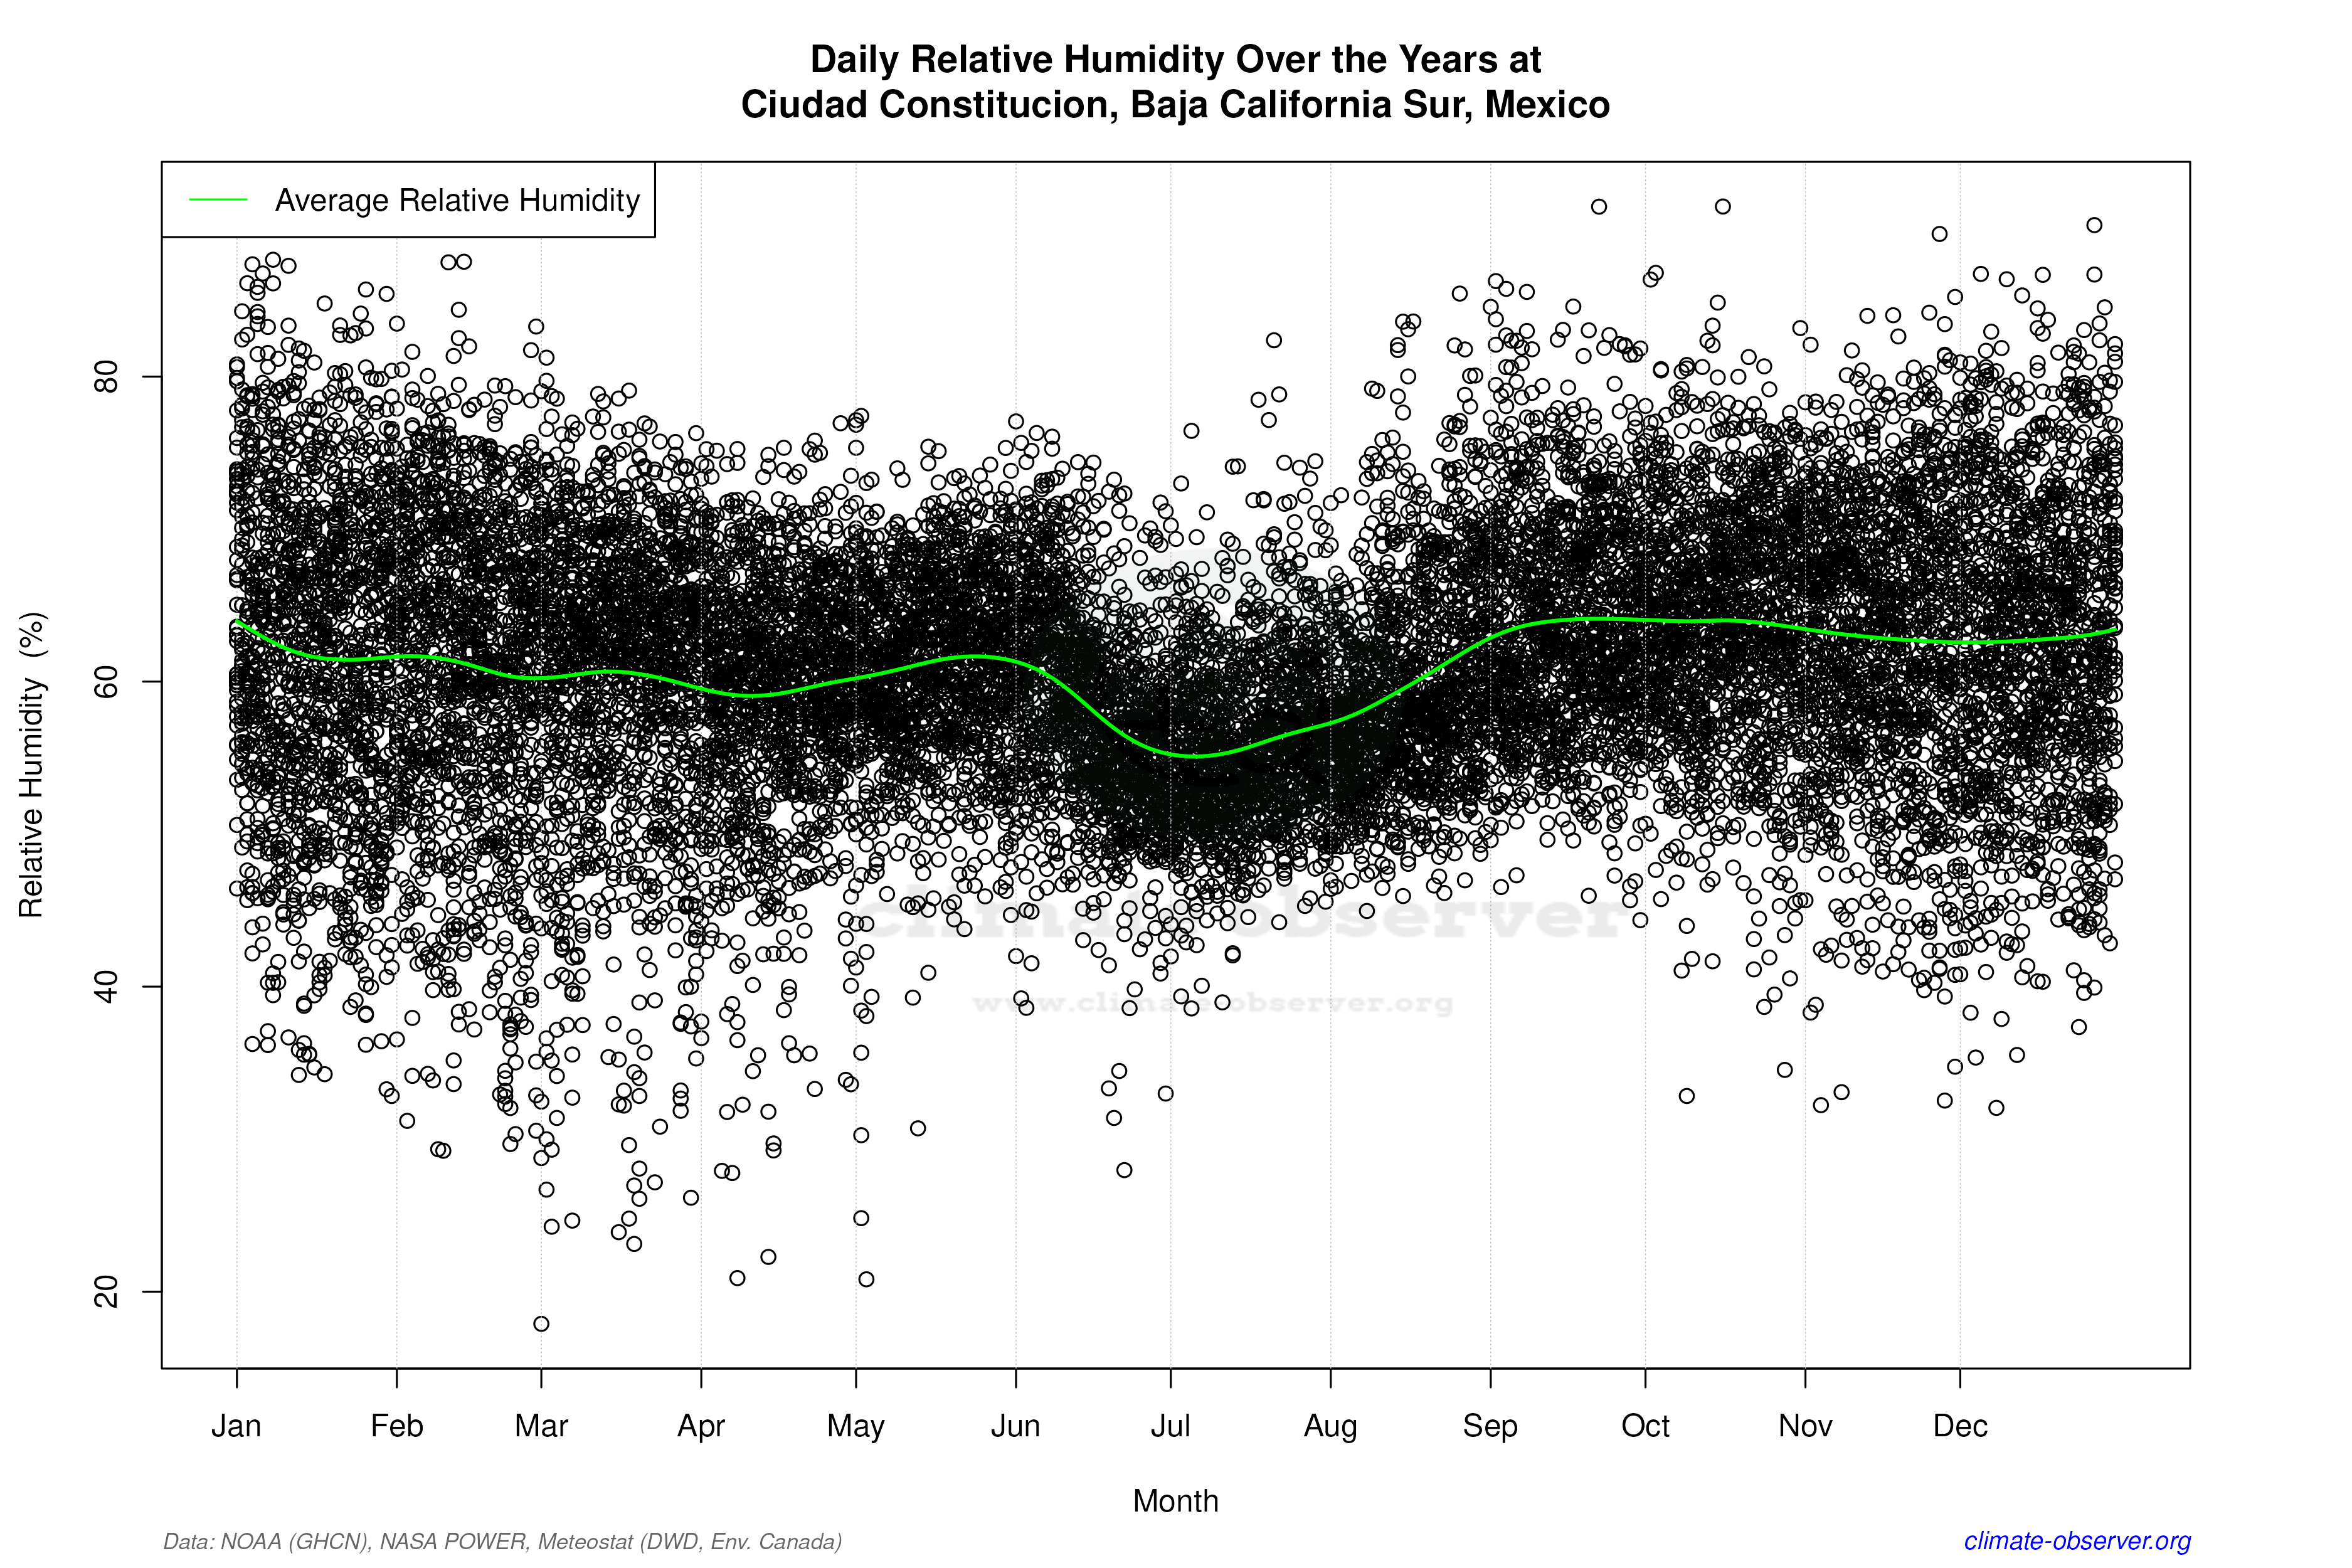

Average Max Temperature Throughout Year | 1 of 5
