Climate for Station: Zamora, Michoacán, Mexico
Loading live weather...
Climate Analysis & Overview
Zamora's climate is experiencing nuanced thermal shifts, with a recent warming trend juxtaposed against a historical cooling. The Precipitation Concentration Index indicates a more even distribution of rainfall, reflecting subtle climatic adjustments in this Mexican region.
Thermal Dynamics in Zamora
Zamora, located in the heart of Michoacán, Mexico, is characterised by a Cwa Köppen climate classification, which denotes a subtropical highland climate with dry winters. The city's geographical position, nestled in a valley surrounded by mountains, influences its weather patterns significantly. Over the past decade, Zamora has experienced a warming trend with high temperatures rising by 0.41°C (0.74°F) and lows by 0.58°C (1.05°F). However, when examining all-time data, there is a slight cooling trend, with high temperatures falling by 0.10°C (0.18°F) and lows by 0.03°C (0.05°F). This duality in thermal trends suggests a complex interplay between short-term climatic variability and long-term cooling influences.
Precipitation Patterns and Distribution
The Precipitation Concentration Index (PCI) offers insights into the distribution of rainfall events. Zamora's current PCI is 19.1, a decrease from the baseline of 20.7. This shift indicates that rainfall is becoming more evenly distributed across the year, moving away from highly concentrated events. While the change is not drastic, it suggests a subtle adjustment towards a more balanced precipitation pattern, which could have implications for local agriculture and water management strategies.
Record Extremes: A Tale of Contrasts
Zamora's climate history is marked by significant temperature extremes, with a record high of 40.5°C (104.9°F) and a record low of -3.0°C (26.6°F). These extremes highlight the region's susceptibility to both heatwaves and cold snaps, which can be exacerbated by its valley geography that traps heat and cold air. Understanding these extremes is crucial for preparing for future events, especially in the context of global climate change.
Regional Climate Goals and Implications
Mexico's commitment to reducing greenhouse gas emissions and adapting to climate change is a backdrop to Zamora's climatic shifts. The observed trends in temperature and precipitation distribution could influence regional strategies for climate resilience. As Zamora continues to adapt, understanding these nuanced changes will be key to aligning local practices with national climate objectives.
Station Statistics
10-Year Trend
High: +0.54 °C/decade
Low: +0.10 °C/decade
Rain: -0.17 mm/decade
25-Year Trend
High: +2.01 °C/decade
Low: -0.14 °C/decade
Rain: -0.07 mm/decade
50-Year Trend
High: +0.54 °C/decade
Low: +0.18 °C/decade
Rain: -0.17 mm/decade
All-Time Trend
High: -0.09 °C/decade
Low: -0.04 °C/decade
Rain: -0.07 mm/decade
Percentage Above-Average Days
Last 12 Months: 45.5%
This Year: 7.9%
Precipitation Concentration Index (PCI) ℹ️
Last 12 Months: 19.7
Historical Average: 20.8
Percentile Rank of Last 12 Months ℹ️
High: 74th percentile
Low: 67th percentile
Rain: 45th percentile
Change in Variance ℹ️
High: -12.5%
Low: -15.9%
Intraday: -18.1%
Data Coverage
91.2%
First Year of Data
1947
Station Location
Historical Weather Records
| Max High | Avg High | Min High | Max Avg | Avg Avg | Min Avg | Max Low | Avg Low | Min Low | Max Precipitation | Avg Precipitation | Max Snow | Avg Snow | |
|---|---|---|---|---|---|---|---|---|---|---|---|---|---|
| Record | 40.5 °C | — | 11.6 °C | 32.4 °C | — | 7.8 °C | 24.0 °C | — | -3.0 °C | 87.2 mm | — | — | — |
| January | 33.6 °C | 26.3 °C | 11.6 °C | 25.4 °C | 16.4 °C | 9.0 °C | 17.0 °C | 7.4 °C | -3.0 °C | 53.0 mm | 0.5 mm | — | — |
| February | 35.8 °C | 28.3 °C | 13.7 °C | 25.4 °C | 18.1 °C | 10.8 °C | 18.0 °C | 8.5 °C | -1.0 °C | 66.7 mm | 0.3 mm | — | — |
| March | 38.0 °C | 30.7 °C | 13.6 °C | 29.3 °C | 20.2 °C | 11.2 °C | 21.0 °C | 10.3 °C | 2.5 °C | 56.9 mm | 0.2 mm | — | — |
| April | 39.0 °C | 32.7 °C | 20.5 °C | 31.4 °C | 22.7 °C | 15.4 °C | 21.5 °C | 12.7 °C | 5.0 °C | 25.5 mm | 0.2 mm | — | — |
| May | 40.4 °C | 33.6 °C | 21.9 °C | 32.4 °C | 24.3 °C | 17.3 °C | 24.0 °C | 14.9 °C | 3.2 °C | 47.5 mm | 1.1 mm | — | — |
| June | 40.5 °C | 31.3 °C | 18.5 °C | 31.3 °C | 23.0 °C | 16.1 °C | 24.0 °C | 16.2 °C | 9.0 °C | 65.0 mm | 4.8 mm | — | — |
| July | 37.0 °C | 28.5 °C | 19.8 °C | 28.0 °C | 20.9 °C | 15.9 °C | 22.0 °C | 15.4 °C | 7.7 °C | 87.2 mm | 6.2 mm | — | — |
| August | 37.7 °C | 28.5 °C | 18.5 °C | 27.4 °C | 20.7 °C | 16.5 °C | 21.0 °C | 15.2 °C | 9.0 °C | 63.0 mm | 5.6 mm | — | — |
| September | 36.5 °C | 28.5 °C | 19.4 °C | 28.4 °C | 20.5 °C | 13.1 °C | 21.5 °C | 14.7 °C | 7.5 °C | 50.0 mm | 4.8 mm | — | — |
| October | 35.8 °C | 28.6 °C | 18.0 °C | 26.2 °C | 19.8 °C | 12.8 °C | 19.3 °C | 12.7 °C | 2.6 °C | 50.0 mm | 1.7 mm | — | — |
| November | 36.0 °C | 28.3 °C | 16.7 °C | 25.7 °C | 18.3 °C | 11.9 °C | 19.7 °C | 10.1 °C | -1.0 °C | 37.1 mm | 0.4 mm | — | — |
| December | 35.3 °C | 26.7 °C | 15.0 °C | 23.6 °C | 16.5 °C | 7.8 °C | 17.5 °C | 8.2 °C | -0.8 °C | 42.0 mm | 0.4 mm | — | — |
Data Visualisations
Remove WatermarksCurrent Year Climate Trends vs Historical


Max Temperature this Year | 1 of 6
Climate 12-Month Moving Averages


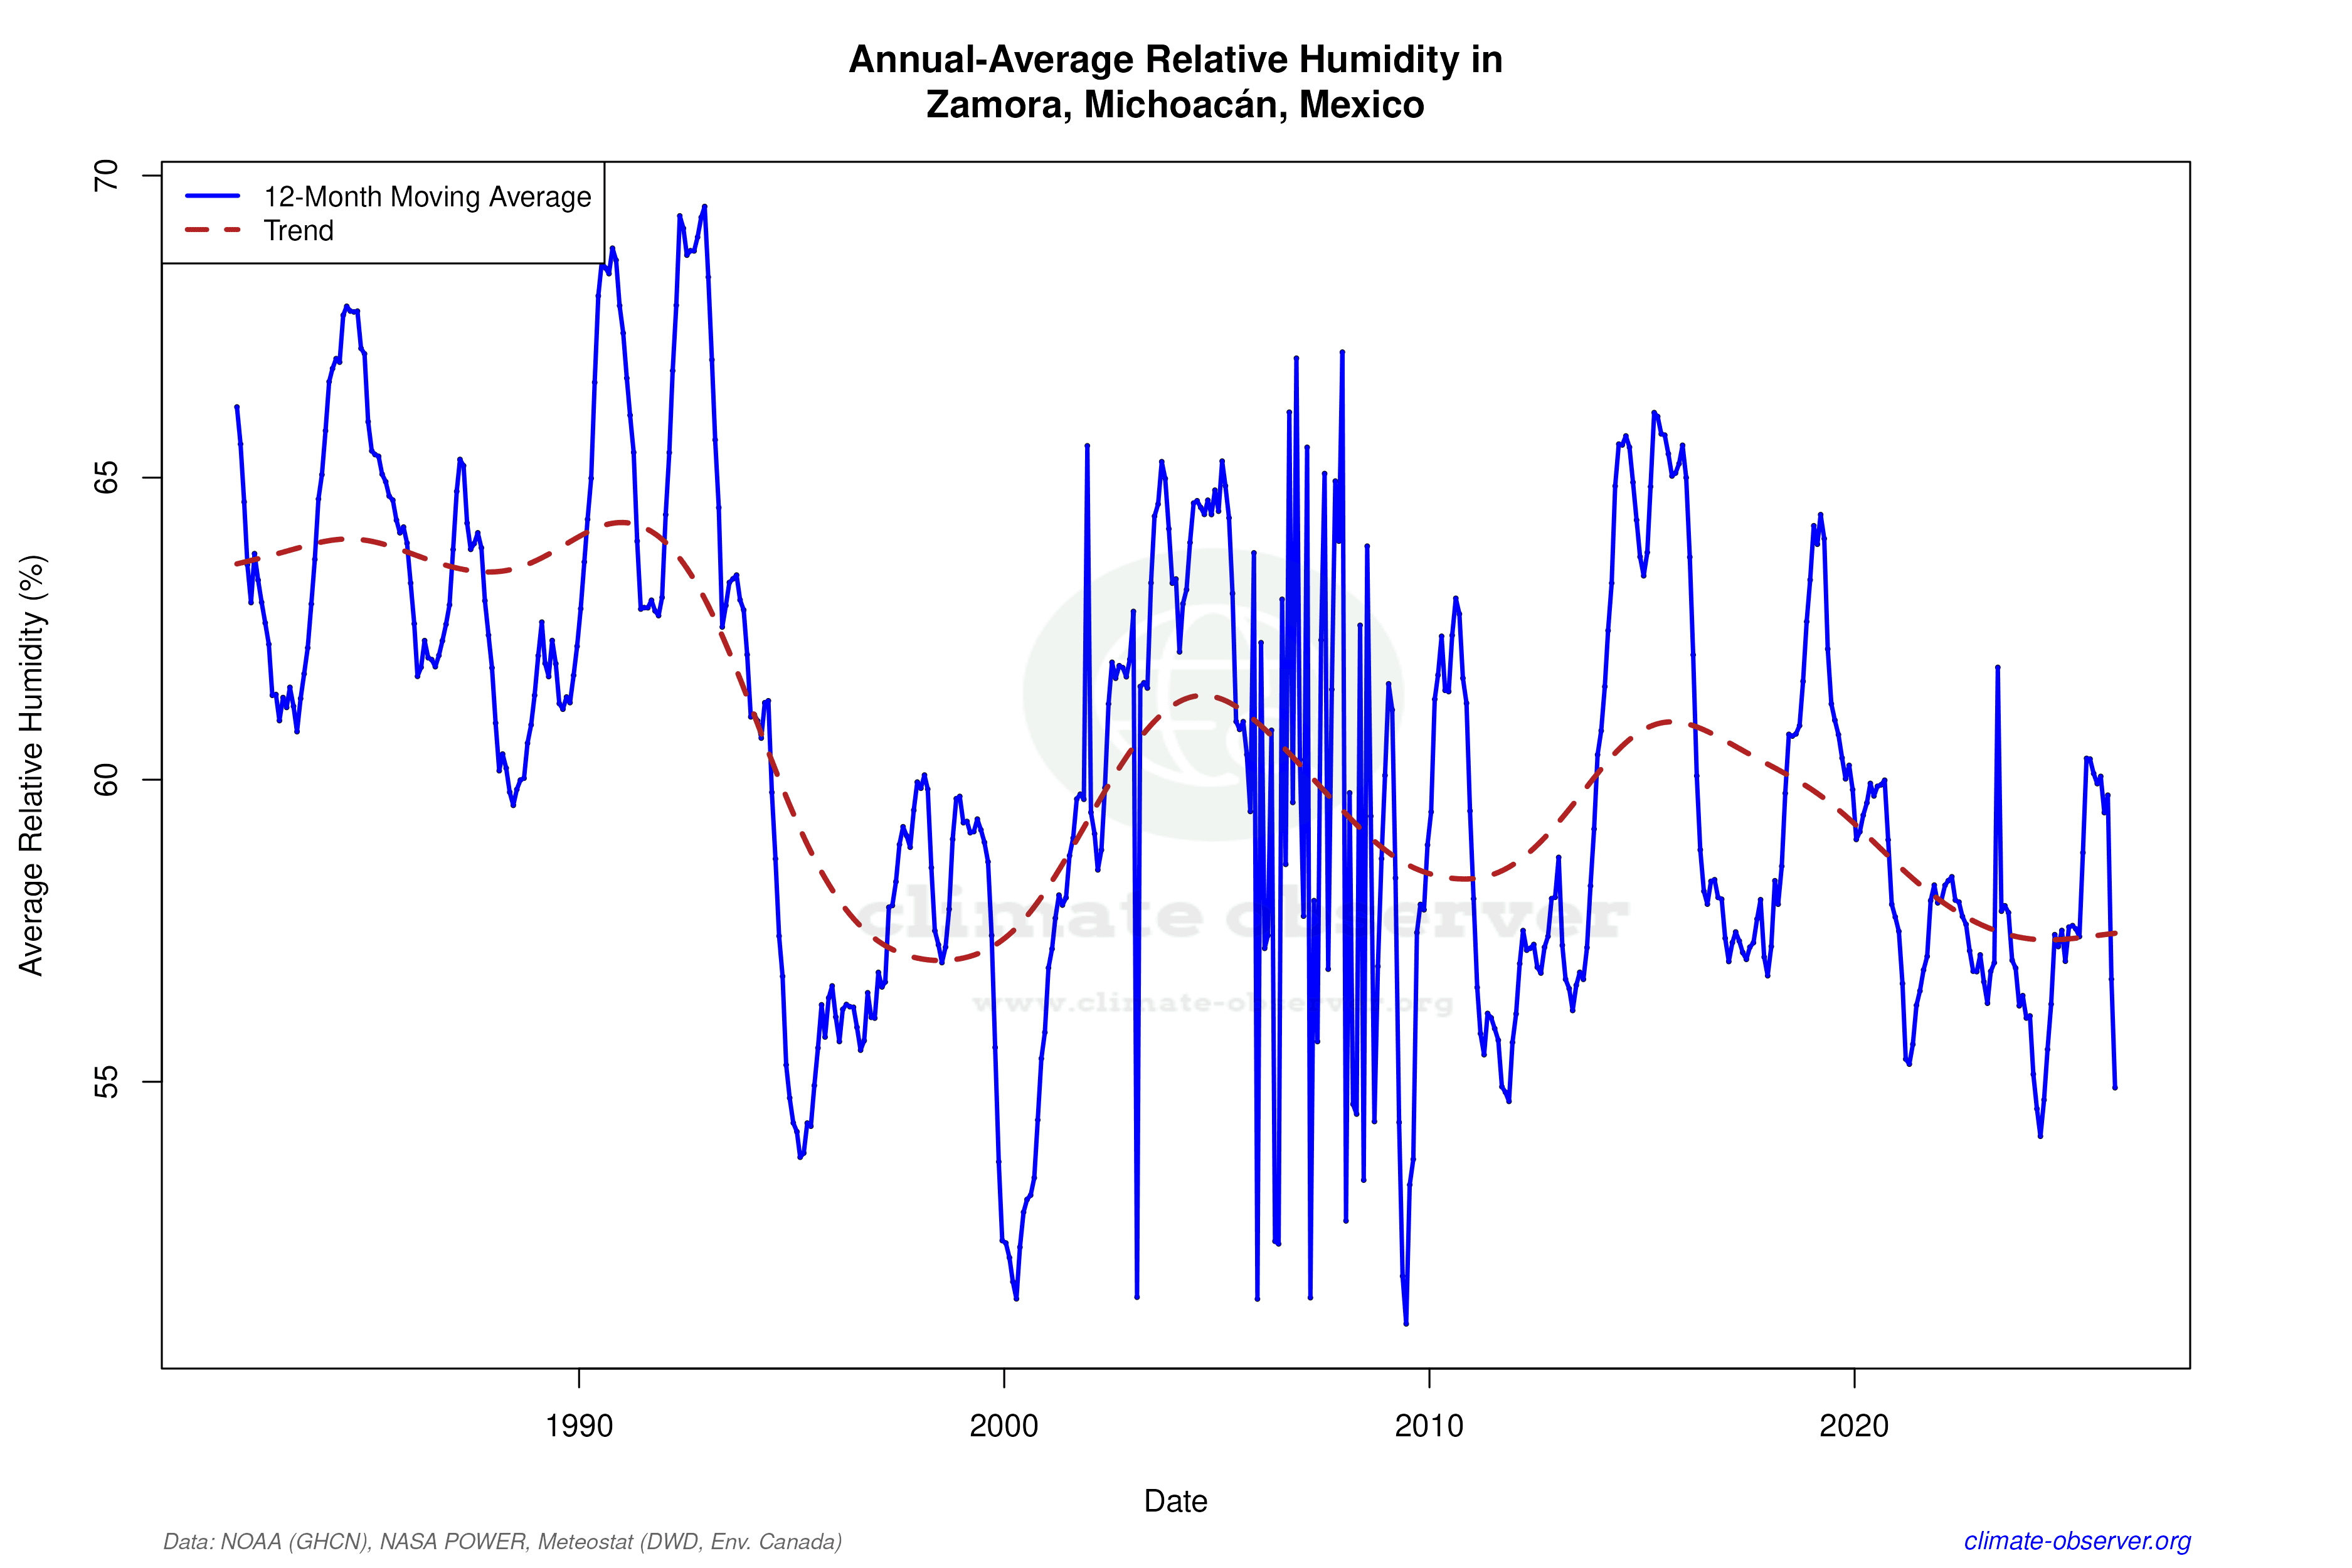

Max Temperature 12-Month MA | 1 of 6
Daily Data Points and Averages Throughout the Year


Average Max Temperature Throughout Year | 1 of 5
