Climate for Station: Tlaxcala De Xicontecatl (Dge), Tlaxcala, Mexico
Loading live weather...
Climate Analysis & Overview
Tlaxcala De Xicontecatl is experiencing a warming trend, with significant increases in both high and low temperatures over the past decade. The Precipitation Concentration Index has decreased, indicating a shift towards more evenly distributed rainfall. These changes align with Mexico's broader climate adaptation goals.
A Warming Landscape
Tlaxcala De Xicontecatl, situated in the highlands of central Mexico, is classified under the Köppen climate system as Cwb, which denotes a temperate climate with dry winters and warm summers. This region, nestled between mountains, experiences unique climatic influences due to its elevation and topography. Over the past decade, the area has seen a notable warming trend, with high temperatures increasing by 0.95°C (1.71°F) and low temperatures rising by 1.59°C (2.87°F). These trends are more pronounced than the all-time warming trends, which show increases of 0.29°C (0.52°F) for highs and 0.39°C (0.70°F) for lows. This accelerated warming over the last ten years suggests a shift that may impact local agriculture and water resources.
Temperature Extremes and Records
The region's temperature extremes are marked by a historical maximum of 38.9°C (102.0°F) and a minimum of -7.8°C (17.96°F). These records highlight the range of thermal conditions that Tlaxcala De Xicontecatl can experience, influenced by its elevation and geographical setting. The warming trends suggest that such extremes could become more frequent or intense, posing challenges for local communities and ecosystems.
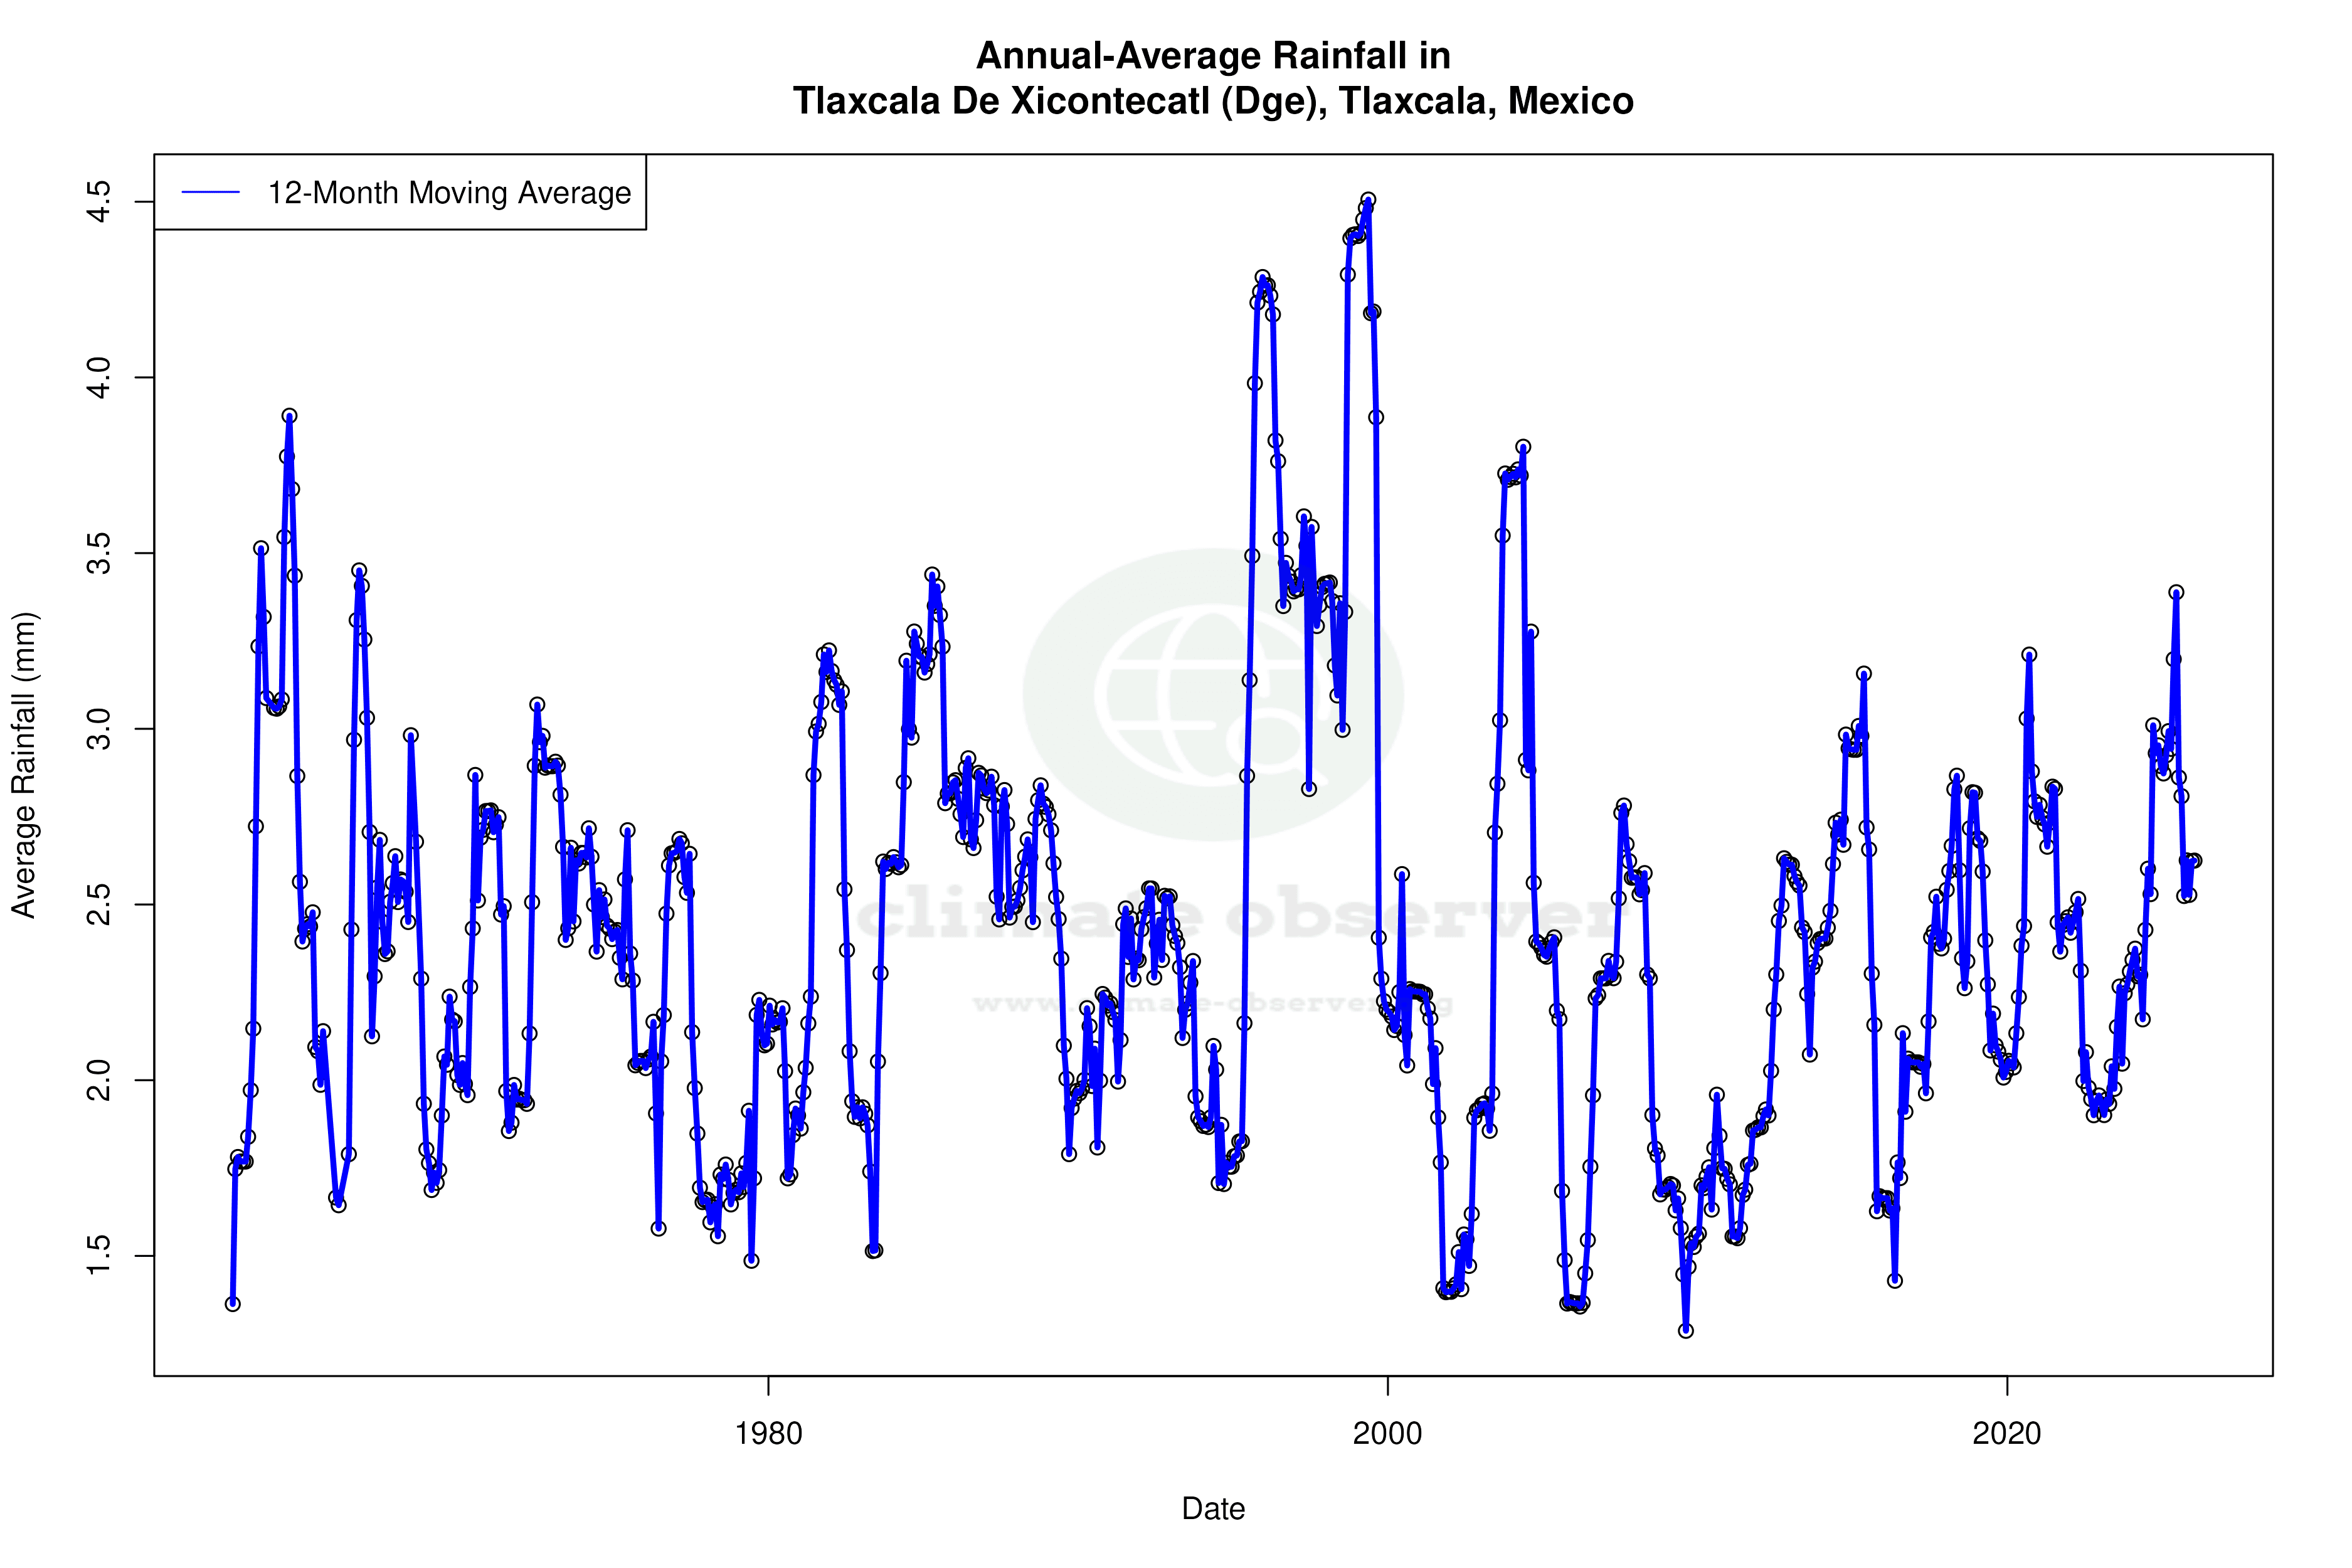
Precipitation Patterns Evolving
The Precipitation Concentration Index (PCI) for Tlaxcala De Xicontecatl has shown a decrease from a baseline of 15.90 to a current value of 12.89. The PCI measures how rainfall is distributed over time; a lower index indicates more evenly distributed precipitation. This shift suggests that rainfall events are becoming less concentrated, potentially reducing the risk of flash floods and benefiting agricultural practices by providing more consistent moisture availability.
Regional Climate Context
This warming and redistribution of precipitation align with Mexico's national climate goals, which aim to adapt to and mitigate the impacts of climate change. Recent weather events, such as unusual heatwaves and shifting rainfall patterns, underscore the importance of understanding and responding to these climatic changes. Tlaxcala De Xicontecatl's data provides a microcosm of broader regional trends, reflecting the challenges and opportunities faced by communities across Mexico in the face of a changing climate.
Station Statistics
10-Year Trend
High: +0.43 °C/decade
Low: +1.81 °C/decade
Rain: +0.43 mm/decade
25-Year Trend
High: +0.19 °C/decade
Low: +0.53 °C/decade
Rain: +0.20 mm/decade
50-Year Trend
High: +0.30 °C/decade
Low: +0.52 °C/decade
Rain: -0.02 mm/decade
All-Time Trend
High: +0.28 °C/decade
Low: +0.40 °C/decade
Rain: -0.02 mm/decade
Percentage Above-Average Days
Last 12 Months: 35.3%
This Year: 26.9%
Precipitation Concentration Index (PCI) ℹ️
Last 12 Months: 15.5
Historical Average: 18.0
Percentile Rank of Last 12 Months ℹ️
High: 48th percentile
Low: 99th percentile
Rain: 70th percentile
Change in Variance ℹ️
High: +2.5%
Low: -23.0%
Intraday: -9.8%
Data Coverage
93.6%
First Year of Data
1961
Station Location
Historical Weather Records
| Max High | Avg High | Min High | Max Avg | Avg Avg | Min Avg | Max Low | Avg Low | Min Low | Max Precipitation | Avg Precipitation | Max Snow | Avg Snow | |
|---|---|---|---|---|---|---|---|---|---|---|---|---|---|
| Record | 38.9 °C | — | 10.1 °C | 28.0 °C | — | 1.6 °C | 17.8 °C | — | -7.8 °C | 127.0 mm | — | — | — |
| January | 28.5 °C | 22.0 °C | 10.4 °C | 20.3 °C | 12.7 °C | 1.6 °C | 11.8 °C | 3.1 °C | -5.0 °C | 46.5 mm | 0.2 mm | — | — |
| February | 31.0 °C | 23.6 °C | 10.6 °C | 22.1 °C | 14.4 °C | 4.9 °C | 13.6 °C | 4.1 °C | -4.4 °C | 28.0 mm | 0.3 mm | — | — |
| March | 35.0 °C | 25.8 °C | 13.3 °C | 24.3 °C | 16.2 °C | 3.2 °C | 12.8 °C | 6.0 °C | -3.0 °C | 15.5 mm | 0.4 mm | — | — |
| April | 37.7 °C | 27.2 °C | 15.0 °C | 27.3 °C | 18.0 °C | 11.1 °C | 16.8 °C | 8.2 °C | 0.0 °C | 32.5 mm | 1.0 mm | — | — |
| May | 38.9 °C | 27.4 °C | 16.2 °C | 28.0 °C | 18.4 °C | 11.7 °C | 17.8 °C | 9.8 °C | 2.2 °C | 70.6 mm | 2.5 mm | — | — |
| June | 35.0 °C | 25.2 °C | 15.0 °C | 25.8 °C | 17.7 °C | 12.4 °C | 16.8 °C | 10.9 °C | 2.8 °C | 106.7 mm | 5.8 mm | — | — |
| July | 30.0 °C | 24.3 °C | 15.0 °C | 23.3 °C | 16.9 °C | 10.9 °C | 15.4 °C | 10.2 °C | 3.9 °C | 101.1 mm | 4.9 mm | — | — |
| August | 30.6 °C | 24.5 °C | 15.6 °C | 22.5 °C | 16.9 °C | 11.3 °C | 15.9 °C | 10.2 °C | 2.8 °C | 101.1 mm | 5.3 mm | — | — |
| September | 29.6 °C | 23.8 °C | 13.3 °C | 22.8 °C | 16.7 °C | 9.2 °C | 16.2 °C | 10.5 °C | 0.3 °C | 127.0 mm | 5.6 mm | — | — |
| October | 36.1 °C | 24.1 °C | 14.5 °C | 22.1 °C | 16.0 °C | 7.1 °C | 14.9 °C | 8.5 °C | -1.5 °C | 75.9 mm | 2.6 mm | — | — |
| November | 30.1 °C | 23.4 °C | 10.3 °C | 21.6 °C | 14.5 °C | 5.7 °C | 13.9 °C | 5.5 °C | -5.0 °C | 28.0 mm | 0.4 mm | — | — |
| December | 30.0 °C | 22.2 °C | 10.1 °C | 21.3 °C | 13.1 °C | 4.4 °C | 12.4 °C | 3.8 °C | -7.8 °C | 40.6 mm | 0.2 mm | — | — |
Data Visualisations
Remove WatermarksCurrent Year Climate Trends vs Historical


Max Temperature this Year | 1 of 6
Climate 12-Month Moving Averages


Max Temperature 12-Month MA | 1 of 6
Daily Data Points and Averages Throughout the Year


Average Max Temperature Throughout Year | 1 of 5
