Climate for Station: Felipe Carrillo Puerto (Obs), Quintana Roo, Mexico
Loading live weather...
Climate Analysis & Overview
Felipe Carrillo Puerto in Quintana Roo, México, exhibits a nuanced climate profile with a slight all-time warming trend in high temperatures of 0.16°C (0.29°F), contrasted by a cooling trend in lows over the past decade. The precipitation pattern has become more evenly distributed, reflecting a shift in local climatic behaviour.
Subtropical Climate Dynamics
Felipe Carrillo Puerto is situated in the heart of the Yucatán Peninsula, characterised by its tropical savanna climate (Köppen classification Aw). This region experiences distinct wet and dry seasons, influenced by its proximity to the Caribbean Sea. The local geography, with its relatively flat terrain, allows for the free movement of air masses, impacting temperature and precipitation patterns.
Temperature Trends: A Tale of Two Intervals
The all-time temperature trends for Felipe Carrillo Puerto reveal a slight warming in high temperatures of 0.16°C (0.29°F), suggesting a gradual rise over the long term. However, the past decade presents a more complex picture: high temperatures have increased by 0.97°C (1.75°F), while low temperatures have decreased by 1.02°C (1.84°F). This divergence indicates more pronounced temperature variability in recent years, potentially linked to broader regional climatic shifts or localised environmental changes.
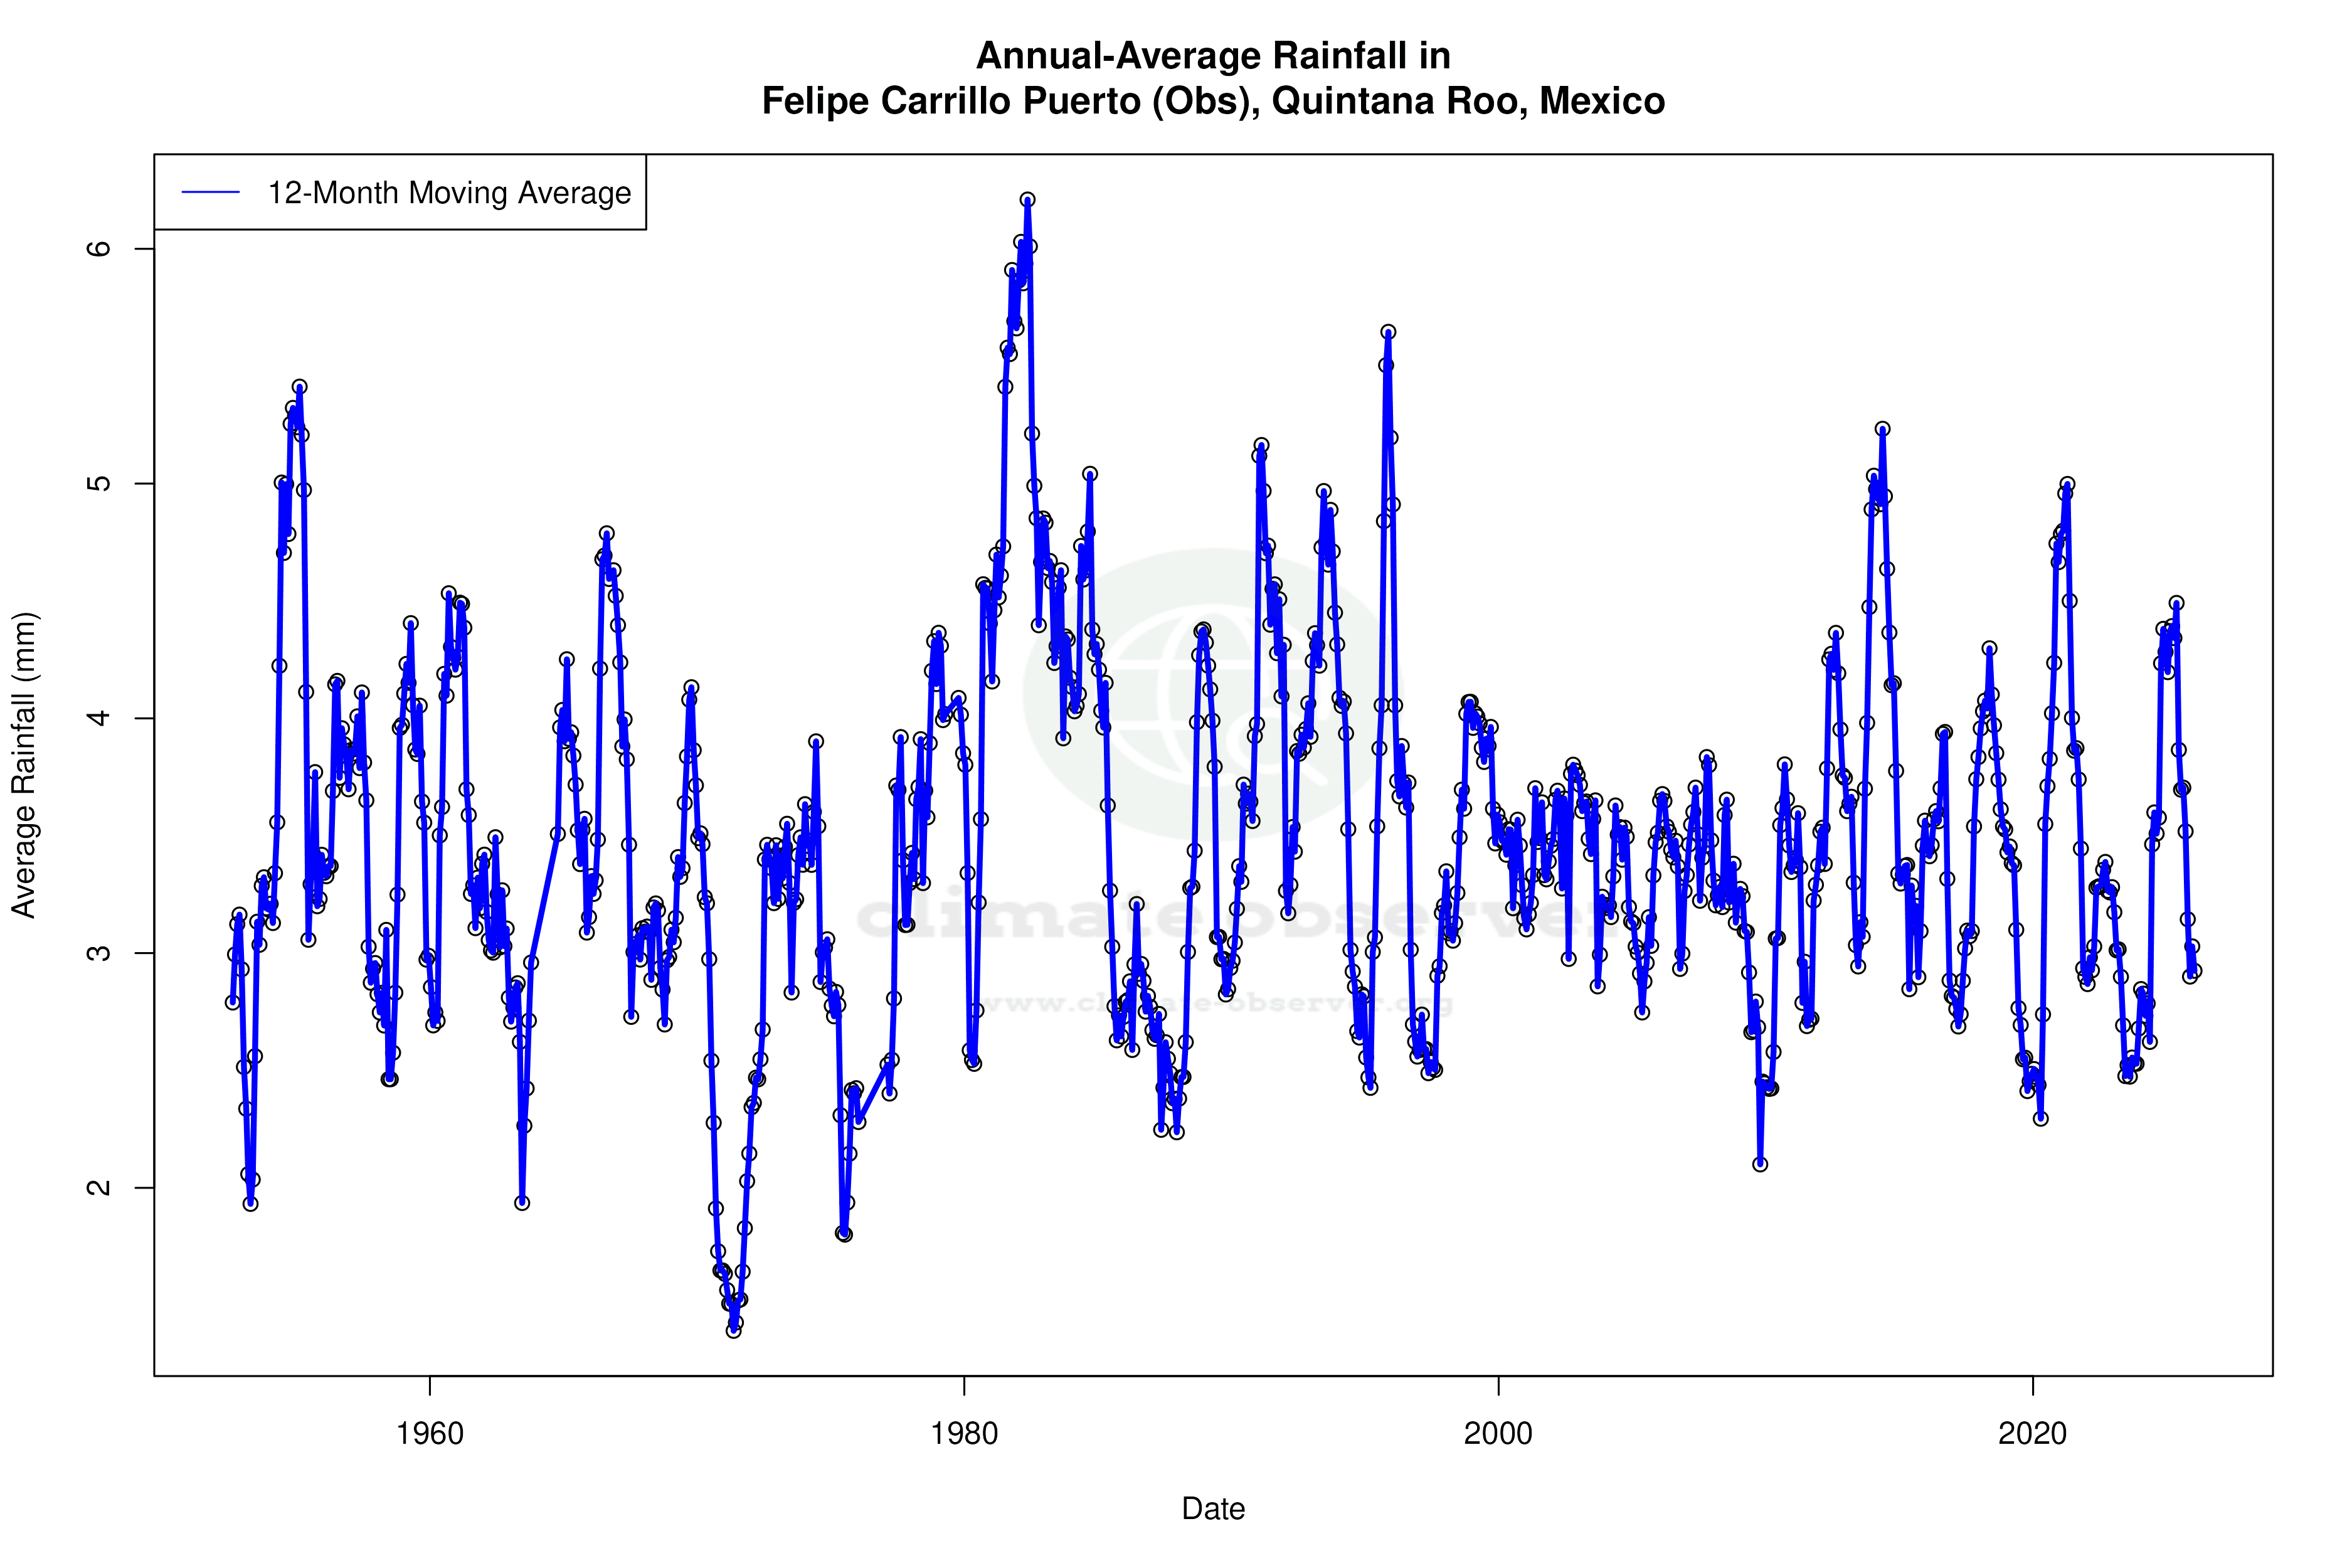
Precipitation Patterns: A Shift Towards Even Distribution
The Precipitation Concentration Index (PCI) for Felipe Carrillo Puerto has decreased from a baseline of 14.13 to a current value of 11.61. This change indicates that precipitation events are becoming more evenly distributed throughout the year, rather than being concentrated in fewer, more intense events. Such a shift could have implications for local agriculture and water management, as more consistent rainfall can support crop growth and reduce the risk of flooding.
Extreme Temperature Records
Felipe Carrillo Puerto has experienced extreme temperatures, with a record high of 42.0°C (107.6°F) and a record low of 6.5°C (43.7°F). These records highlight the potential for significant thermal variability, which can strain local ecosystems and infrastructure. Understanding these extremes is crucial for developing adaptive strategies to mitigate the impacts of such temperature fluctuations.
Regional Climate Goals and Implications
As part of México's broader climate goals, which aim to reduce carbon emissions and enhance climate resilience, the observed trends in Felipe Carrillo Puerto provide valuable insights. The slight warming trend aligns with global patterns of climate change, while the even distribution of precipitation could offer a model for sustainable water management practices. These localised observations underscore the importance of integrating climate data into regional planning and policy-making.
Station Statistics
10-Year Trend
High: +0.72 °C/decade
Low: -0.93 °C/decade
Rain: -0.07 mm/decade
25-Year Trend
High: +0.81 °C/decade
Low: +0.15 °C/decade
Rain: +0.01 mm/decade
50-Year Trend
High: +0.33 °C/decade
Low: +0.13 °C/decade
Rain: -0.12 mm/decade
All-Time Trend
High: +0.16 °C/decade
Low: +0.29 °C/decade
Rain: -0.02 mm/decade
Percentage Above-Average Days
Last 12 Months: 44.1%
This Year: 33.3%
Precipitation Concentration Index (PCI) ℹ️
Last 12 Months: 10.3
Historical Average: 12.9
Percentile Rank of Last 12 Months ℹ️
High: 92nd percentile
Low: 38th percentile
Rain: 33rd percentile
Change in Variance ℹ️
High: +12.9%
Low: -14.3%
Intraday: +34.7%
Data Coverage
90.2%
First Year of Data
1952
Station Location
Historical Weather Records
| Max High | Avg High | Min High | Max Avg | Avg Avg | Min Avg | Max Low | Avg Low | Min Low | Max Precipitation | Avg Precipitation | Max Snow | Avg Snow | |
|---|---|---|---|---|---|---|---|---|---|---|---|---|---|
| Record | 42.0 °C | — | 18.5 °C | 36.9 °C | — | 15.0 °C | 31.0 °C | — | 6.5 °C | 320.0 mm | — | — | — |
| January | 37.0 °C | 29.1 °C | 19.0 °C | 29.3 °C | 23.8 °C | 15.8 °C | 24.5 °C | 17.5 °C | 6.5 °C | 80.4 mm | 2.0 mm | — | — |
| February | 39.0 °C | 30.4 °C | 21.0 °C | 30.8 °C | 25.0 °C | 17.3 °C | 25.0 °C | 17.8 °C | 7.0 °C | 66.0 mm | 1.5 mm | — | — |
| March | 42.0 °C | 32.1 °C | 21.0 °C | 33.6 °C | 26.4 °C | 17.4 °C | 29.0 °C | 19.2 °C | 8.0 °C | 94.5 mm | 1.1 mm | — | — |
| April | 42.0 °C | 33.6 °C | 24.0 °C | 32.9 °C | 27.9 °C | 20.8 °C | 31.0 °C | 20.9 °C | 10.0 °C | 74.0 mm | 1.4 mm | — | — |
| May | 40.5 °C | 34.3 °C | 25.0 °C | 36.9 °C | 29.0 °C | 23.1 °C | 27.8 °C | 22.5 °C | 13.5 °C | 133.7 mm | 3.4 mm | — | — |
| June | 39.6 °C | 33.2 °C | 22.0 °C | 34.4 °C | 28.3 °C | 24.0 °C | 28.3 °C | 23.2 °C | 17.0 °C | 320.0 mm | 6.2 mm | — | — |
| July | 39.4 °C | 33.4 °C | 25.0 °C | 34.4 °C | 28.3 °C | 23.5 °C | 28.5 °C | 22.9 °C | 17.0 °C | 100.0 mm | 4.5 mm | — | — |
| August | 39.8 °C | 33.5 °C | 24.0 °C | 35.9 °C | 28.2 °C | 23.3 °C | 28.5 °C | 22.9 °C | 18.5 °C | 111.0 mm | 4.9 mm | — | — |
| September | 39.8 °C | 33.1 °C | 23.5 °C | 35.2 °C | 27.9 °C | 24.0 °C | 27.5 °C | 22.8 °C | 18.0 °C | 100.0 mm | 6.7 mm | — | — |
| October | 38.0 °C | 31.9 °C | 23.9 °C | 33.4 °C | 26.7 °C | 20.6 °C | 27.0 °C | 21.7 °C | 13.5 °C | 161.5 mm | 5.3 mm | — | — |
| November | 37.5 °C | 30.4 °C | 22.0 °C | 30.6 °C | 25.1 °C | 18.1 °C | 29.0 °C | 19.6 °C | 9.0 °C | 80.0 mm | 2.8 mm | — | — |
| December | 35.0 °C | 29.2 °C | 18.5 °C | 29.4 °C | 24.1 °C | 15.0 °C | 25.4 °C | 18.3 °C | 7.5 °C | 103.5 mm | 1.8 mm | — | — |
Data Visualisations
Remove WatermarksCurrent Year Climate Trends vs Historical


Max Temperature this Year | 1 of 6
Climate 12-Month Moving Averages


Max Temperature 12-Month MA | 1 of 6
Daily Data Points and Averages Throughout the Year


Average Max Temperature Throughout Year | 1 of 5
