Climate for Station: Bintulu, Sarawak, Malaysia
Loading live weather...
Climate Analysis & Overview
Bintulu's climate is experiencing a warming trend, with both high and low temperatures rising over the past decade. While the Precipitation Concentration Index indicates a more even distribution of rainfall, the all-time warming trends suggest a shift towards a warmer climate, consistent with Malaysia's regional climate goals.
Tropical Climate Dynamics
Bintulu, located at coordinates 3.2, 113.033, sits within the tropical rainforest climate zone, classified as "Af" under the Köppen climate classification. This region is characterised by high humidity and significant rainfall throughout the year, influenced by its proximity to the South China Sea. The local geography, with its coastal location and surrounding lush forests, plays a pivotal role in shaping its climatic patterns.
Temperature Trends: A Warming Narrative
The data reveals an all-time warming trend with high temperatures increasing by 0.21°C (0.38°F) and low temperatures by 0.17°C (0.31°F). This trend is echoed in the past decade, where highs have risen by 0.23°C (0.41°F) and lows by 0.05°C (0.09°F). These figures suggest a consistent warming pattern, aligning with Malaysia's broader climate objectives to mitigate temperature rise through sustainable practices. The record high temperature for Bintulu stands at 36.3°C (97.3°F), while the lowest recorded is 18.9°C (66.0°F), underscoring the region's typically warm climate.
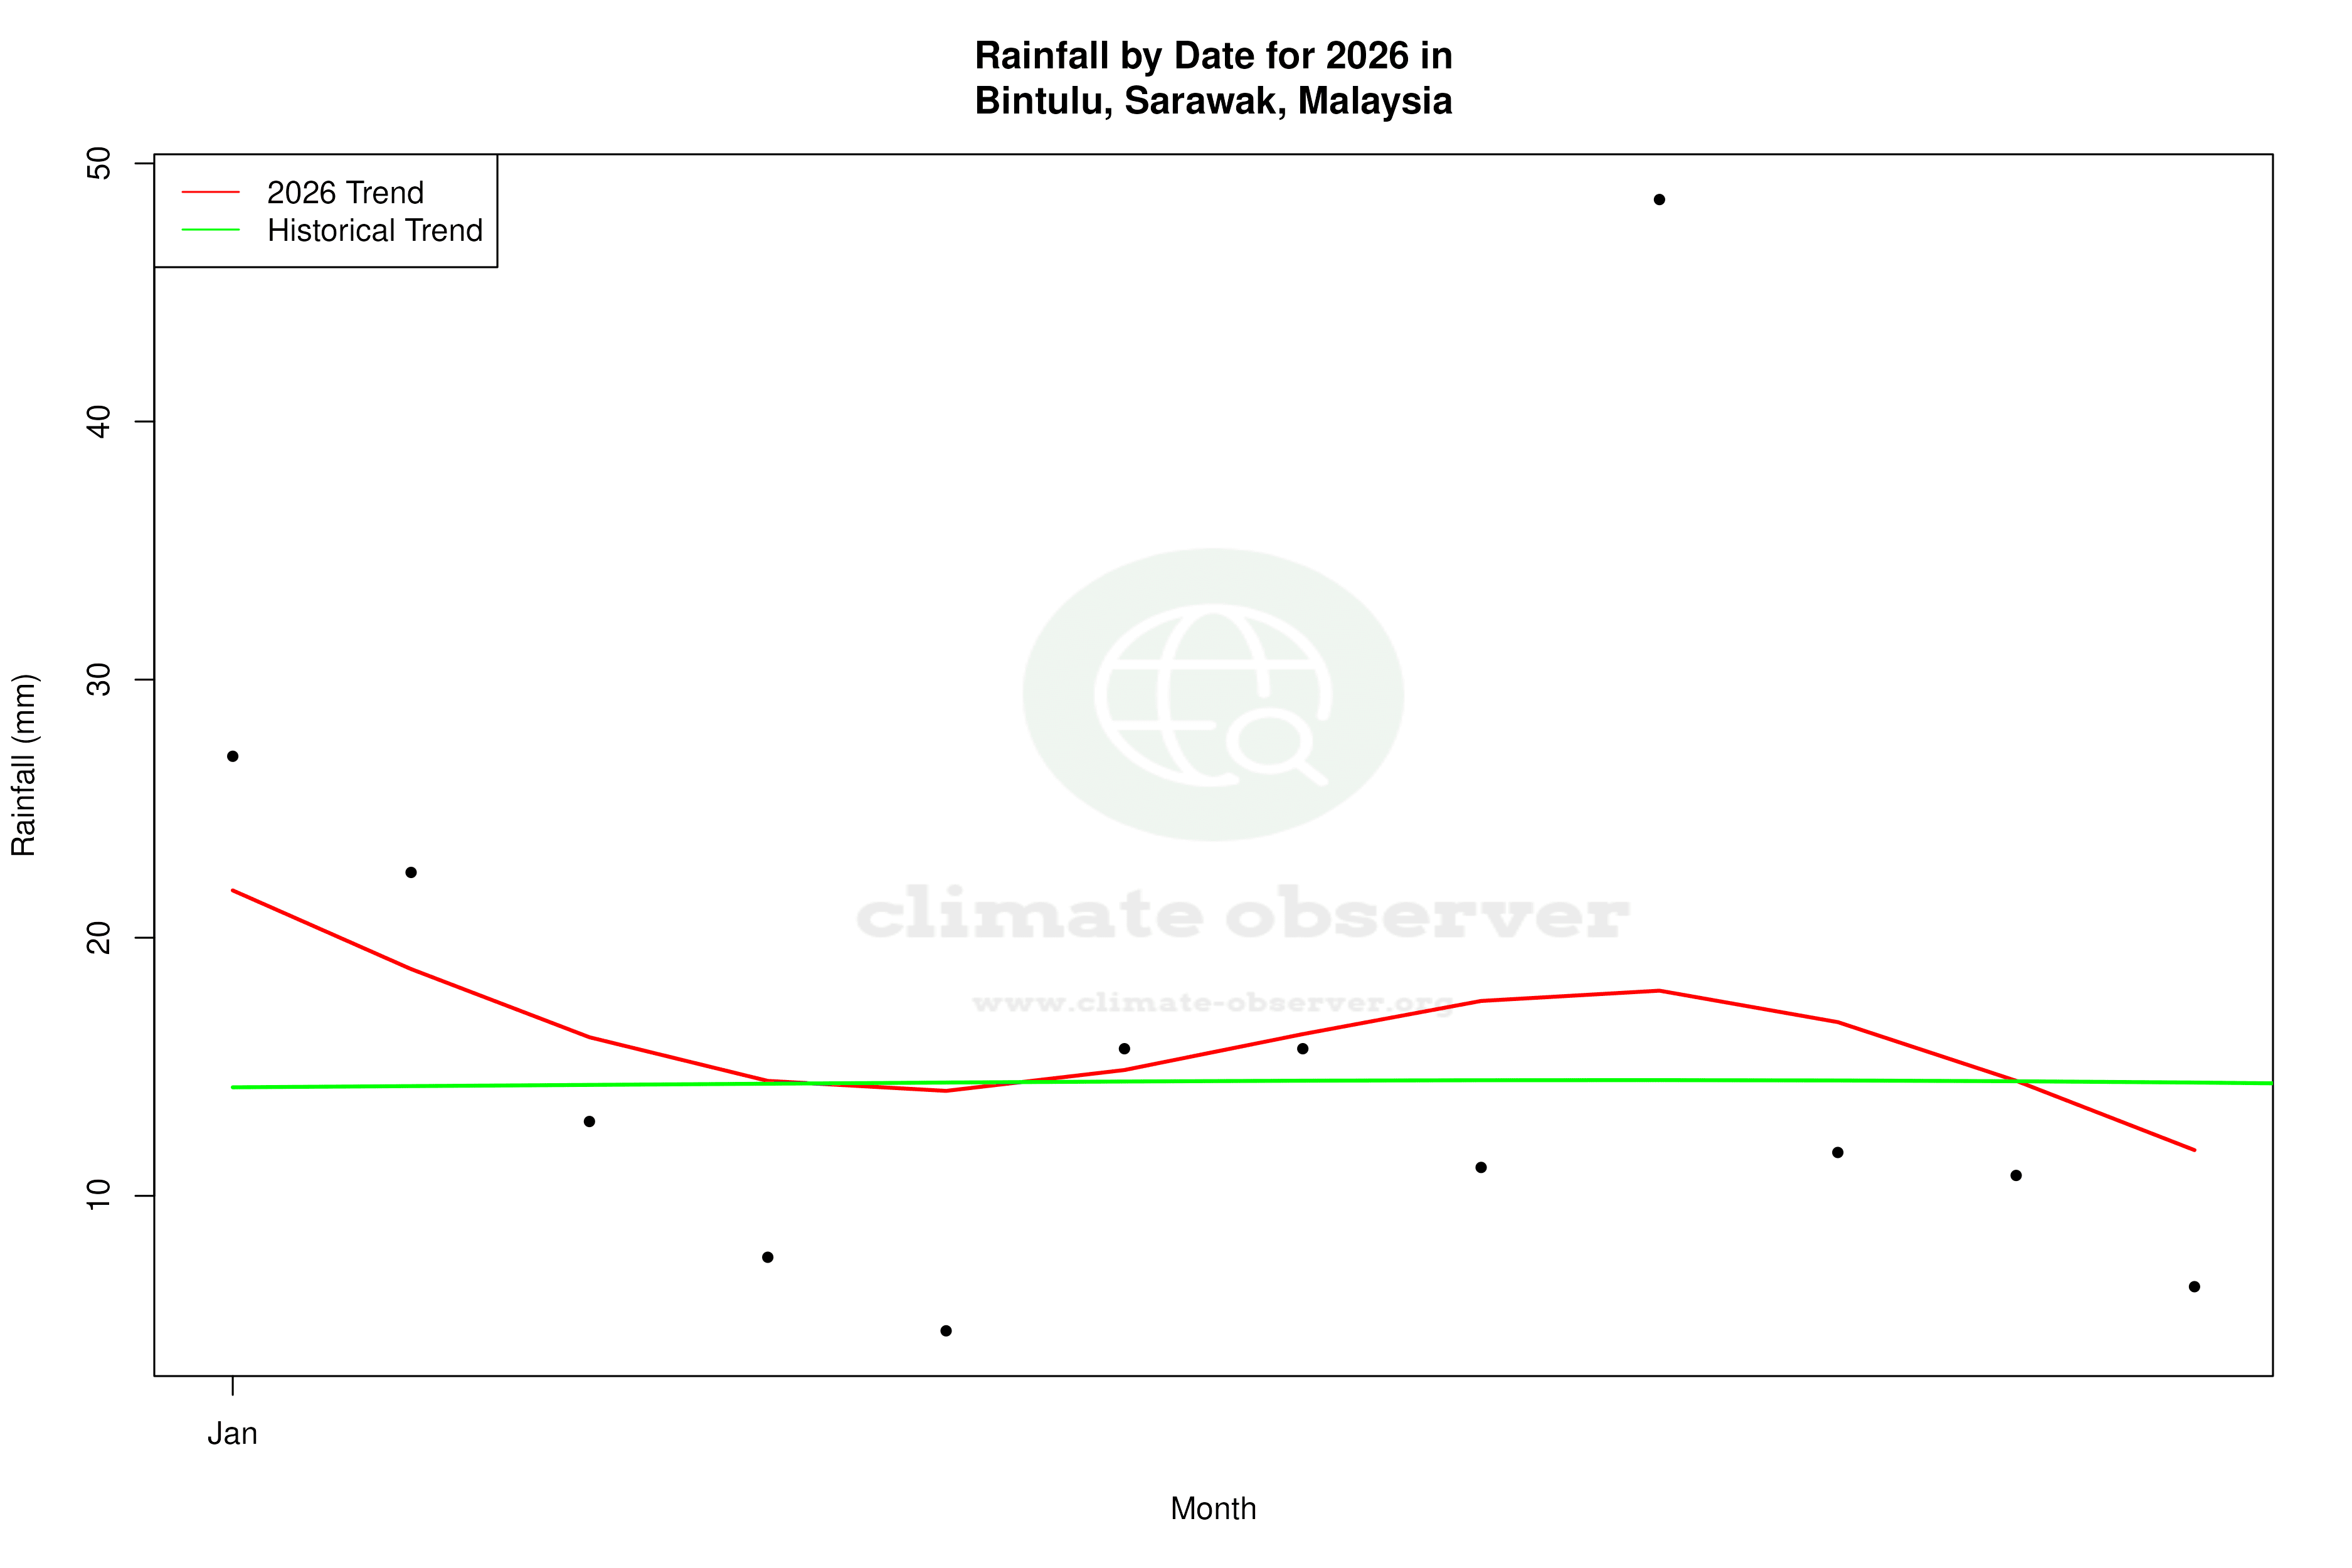
Precipitation Patterns: A Shift Towards Evenness
The Precipitation Concentration Index (PCI) provides insights into rainfall distribution. Bintulu's PCI has decreased from a baseline of 10.99 to a current value of 8.49, indicating a more even distribution of rainfall events. This shift suggests that rainfall is becoming more regular, reducing the likelihood of intense, concentrated downpours. Such changes are crucial for agricultural planning and water resource management in the region.
Regional Climate Goals and Implications
Malaysia's commitment to addressing climate change is reflected in its national policies aimed at reducing greenhouse gas emissions and promoting renewable energy. The warming trends observed in Bintulu are consistent with global patterns, necessitating local adaptation strategies. These include enhancing coastal resilience and promoting sustainable land use to mitigate the impacts of rising temperatures and shifting precipitation patterns.
Local Climate Challenges and Opportunities
Bintulu's climate profile presents both challenges and opportunities. The warming trends may impact local ecosystems and biodiversity, requiring targeted conservation efforts. However, the more even distribution of rainfall could benefit agriculture by providing more predictable growing conditions. As Bintulu continues to develop, integrating climate resilience into urban planning will be essential to safeguard the region's natural and human systems.
Station Statistics
10-Year Trend
High: +0.20 °C/decade
Low: +0.11 °C/decade
Rain: -4.36 mm/decade
25-Year Trend
High: +0.28 °C/decade
Low: +0.17 °C/decade
Rain: -1.32 mm/decade
50-Year Trend
High: +0.24 °C/decade
Low: +0.10 °C/decade
Rain: -0.35 mm/decade
All-Time Trend
High: +0.19 °C/decade
Low: +0.16 °C/decade
Rain: +0.33 mm/decade
Percentage Above-Average Days
Last 12 Months: 57.8%
This Year: 35.0%
Precipitation Concentration Index (PCI) ℹ️
Last 12 Months: 9.7
Historical Average: 11.7
Percentile Rank of Last 12 Months ℹ️
High: 94th percentile
Low: 93rd percentile
Rain: 15th percentile
Change in Variance ℹ️
High: +15.7%
Low: -10.6%
Intraday: +7.9%
Data Coverage
93.0%
First Year of Data
1958
Station Location
Historical Weather Records
| Max High | Avg High | Min High | Max Avg | Avg Avg | Min Avg | Max Low | Avg Low | Min Low | Max Precipitation | Avg Precipitation | Max Snow | Avg Snow | |
|---|---|---|---|---|---|---|---|---|---|---|---|---|---|
| Record | 36.3 °C | — | 24.0 °C | 31.0 °C | — | 22.0 °C | 27.2 °C | — | 18.9 °C | 228.1 mm | — | — | — |
| January | 34.1 °C | 29.9 °C | 24.0 °C | 28.9 °C | 26.2 °C | 22.0 °C | 26.6 °C | 23.3 °C | 18.9 °C | 228.1 mm | 13.6 mm | — | — |
| February | 33.7 °C | 30.1 °C | 24.6 °C | 29.6 °C | 26.4 °C | 22.9 °C | 26.2 °C | 23.3 °C | 19.9 °C | 204.0 mm | 9.0 mm | — | — |
| March | 34.7 °C | 30.8 °C | 25.3 °C | 29.8 °C | 26.8 °C | 23.5 °C | 26.4 °C | 23.6 °C | 19.4 °C | 226.0 mm | 8.0 mm | — | — |
| April | 36.0 °C | 31.5 °C | 26.0 °C | 30.3 °C | 27.2 °C | 24.1 °C | 27.2 °C | 23.8 °C | 21.1 °C | 190.2 mm | 7.9 mm | — | — |
| May | 36.0 °C | 31.9 °C | 26.2 °C | 30.2 °C | 27.4 °C | 23.6 °C | 27.0 °C | 24.0 °C | 21.1 °C | 176.8 mm | 6.9 mm | — | — |
| June | 35.5 °C | 31.8 °C | 25.2 °C | 30.0 °C | 27.2 °C | 23.6 °C | 26.5 °C | 23.6 °C | 20.0 °C | 170.9 mm | 7.7 mm | — | — |
| July | 35.8 °C | 31.7 °C | 25.6 °C | 30.0 °C | 27.0 °C | 23.3 °C | 27.0 °C | 23.4 °C | 20.6 °C | 192.0 mm | 7.6 mm | — | — |
| August | 36.3 °C | 31.6 °C | 26.6 °C | 31.0 °C | 27.0 °C | 23.7 °C | 26.2 °C | 23.4 °C | 20.6 °C | 138.0 mm | 8.7 mm | — | — |
| September | 36.0 °C | 31.4 °C | 26.0 °C | 29.8 °C | 26.8 °C | 22.9 °C | 26.2 °C | 23.4 °C | 20.6 °C | 152.0 mm | 9.3 mm | — | — |
| October | 35.0 °C | 31.1 °C | 25.1 °C | 29.6 °C | 26.7 °C | 23.0 °C | 26.0 °C | 23.4 °C | 21.1 °C | 205.0 mm | 10.6 mm | — | — |
| November | 34.2 °C | 30.8 °C | 25.6 °C | 29.7 °C | 26.6 °C | 23.1 °C | 25.8 °C | 23.4 °C | 21.1 °C | 174.0 mm | 12.8 mm | — | — |
| December | 34.7 °C | 30.5 °C | 25.0 °C | 28.9 °C | 26.4 °C | 23.3 °C | 25.5 °C | 23.4 °C | 20.0 °C | 211.3 mm | 13.3 mm | — | — |
Data Visualisations
Remove WatermarksCurrent Year Climate Trends vs Historical


Max Temperature this Year | 1 of 6
Climate 12-Month Moving Averages
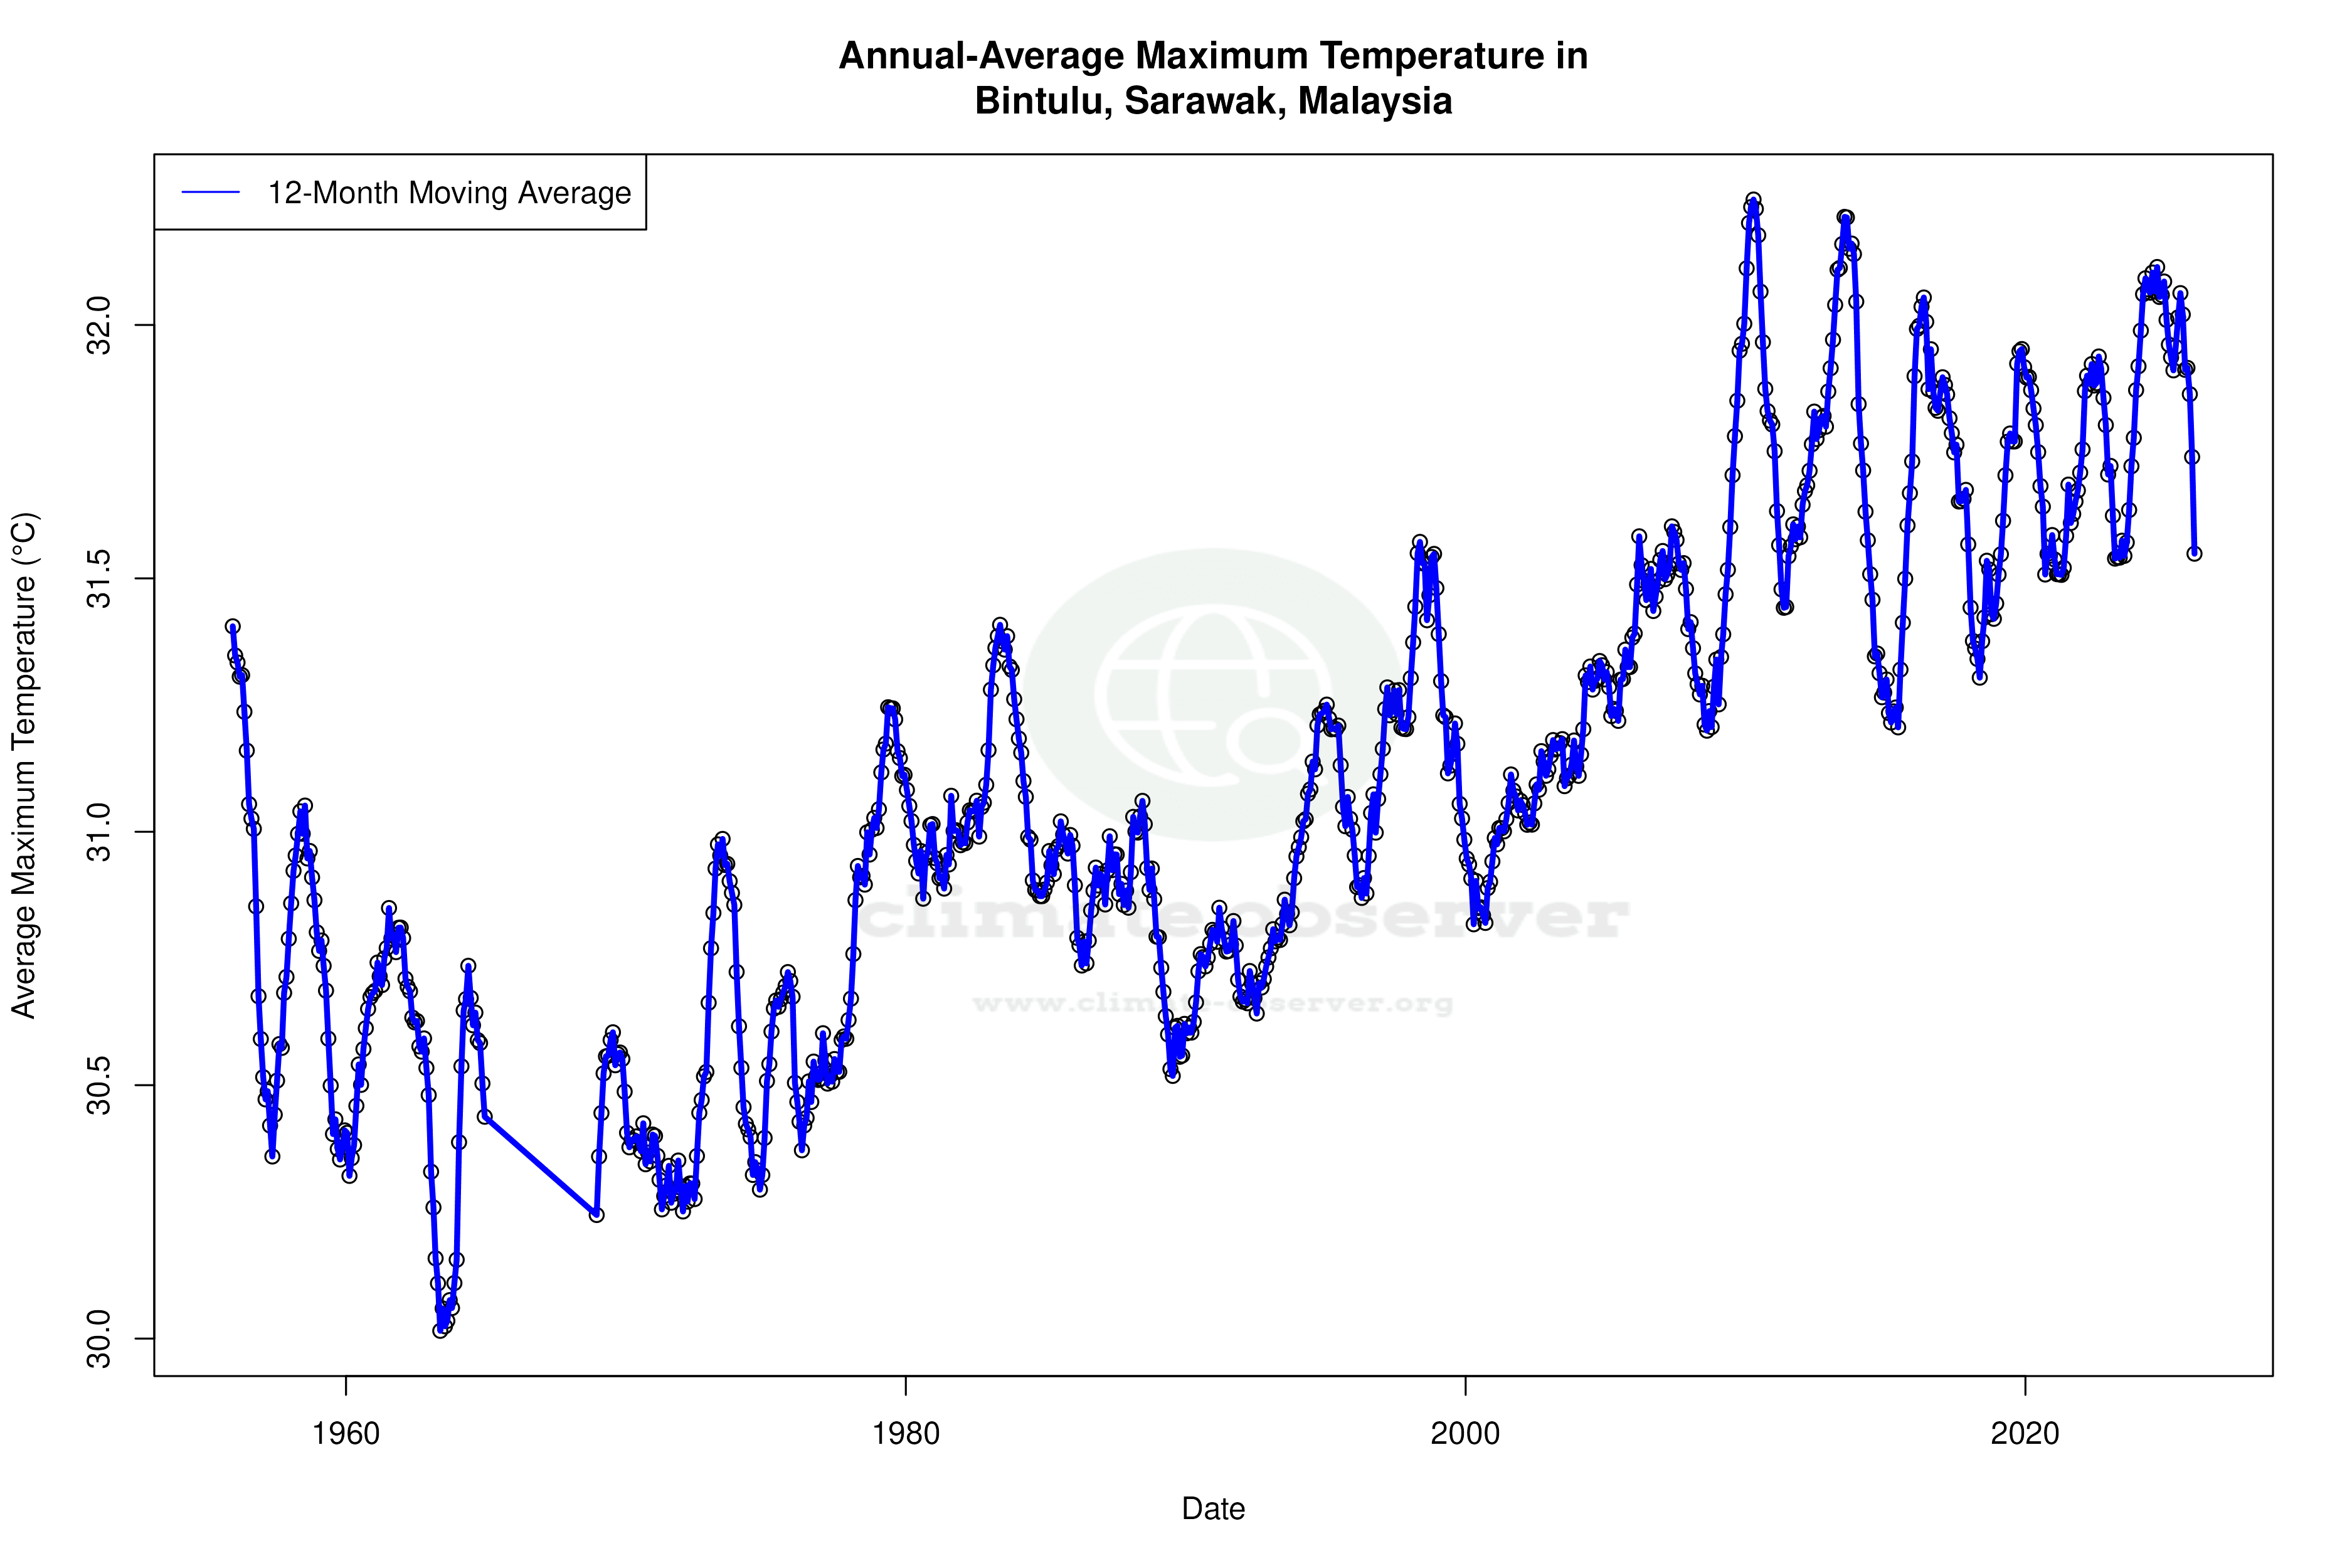
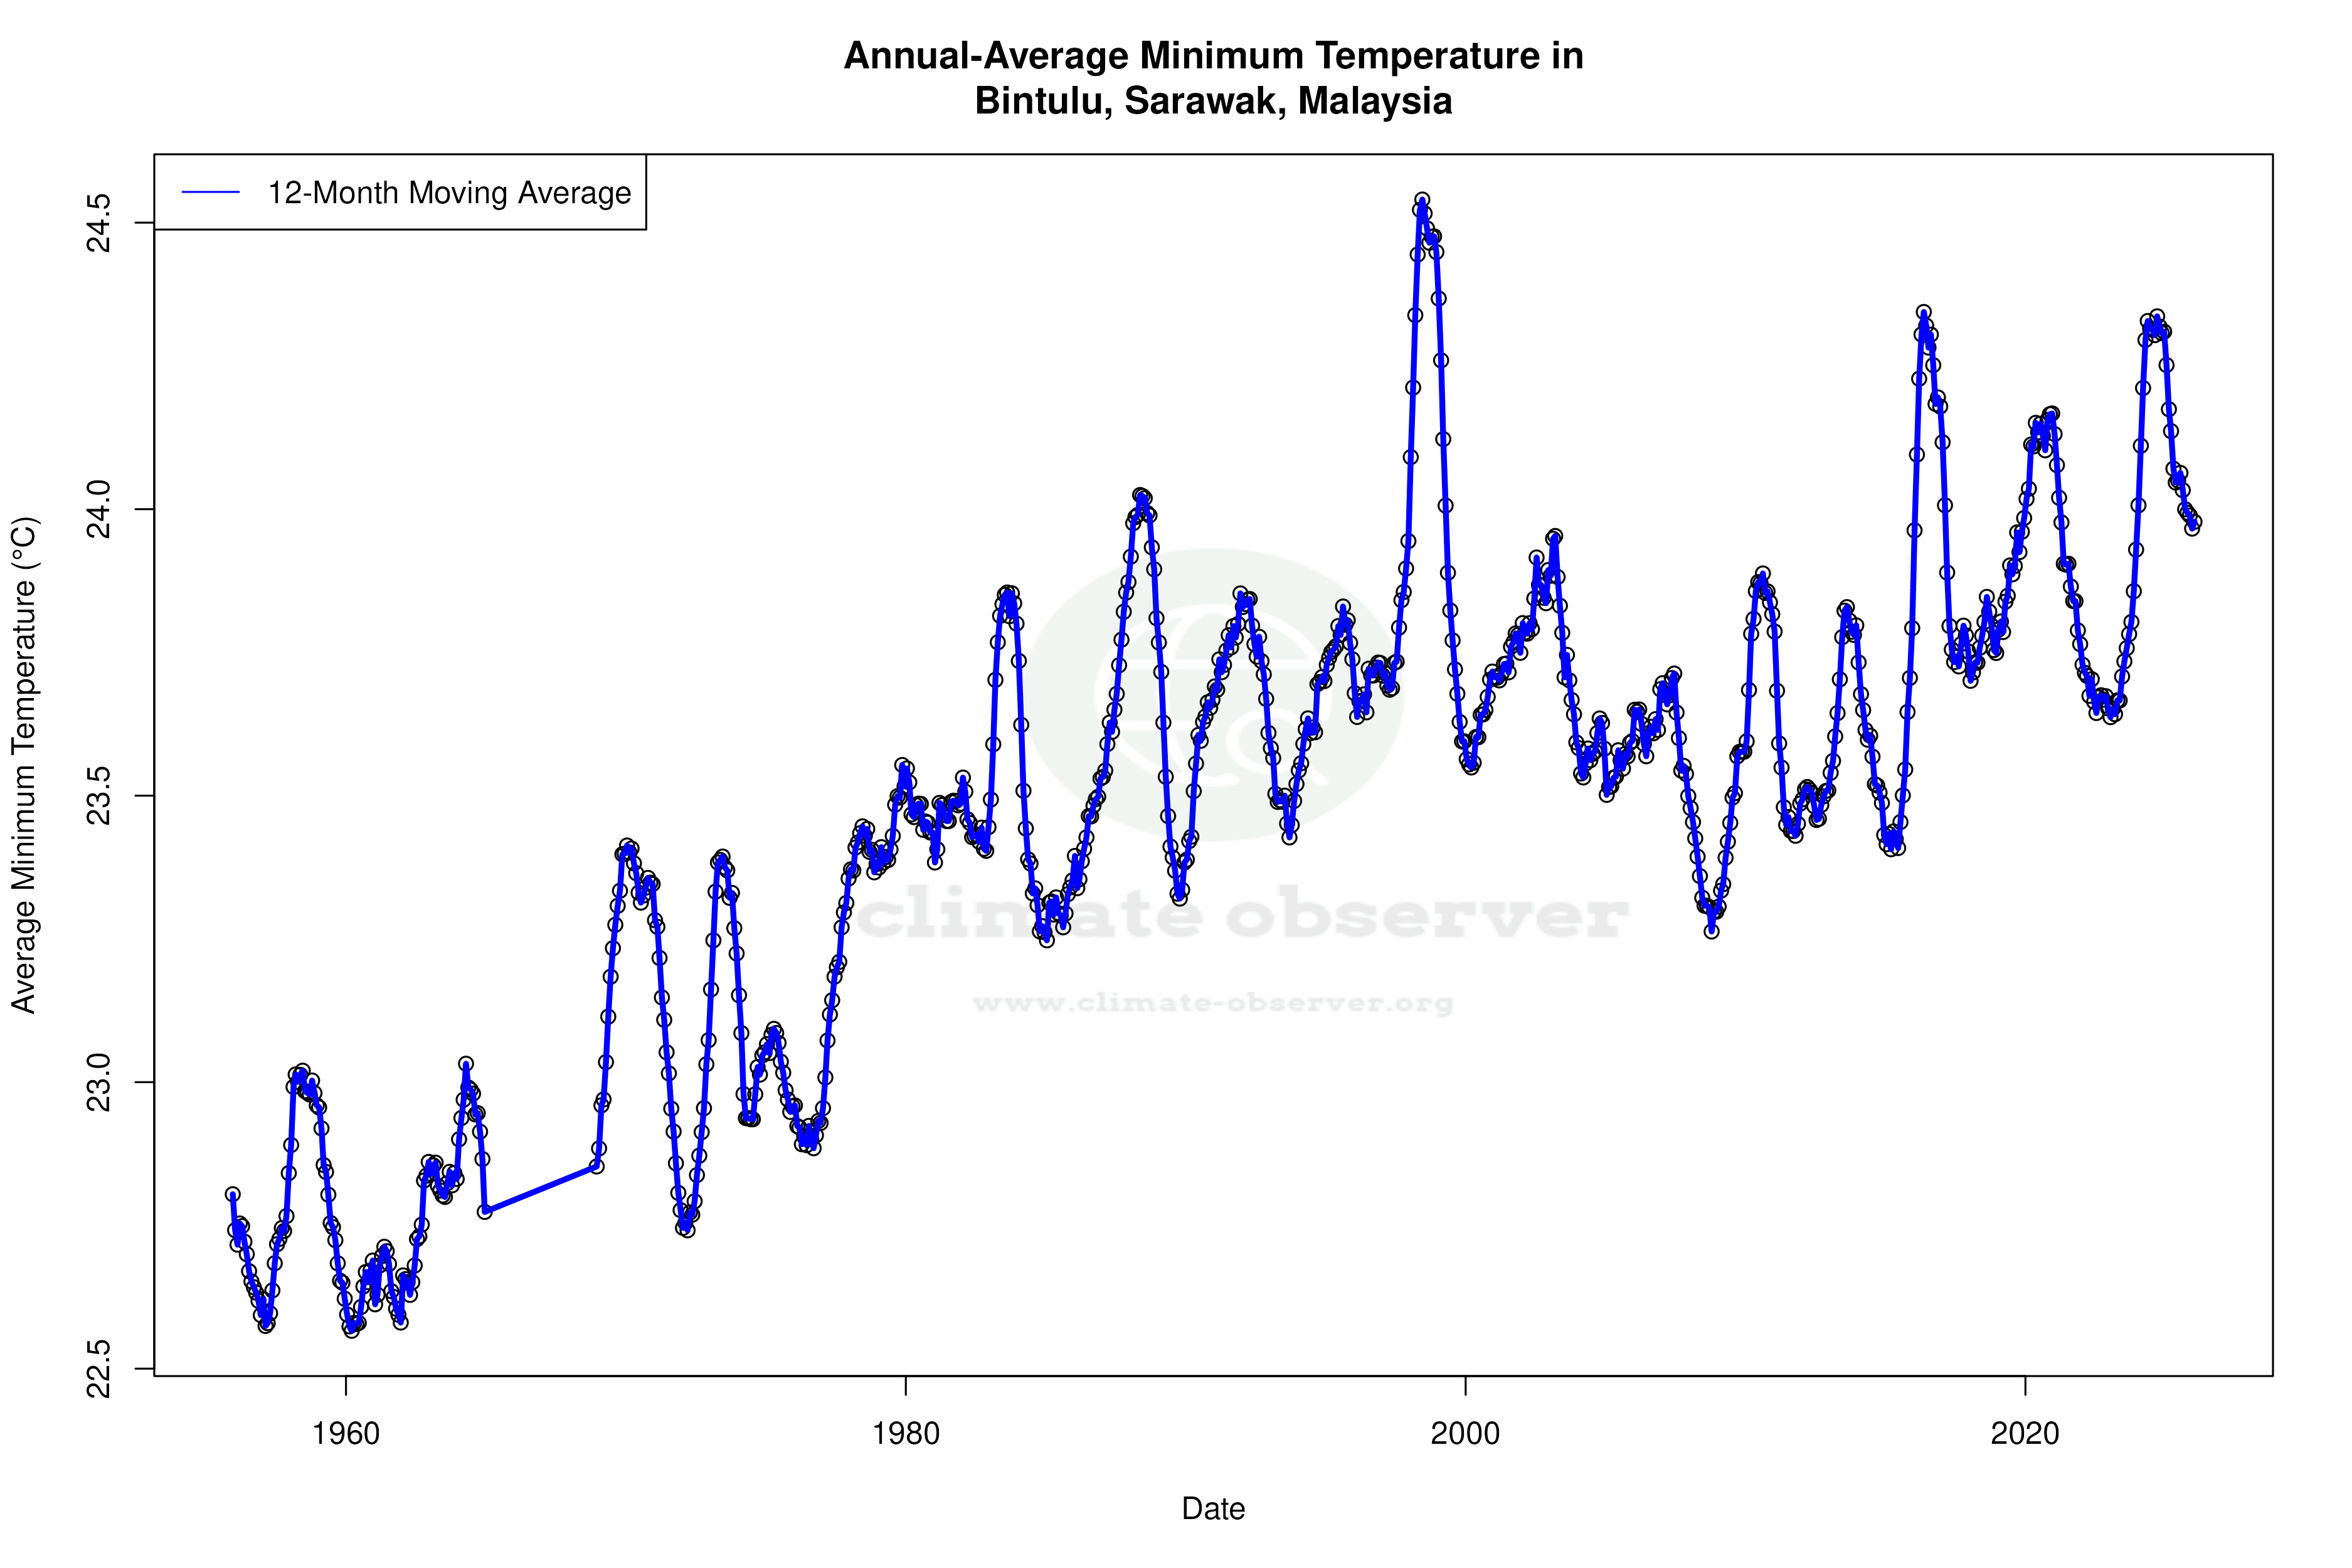


Max Temperature 12-Month MA | 1 of 6
Daily Data Points and Averages Throughout the Year


Average Max Temperature Throughout Year | 1 of 5
