Climate for Station: Labuan, Malaysia
Loading live weather...
Climate Analysis & Overview
Labuan's climate is experiencing a nuanced shift with a slight warming trend over the long term, contrasted by a recent cooling in the past decade. Precipitation patterns have become more evenly distributed, indicating a subtle change in local weather dynamics.
Tropical Maritime Climate
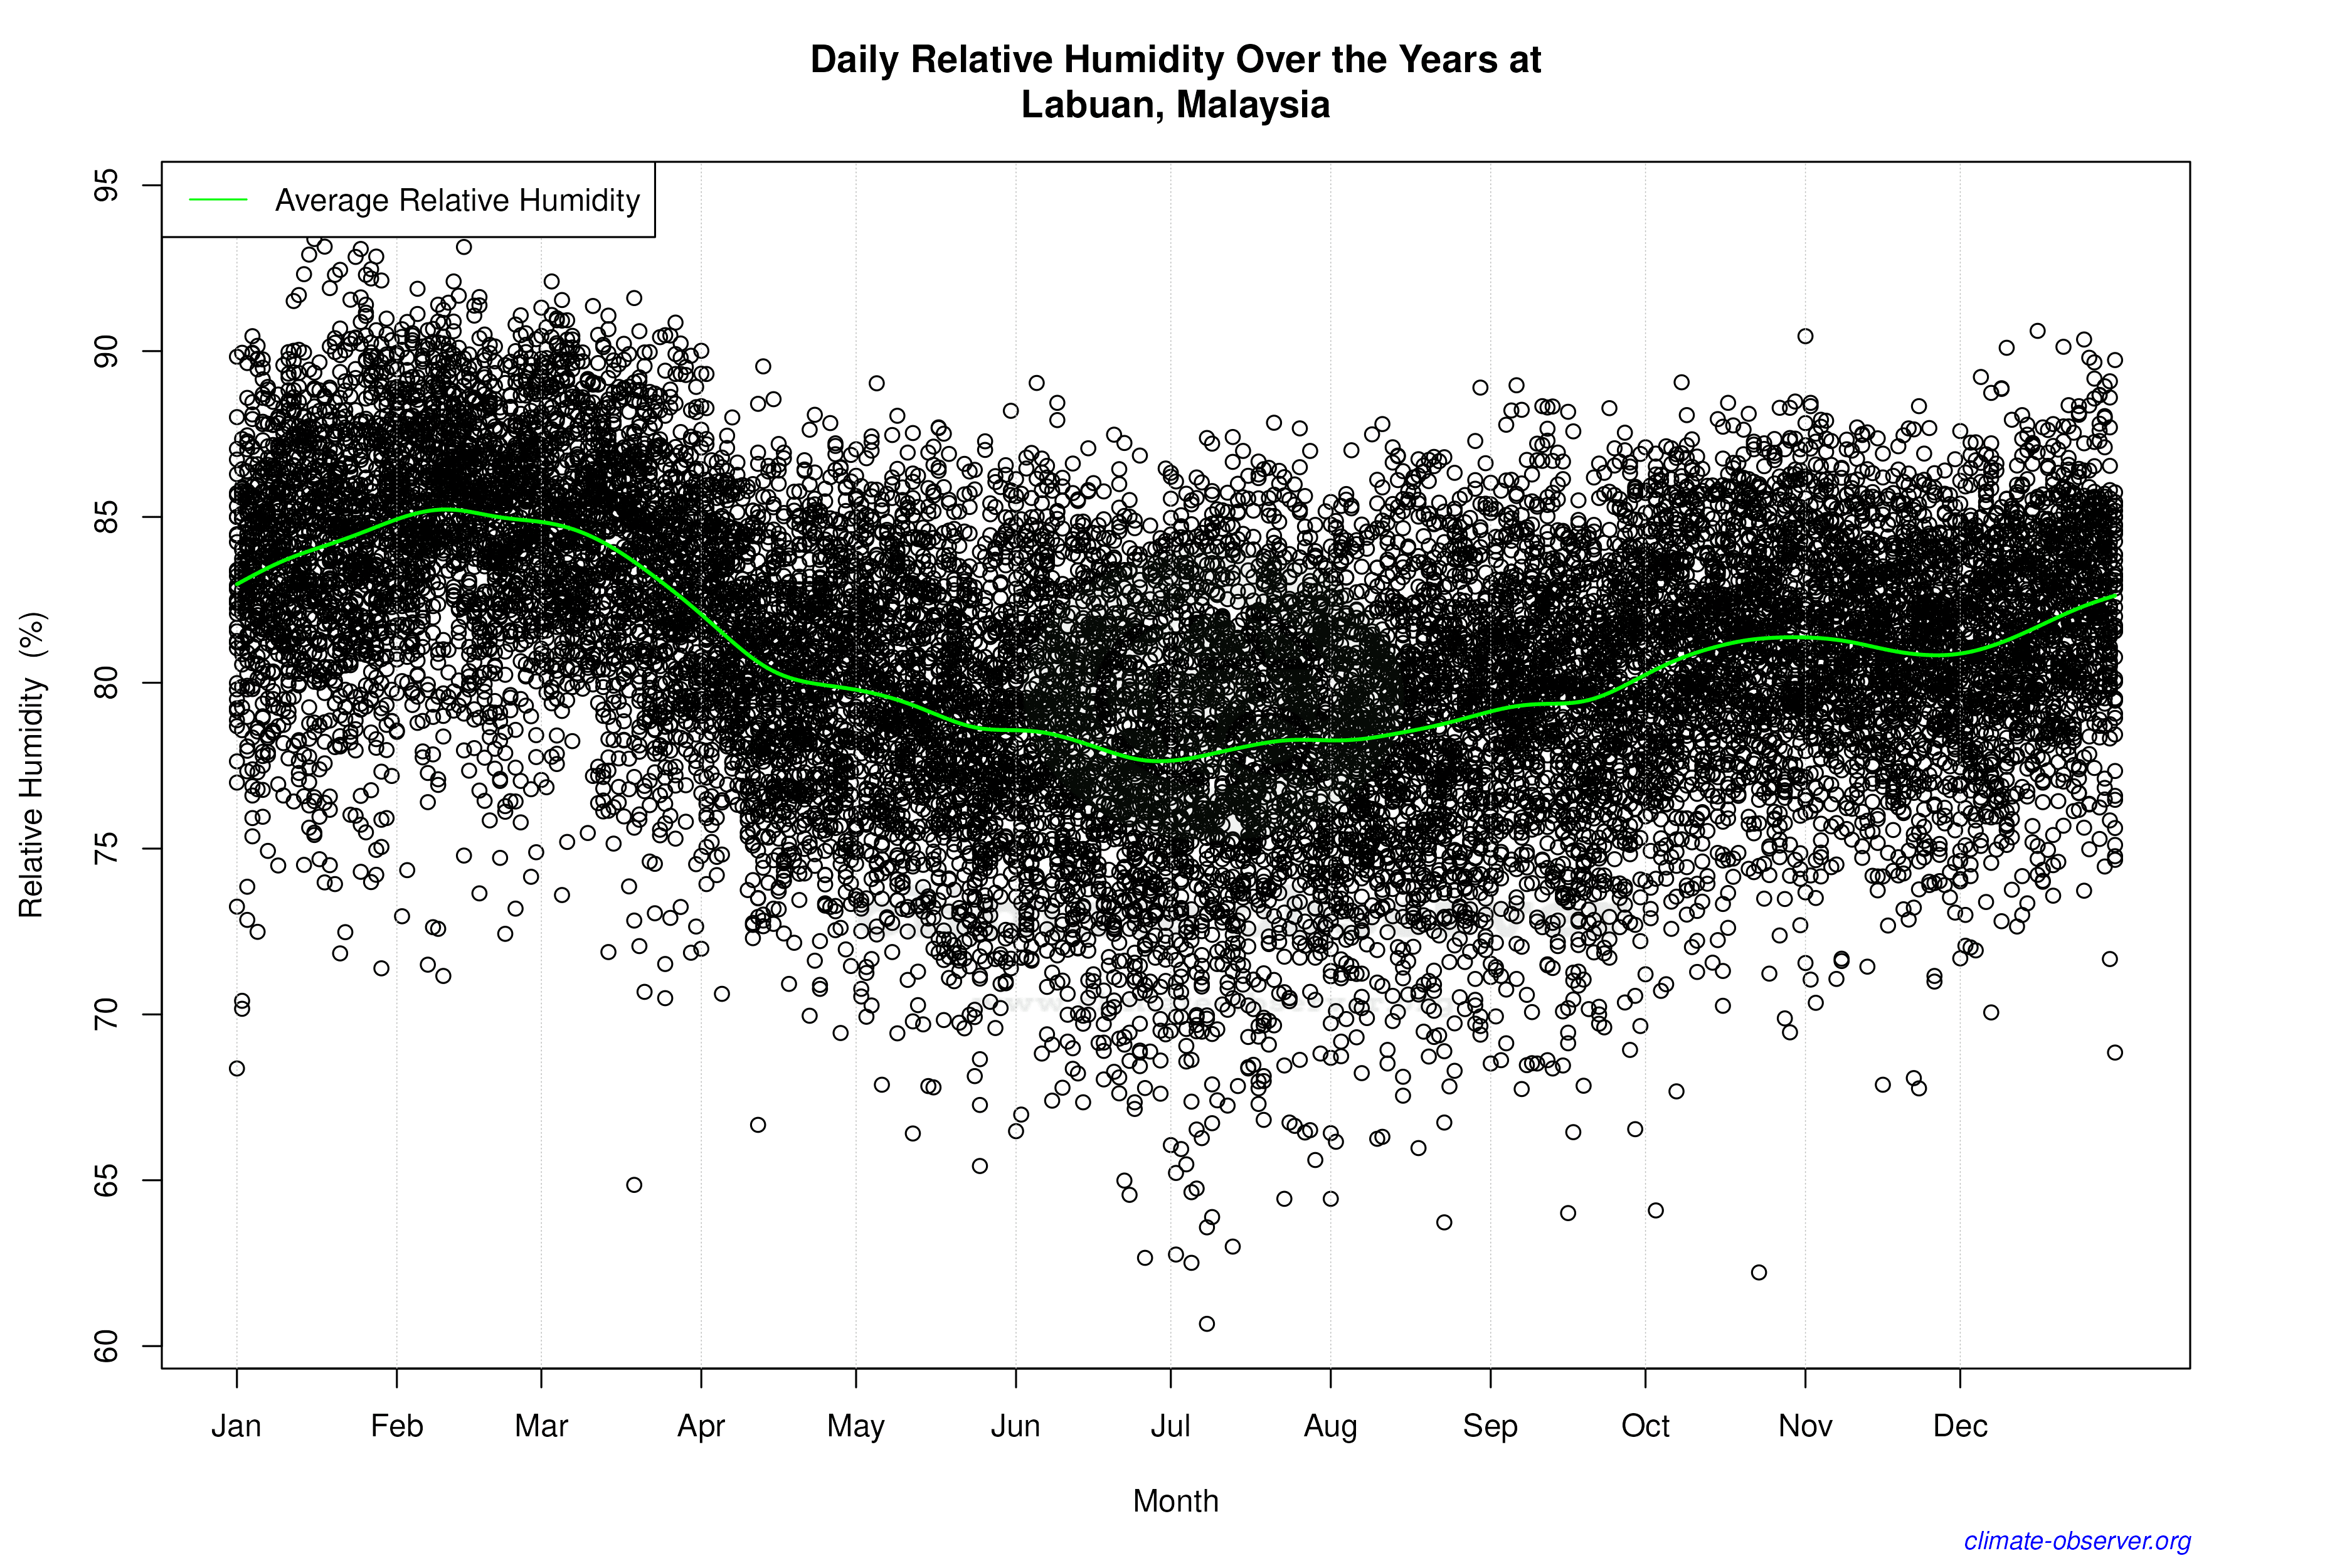
Labuan, located at 5.3°N, 115.25°E, is characterised by a tropical rainforest climate under the Köppen classification. This maritime climate is heavily influenced by its proximity to the South China Sea, which moderates temperature fluctuations and contributes to high humidity levels. The region's geographical positioning ensures a relatively stable climate, with temperatures rarely reaching extremes. The all-time temperature records reflect this stability, with a maximum of 37.0°C (98.6°F) and a minimum of 19.3°C (66.7°F).
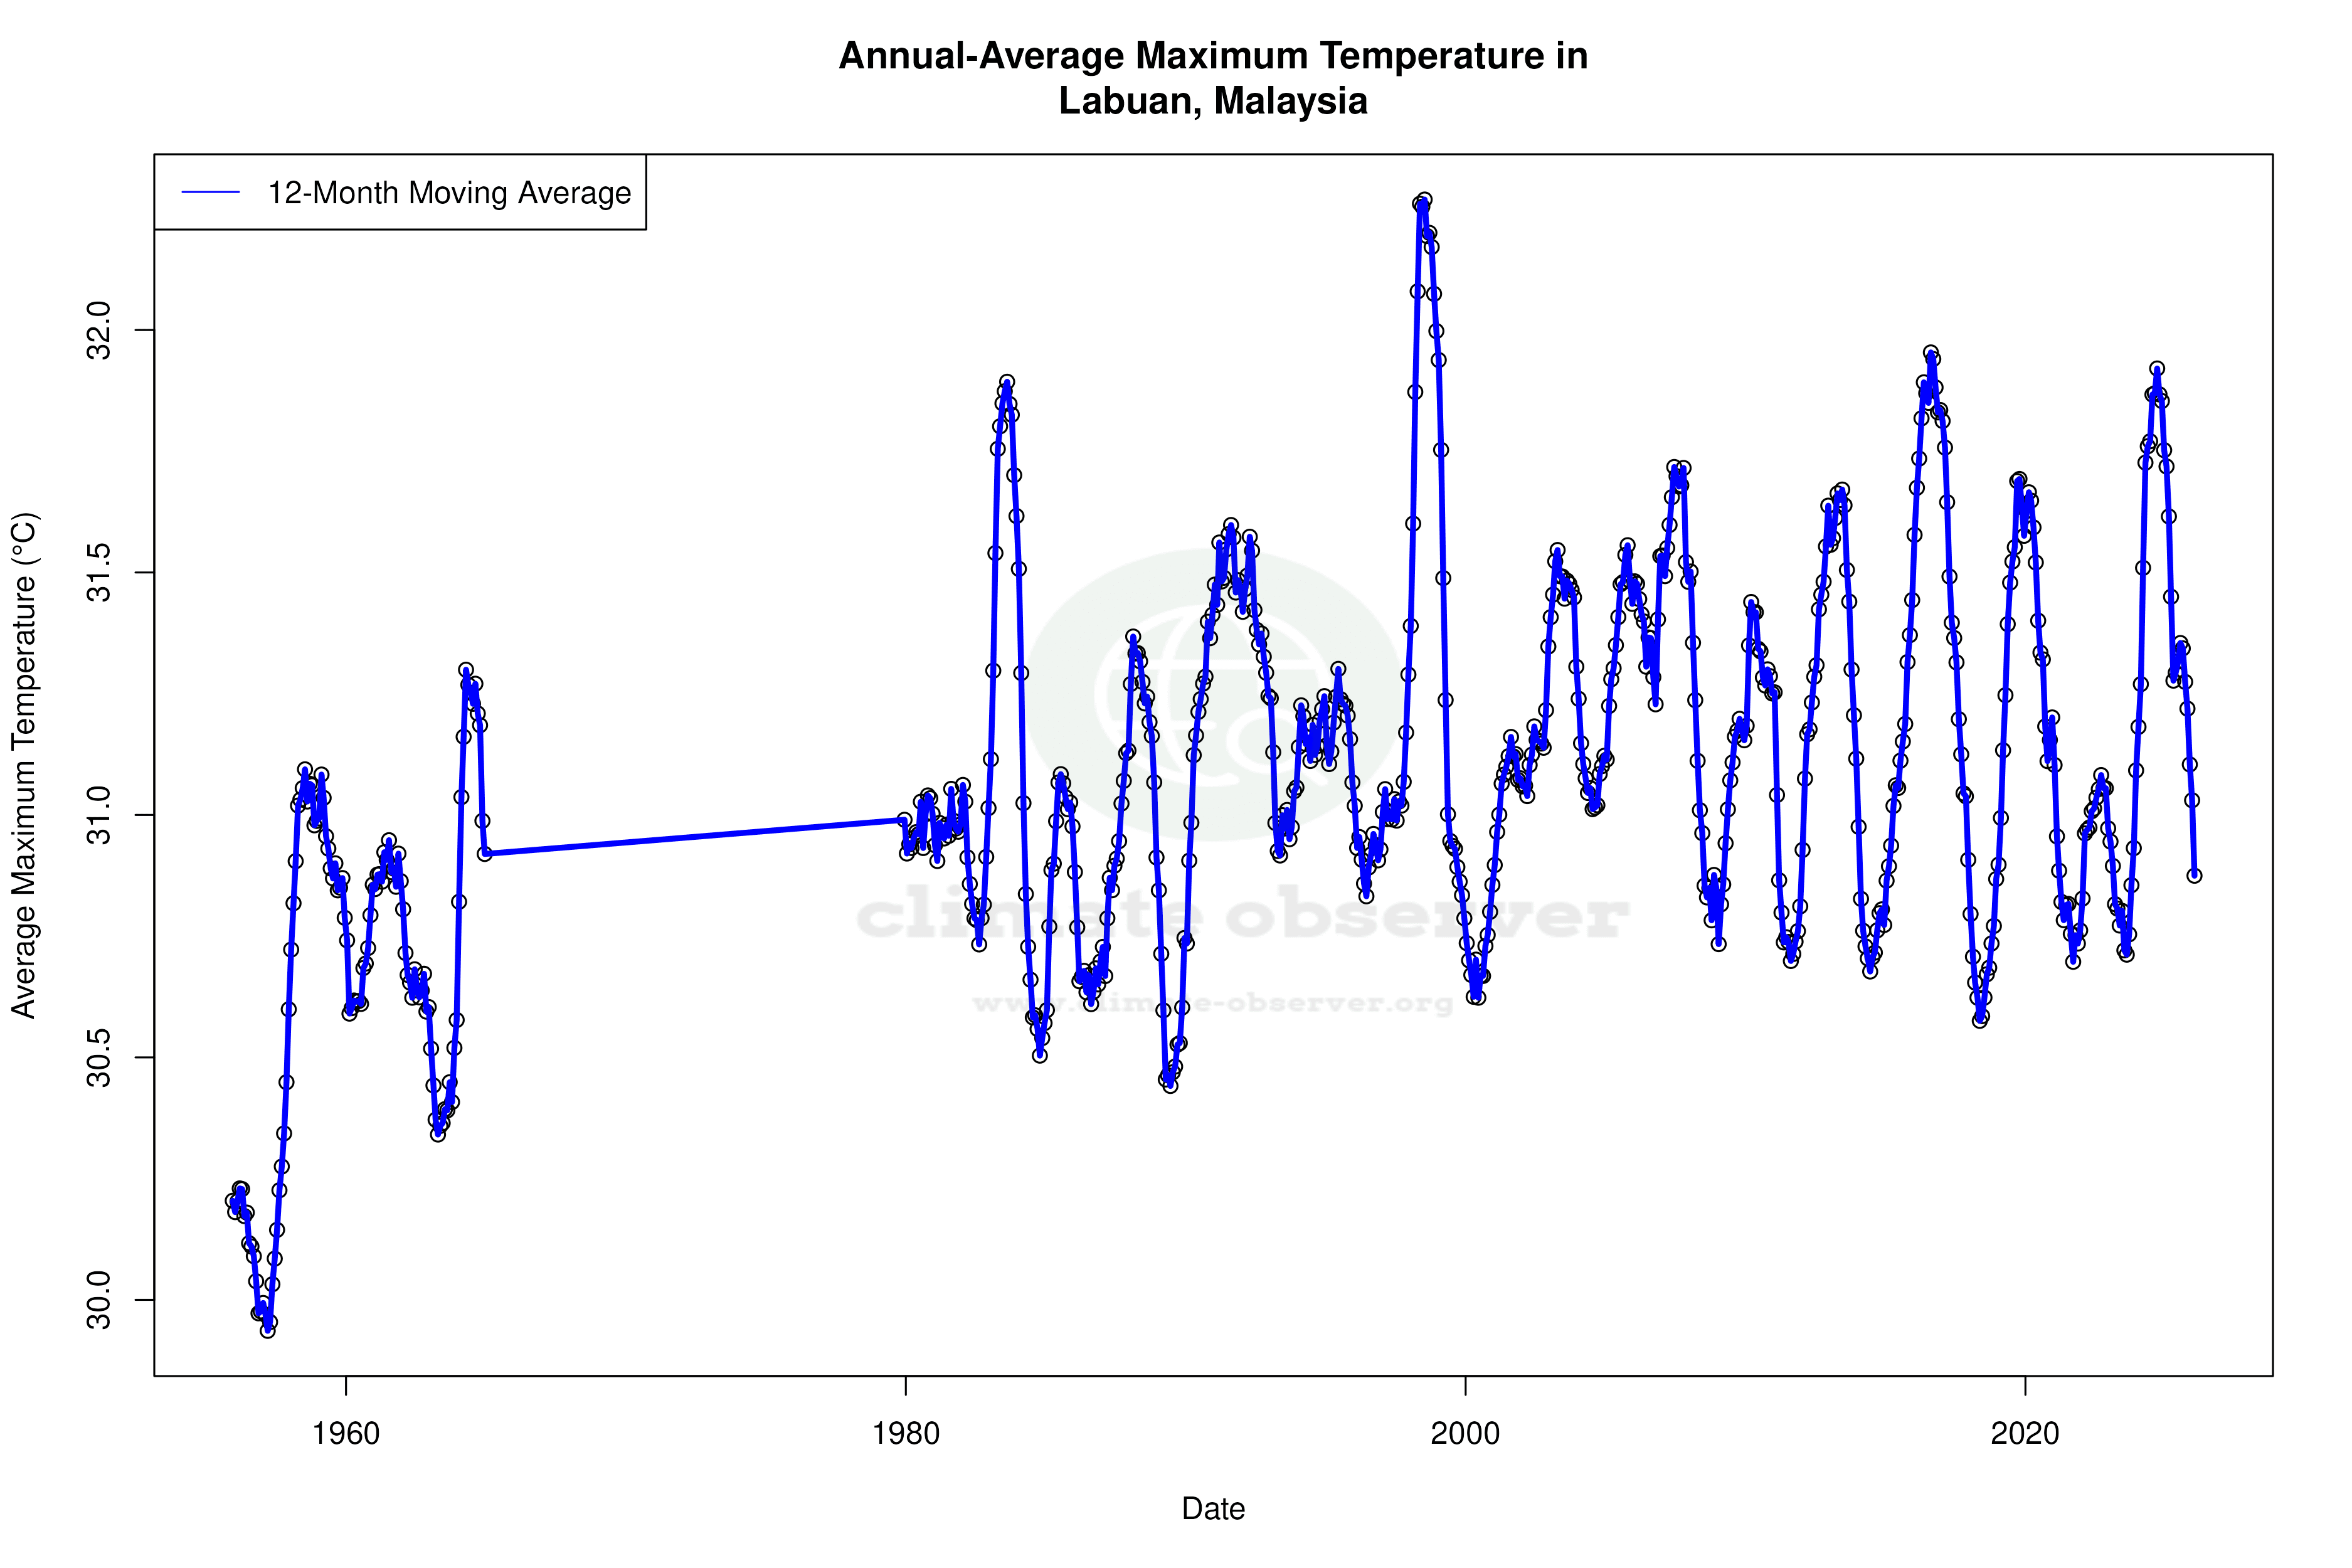
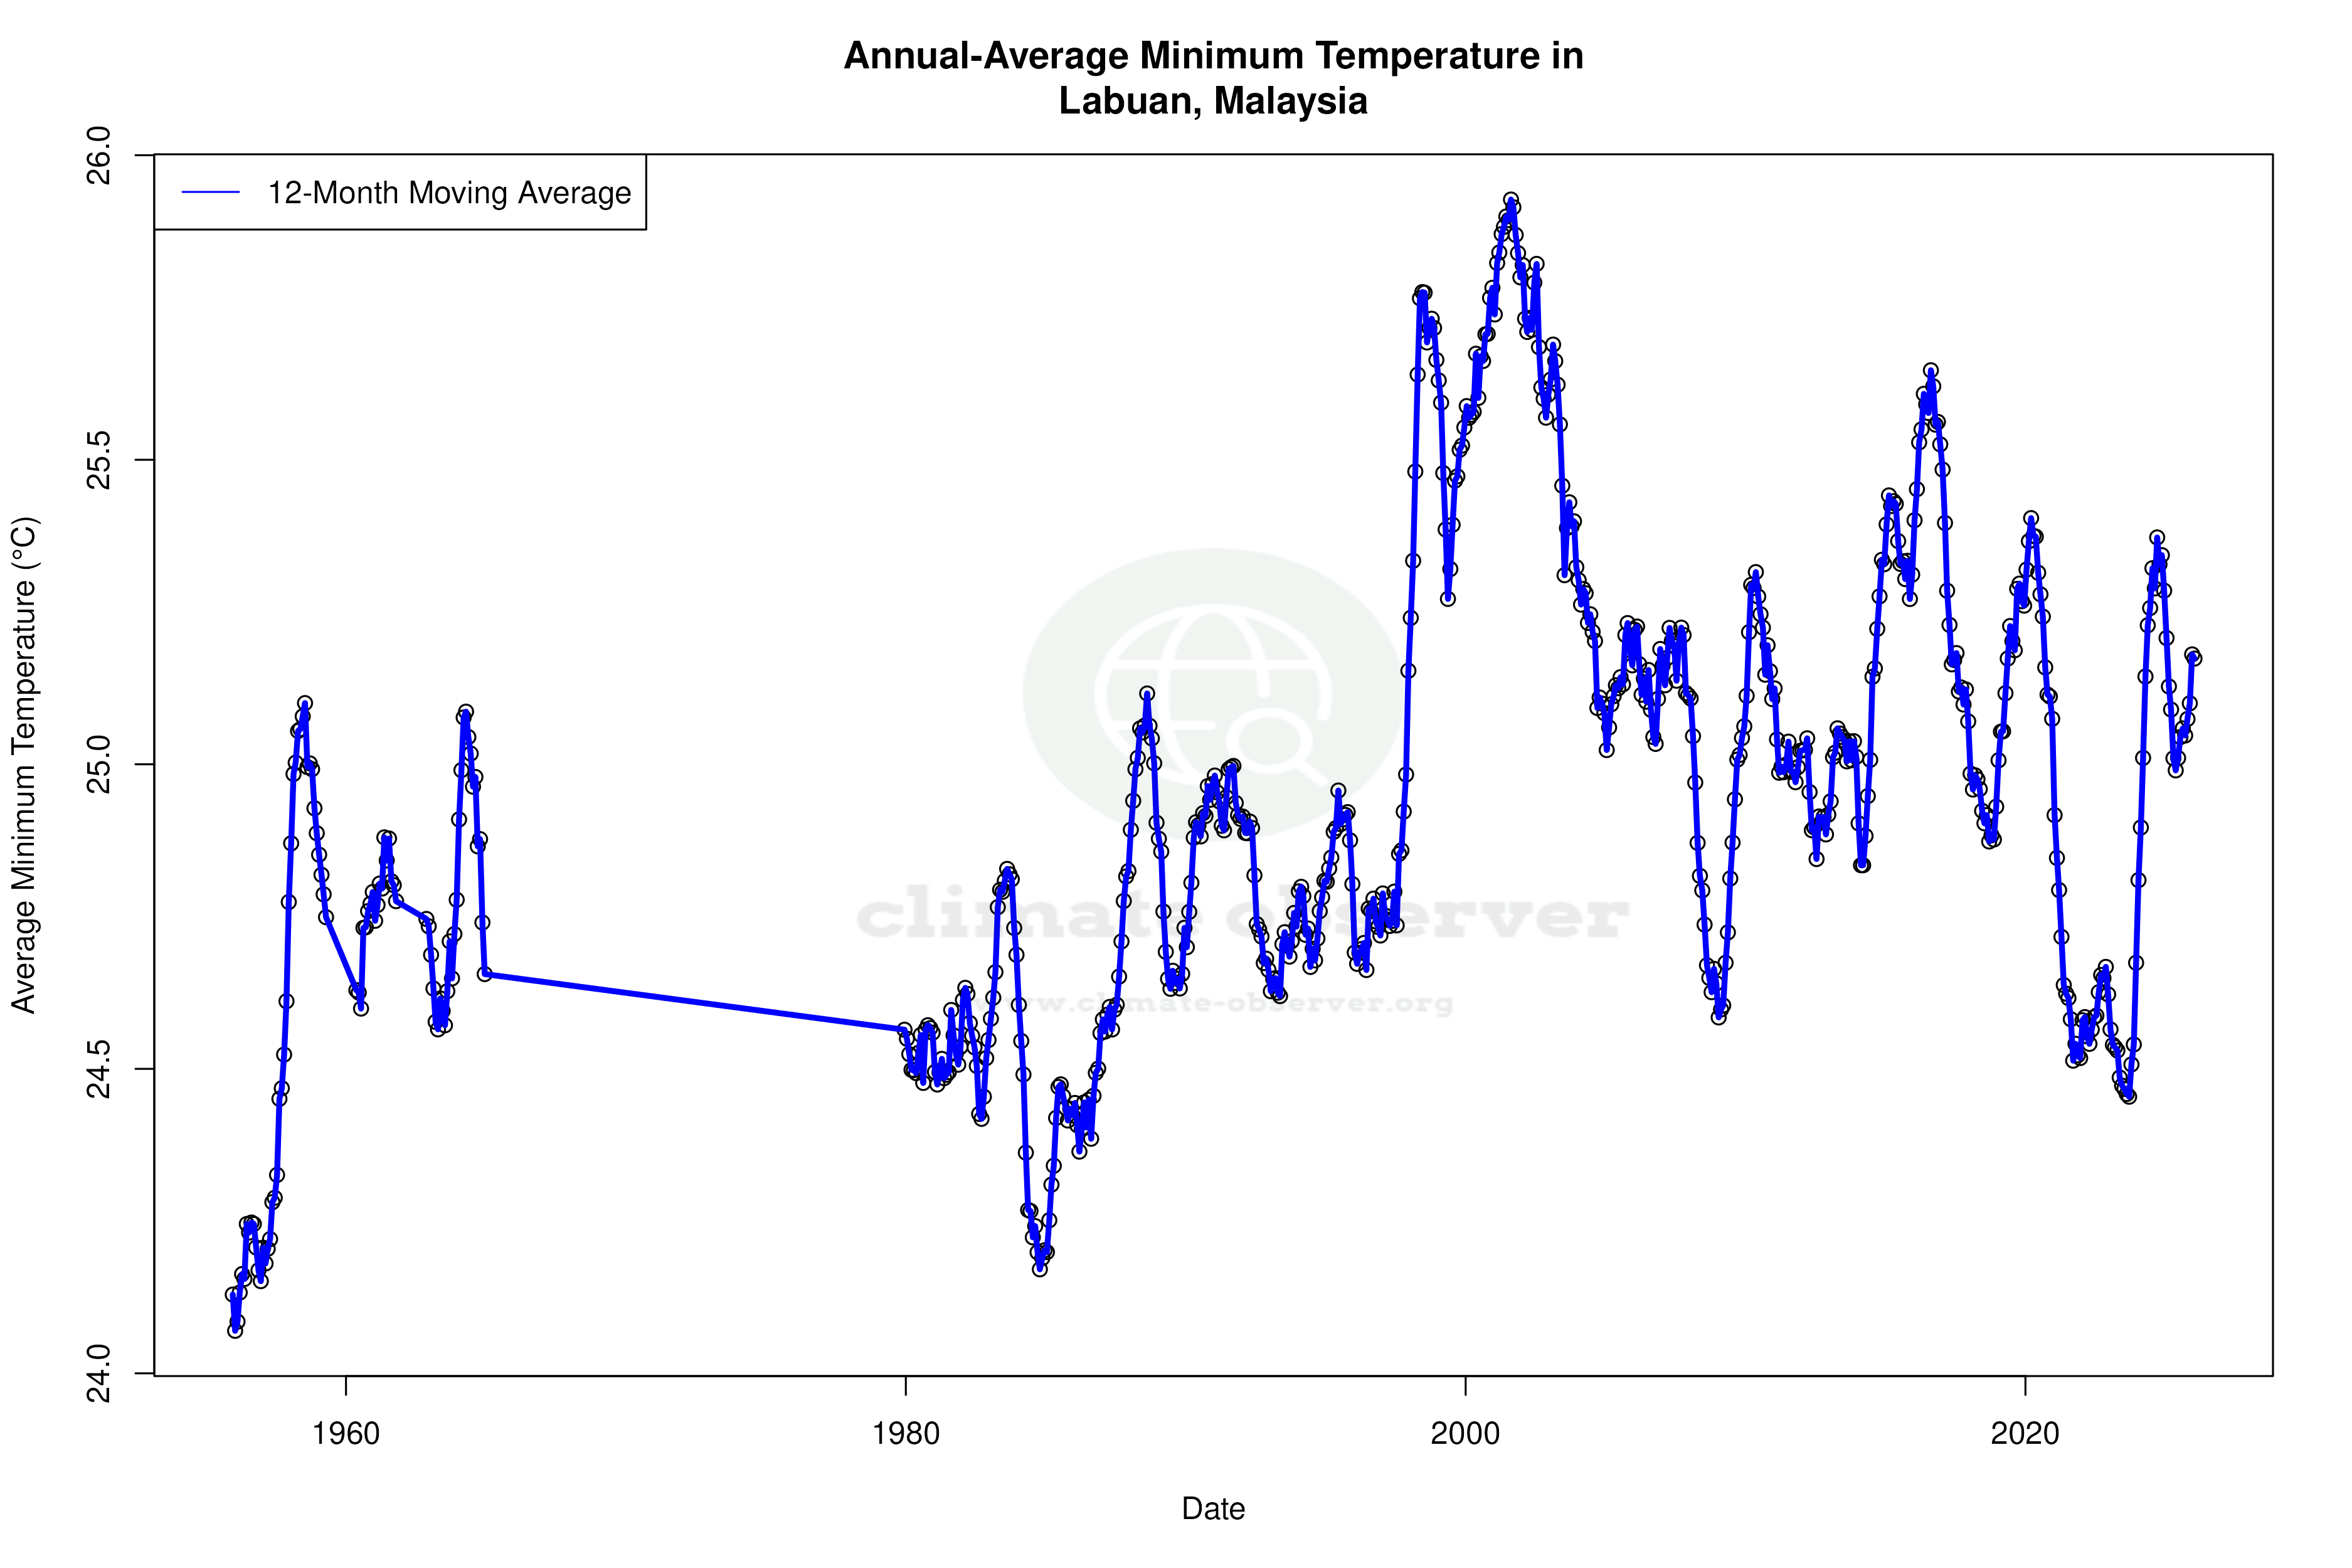
Temperature Trends: A Tale of Two Intervals
In the context of temperature trends, Labuan presents an intriguing dichotomy. Over the past decade, there has been a noticeable cooling trend, with high temperatures decreasing by 0.16°C (0.29°F) and low temperatures by 0.50°C (0.90°F). This recent cooling contrasts with the all-time data, which shows a slight warming trend of 0.09°C (0.16°F) for both highs and lows. This suggests a complex interaction of local and broader climatic factors affecting Labuan, potentially influenced by regional climate initiatives aimed at mitigating temperature rise.
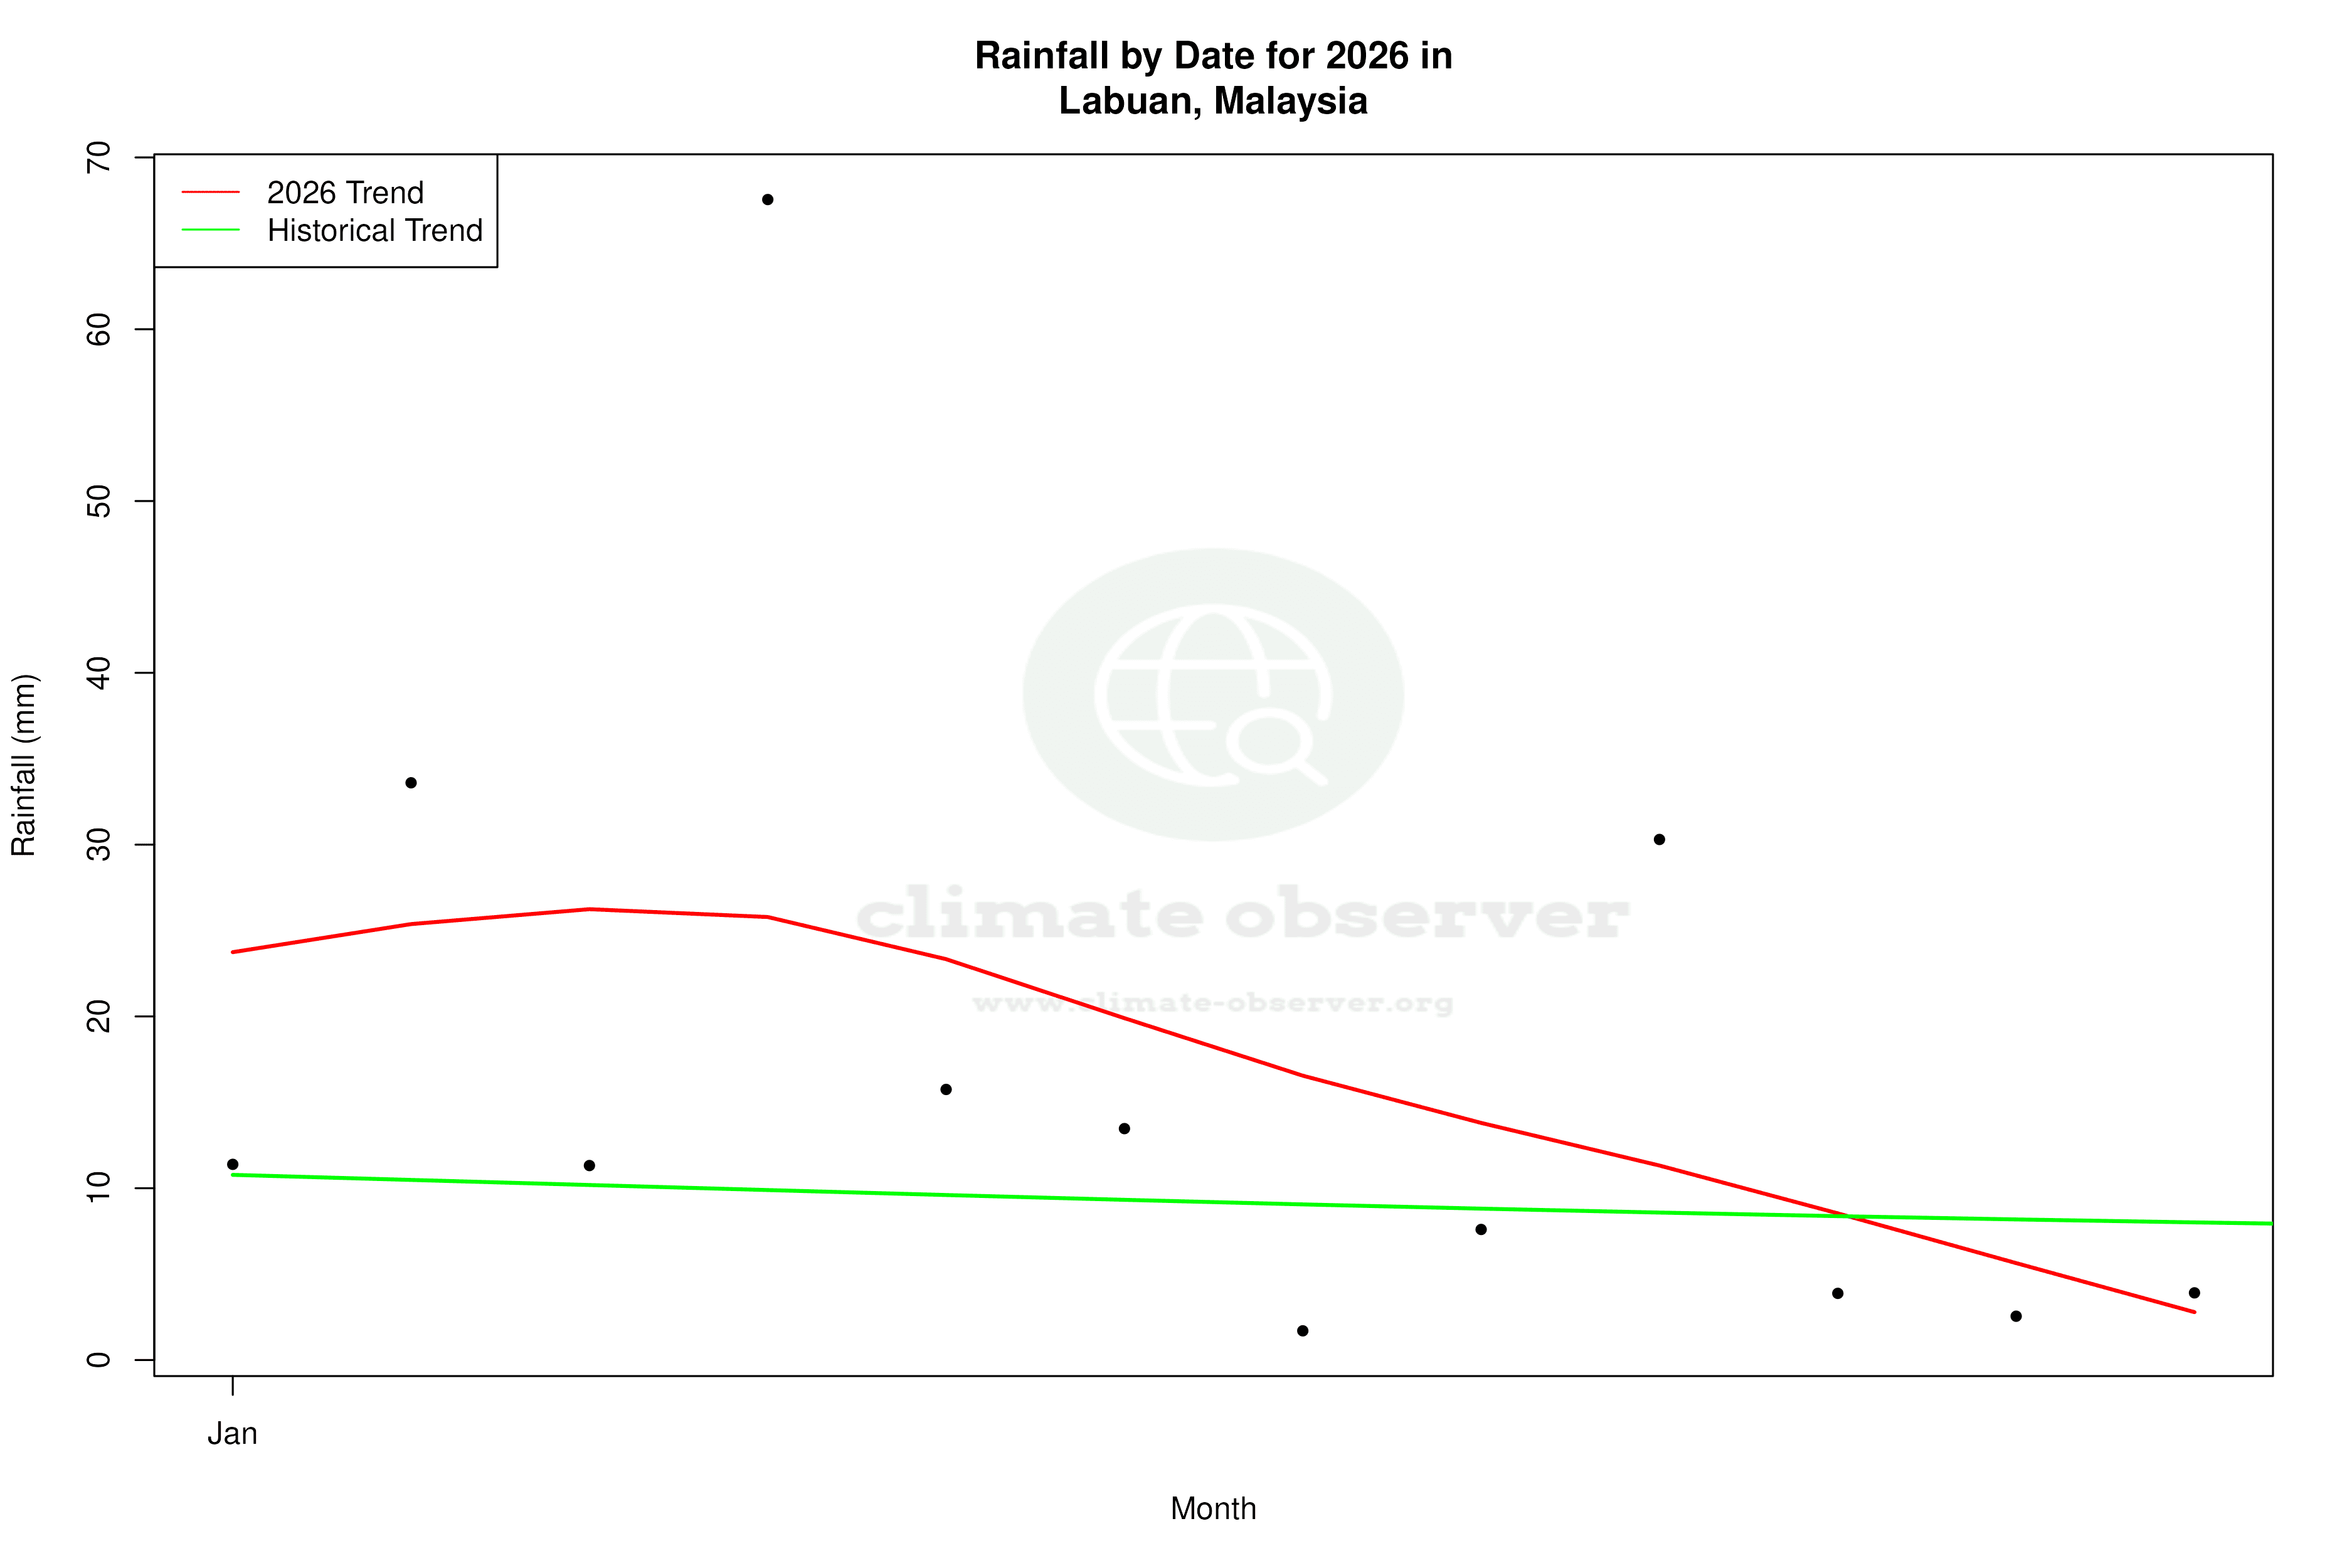
Precipitation Patterns: A Shift Towards Evenness
The Precipitation Concentration Index (PCI) offers insight into how rainfall is distributed throughout the year. Labuan's PCI has decreased from a baseline of 11.2 to a current value of 9.2, indicating a more even distribution of precipitation. This change suggests that rainfall events are becoming less concentrated and more evenly spread across the year, reducing the likelihood of extreme precipitation events. Such a shift could be beneficial in mitigating the risks associated with heavy rainfall, such as flooding.
Regional Climate Context
Malaysia's broader climate goals, which include reducing greenhouse gas emissions and enhancing climate resilience, provide a backdrop to Labuan's climate data. The observed trends align with national efforts to manage climate impacts, particularly in coastal and island regions like Labuan. Recent weather events, such as increased rainfall during monsoon seasons, highlight the importance of understanding and adapting to these subtle climatic shifts.
Implications for Future Monitoring
The nuanced climate profile of Labuan underscores the importance of continued monitoring and analysis. While the all-time warming trend suggests a gradual rise in temperatures, the recent cooling over the past decade highlights the variability inherent in climate systems. As Malaysia continues to pursue its climate goals, Labuan's data will be crucial in assessing the effectiveness of regional strategies and informing future climate resilience measures.
Station Statistics
10-Year Trend
High: -0.18 °C/decade
Low: -0.47 °C/decade
Rain: +0.10 mm/decade
25-Year Trend
High: -0.03 °C/decade
Low: -0.21 °C/decade
Rain: -0.36 mm/decade
50-Year Trend
High: +0.05 °C/decade
Low: +0.11 °C/decade
Rain: -0.18 mm/decade
All-Time Trend
High: +0.09 °C/decade
Low: +0.09 °C/decade
Rain: -0.30 mm/decade
Percentage Above-Average Days
Last 12 Months: 43.0%
This Year: 5.0%
Precipitation Concentration Index (PCI) ℹ️
Last 12 Months: 11.8
Historical Average: 12.5
Percentile Rank of Last 12 Months ℹ️
High: 70th percentile
Low: 67th percentile
Rain: 51st percentile
Change in Variance ℹ️
High: -0.8%
Low: -19.4%
Intraday: -3.5%
Data Coverage
78.9%
First Year of Data
1955
Station Location
Historical Weather Records
| Max High | Avg High | Min High | Max Avg | Avg Avg | Min Avg | Max Low | Avg Low | Min Low | Max Precipitation | Avg Precipitation | Max Snow | Avg Snow | |
|---|---|---|---|---|---|---|---|---|---|---|---|---|---|
| Record | 37.0 °C | — | 24.4 °C | 31.6 °C | — | 22.8 °C | 29.7 °C | — | 19.3 °C | 320.0 mm | — | — | — |
| January | 34.0 °C | 30.0 °C | 24.4 °C | 29.5 °C | 27.1 °C | 23.3 °C | 28.4 °C | 24.8 °C | 21.0 °C | 320.0 mm | 7.7 mm | — | — |
| February | 35.3 °C | 30.2 °C | 25.6 °C | 29.7 °C | 27.0 °C | 22.8 °C | 27.4 °C | 24.7 °C | 21.0 °C | 111.0 mm | 4.3 mm | — | — |
| March | 37.0 °C | 31.3 °C | 26.7 °C | 30.6 °C | 27.6 °C | 24.6 °C | 28.2 °C | 25.0 °C | 20.8 °C | 124.0 mm | 4.3 mm | — | — |
| April | 36.6 °C | 31.9 °C | 26.9 °C | 31.1 °C | 28.2 °C | 24.9 °C | 29.0 °C | 25.4 °C | 21.7 °C | 140.0 mm | 7.0 mm | — | — |
| May | 35.7 °C | 31.8 °C | 26.8 °C | 31.6 °C | 28.4 °C | 24.7 °C | 29.7 °C | 25.4 °C | 20.4 °C | 152.0 mm | 9.8 mm | — | — |
| June | 34.9 °C | 31.5 °C | 26.1 °C | 31.1 °C | 28.1 °C | 23.9 °C | 28.9 °C | 25.1 °C | 20.0 °C | 189.5 mm | 10.1 mm | — | — |
| July | 35.0 °C | 31.2 °C | 25.7 °C | 30.3 °C | 27.9 °C | 24.0 °C | 29.4 °C | 24.9 °C | 19.3 °C | 175.0 mm | 9.6 mm | — | — |
| August | 35.0 °C | 31.4 °C | 26.0 °C | 30.6 °C | 28.0 °C | 24.3 °C | 29.0 °C | 24.9 °C | 21.2 °C | 237.5 mm | 10.1 mm | — | — |
| September | 35.0 °C | 31.1 °C | 26.1 °C | 30.6 °C | 27.8 °C | 24.2 °C | 28.6 °C | 24.7 °C | 21.0 °C | 215.6 mm | 10.7 mm | — | — |
| October | 34.4 °C | 30.8 °C | 25.0 °C | 30.4 °C | 27.6 °C | 24.0 °C | 28.7 °C | 24.7 °C | 21.5 °C | 228.6 mm | 12.6 mm | — | — |
| November | 34.7 °C | 30.8 °C | 26.1 °C | 30.4 °C | 27.6 °C | 24.1 °C | 28.6 °C | 24.7 °C | 21.9 °C | 185.0 mm | 12.1 mm | — | — |
| December | 34.4 °C | 30.6 °C | 24.4 °C | 30.6 °C | 27.5 °C | 23.4 °C | 28.6 °C | 24.9 °C | 21.7 °C | 193.3 mm | 10.4 mm | — | — |
Data Visualisations
Remove WatermarksCurrent Year Climate Trends vs Historical


Max Temperature this Year | 1 of 6
Climate 12-Month Moving Averages


Max Temperature 12-Month MA | 1 of 6
Daily Data Points and Averages Throughout the Year


Average Max Temperature Throughout Year | 1 of 5
