Climate for Station: Lichinga, Niassa, Mozambique
Loading live weather...
Climate Analysis & Overview
Lichinga's climate is characterised by a complex interplay of cooling trends over the past decade juxtaposed against a historical warming pattern. The region has experienced a more even distribution of rainfall recently, which could signal a shift in local precipitation dynamics. This backdrop is crucial as Mozambique continues to navigate its climate adaptation strategies.
Geographical and Climatic Context
Lichinga, situated in northern Mozambique, falls under the Köppen climate classification of Cwb, indicating a subtropical highland climate with dry winters. The city's elevation and proximity to Lake Niassa influence its weather patterns, providing a unique microclimate compared to lower altitude regions. This setting is crucial for understanding the local climatic shifts observed in recent data.
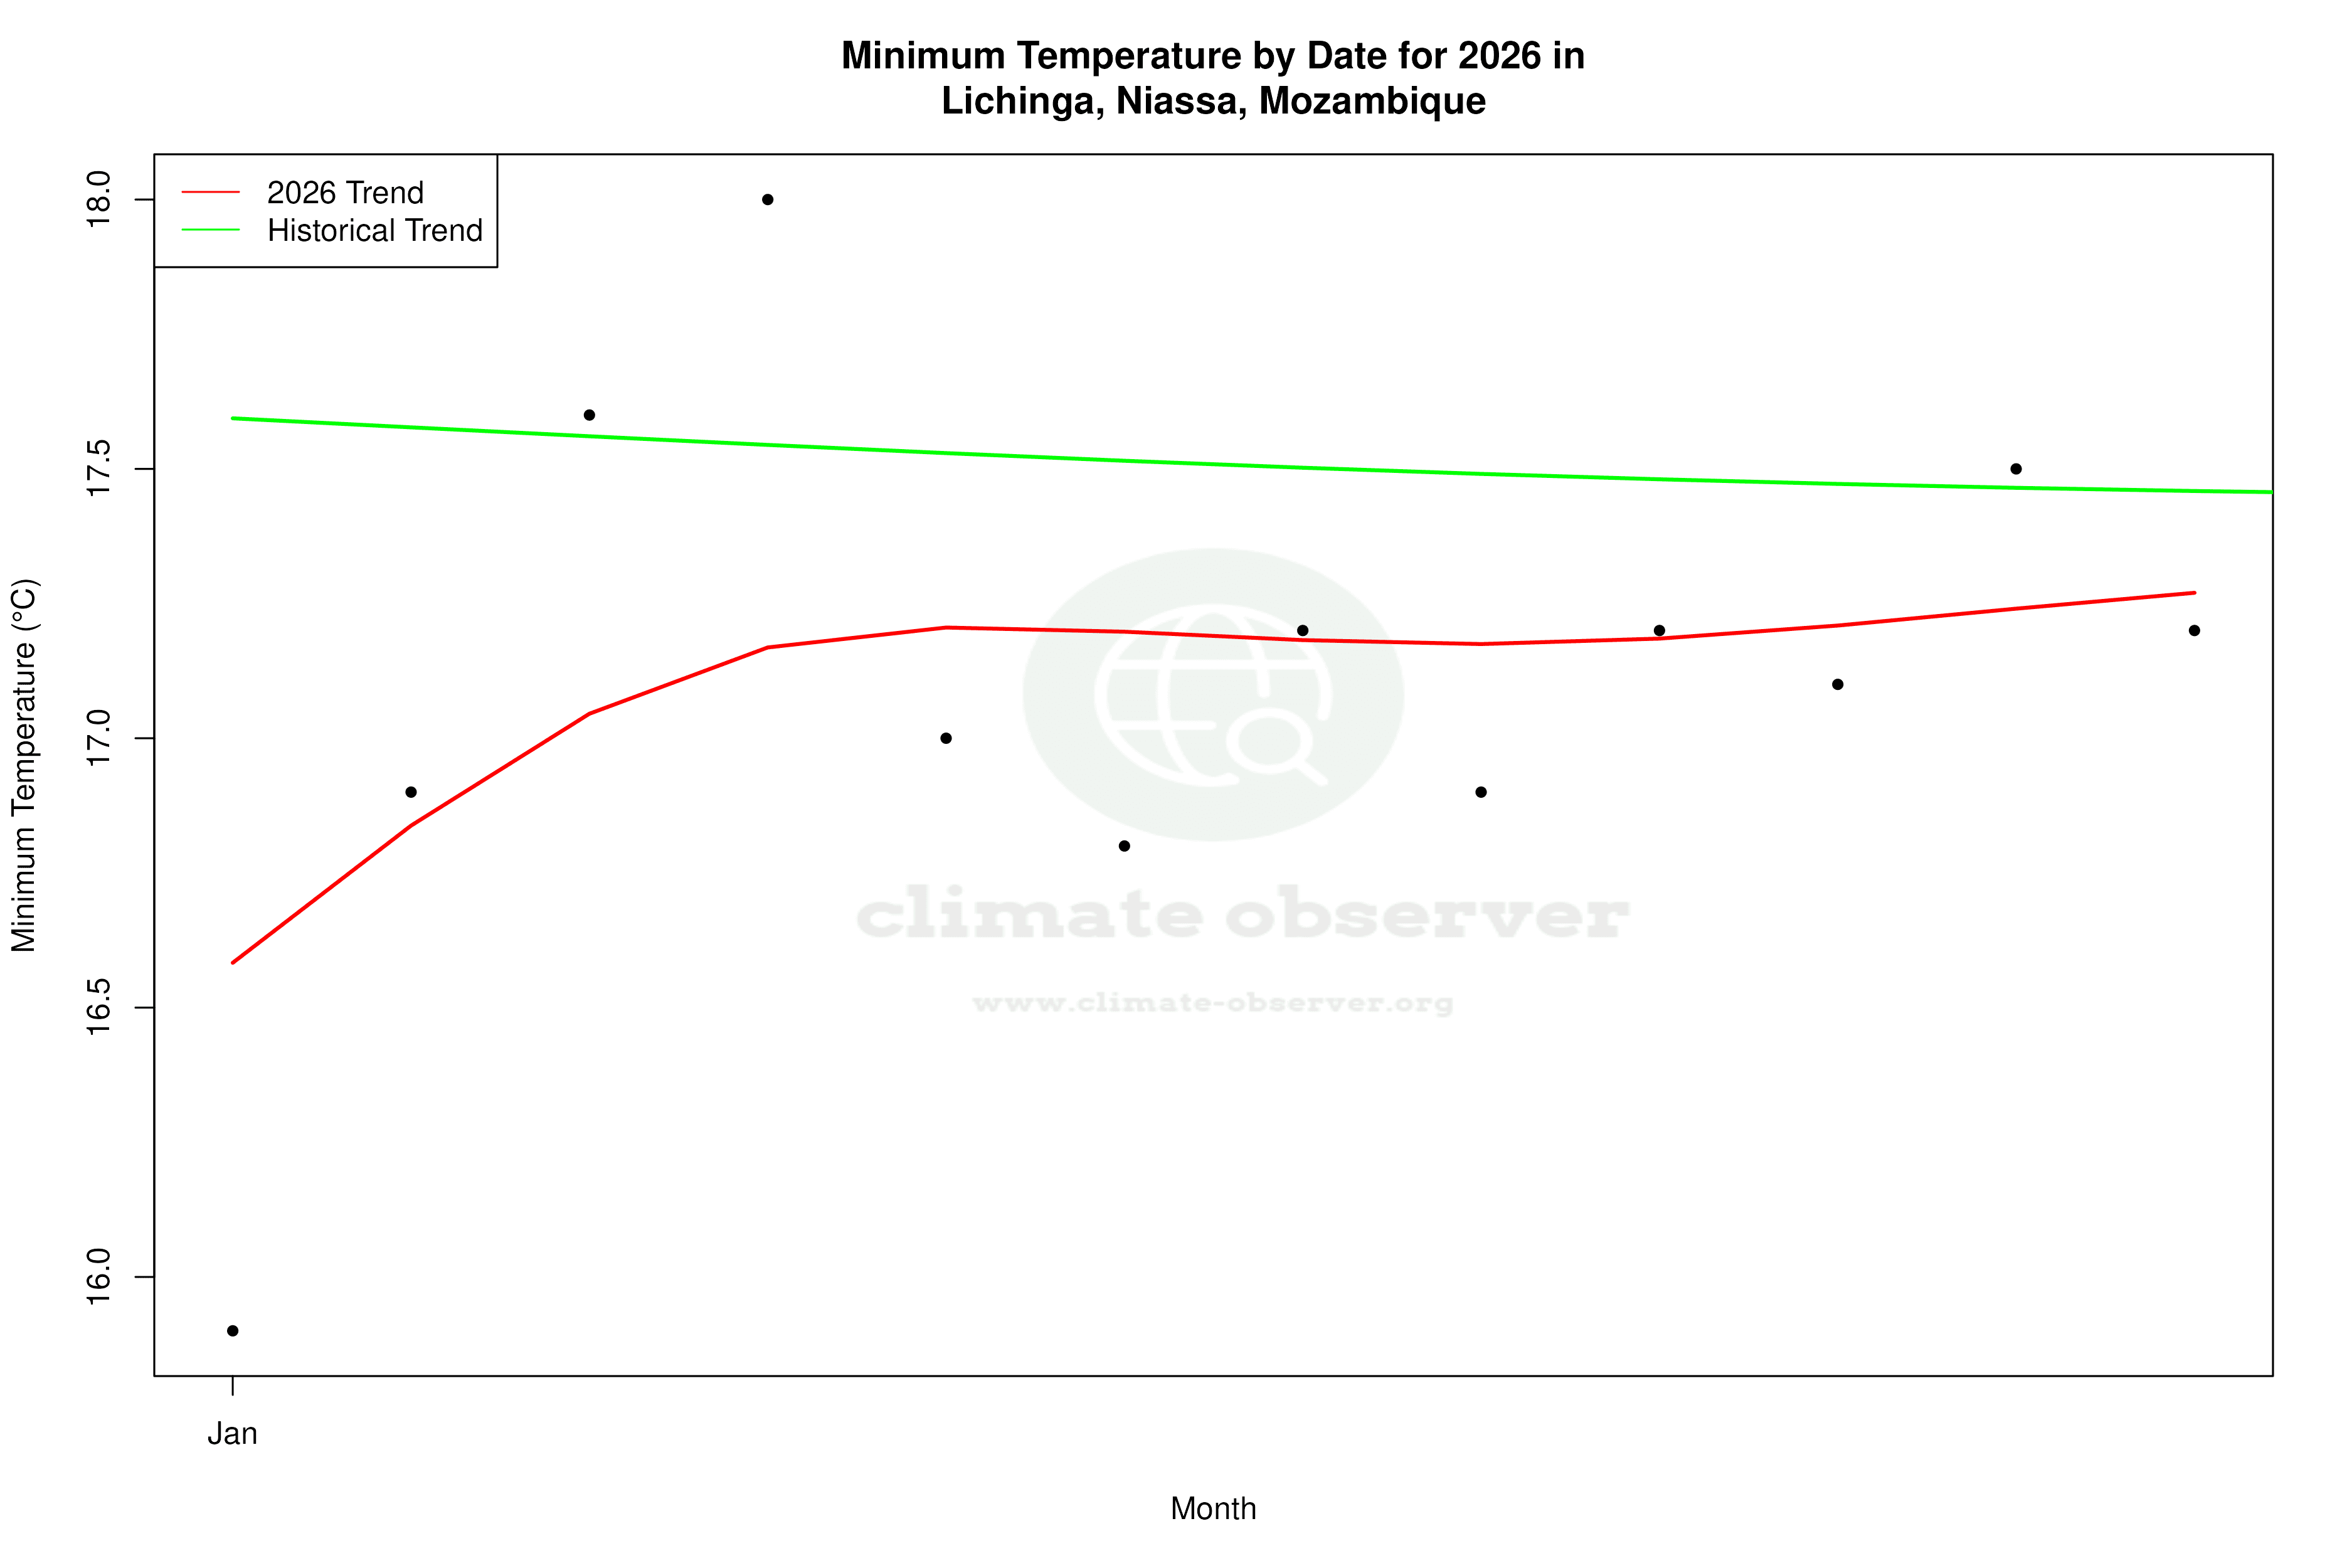
Temperature Trends: A Tale of Two Scales
Over the past decade, Lichinga has seen a cooling trend with average high temperatures declining by 3.23°C (5.81°F) and lows by 4.90°C (8.82°F). This recent cooling contrasts with the all-time warming trends, where high temperatures have risen by 0.50°C (0.90°F) and lows by 0.49°C (0.88°F). These opposing trends highlight the complexity of local climate dynamics, where short-term fluctuations may not align with long-term patterns.
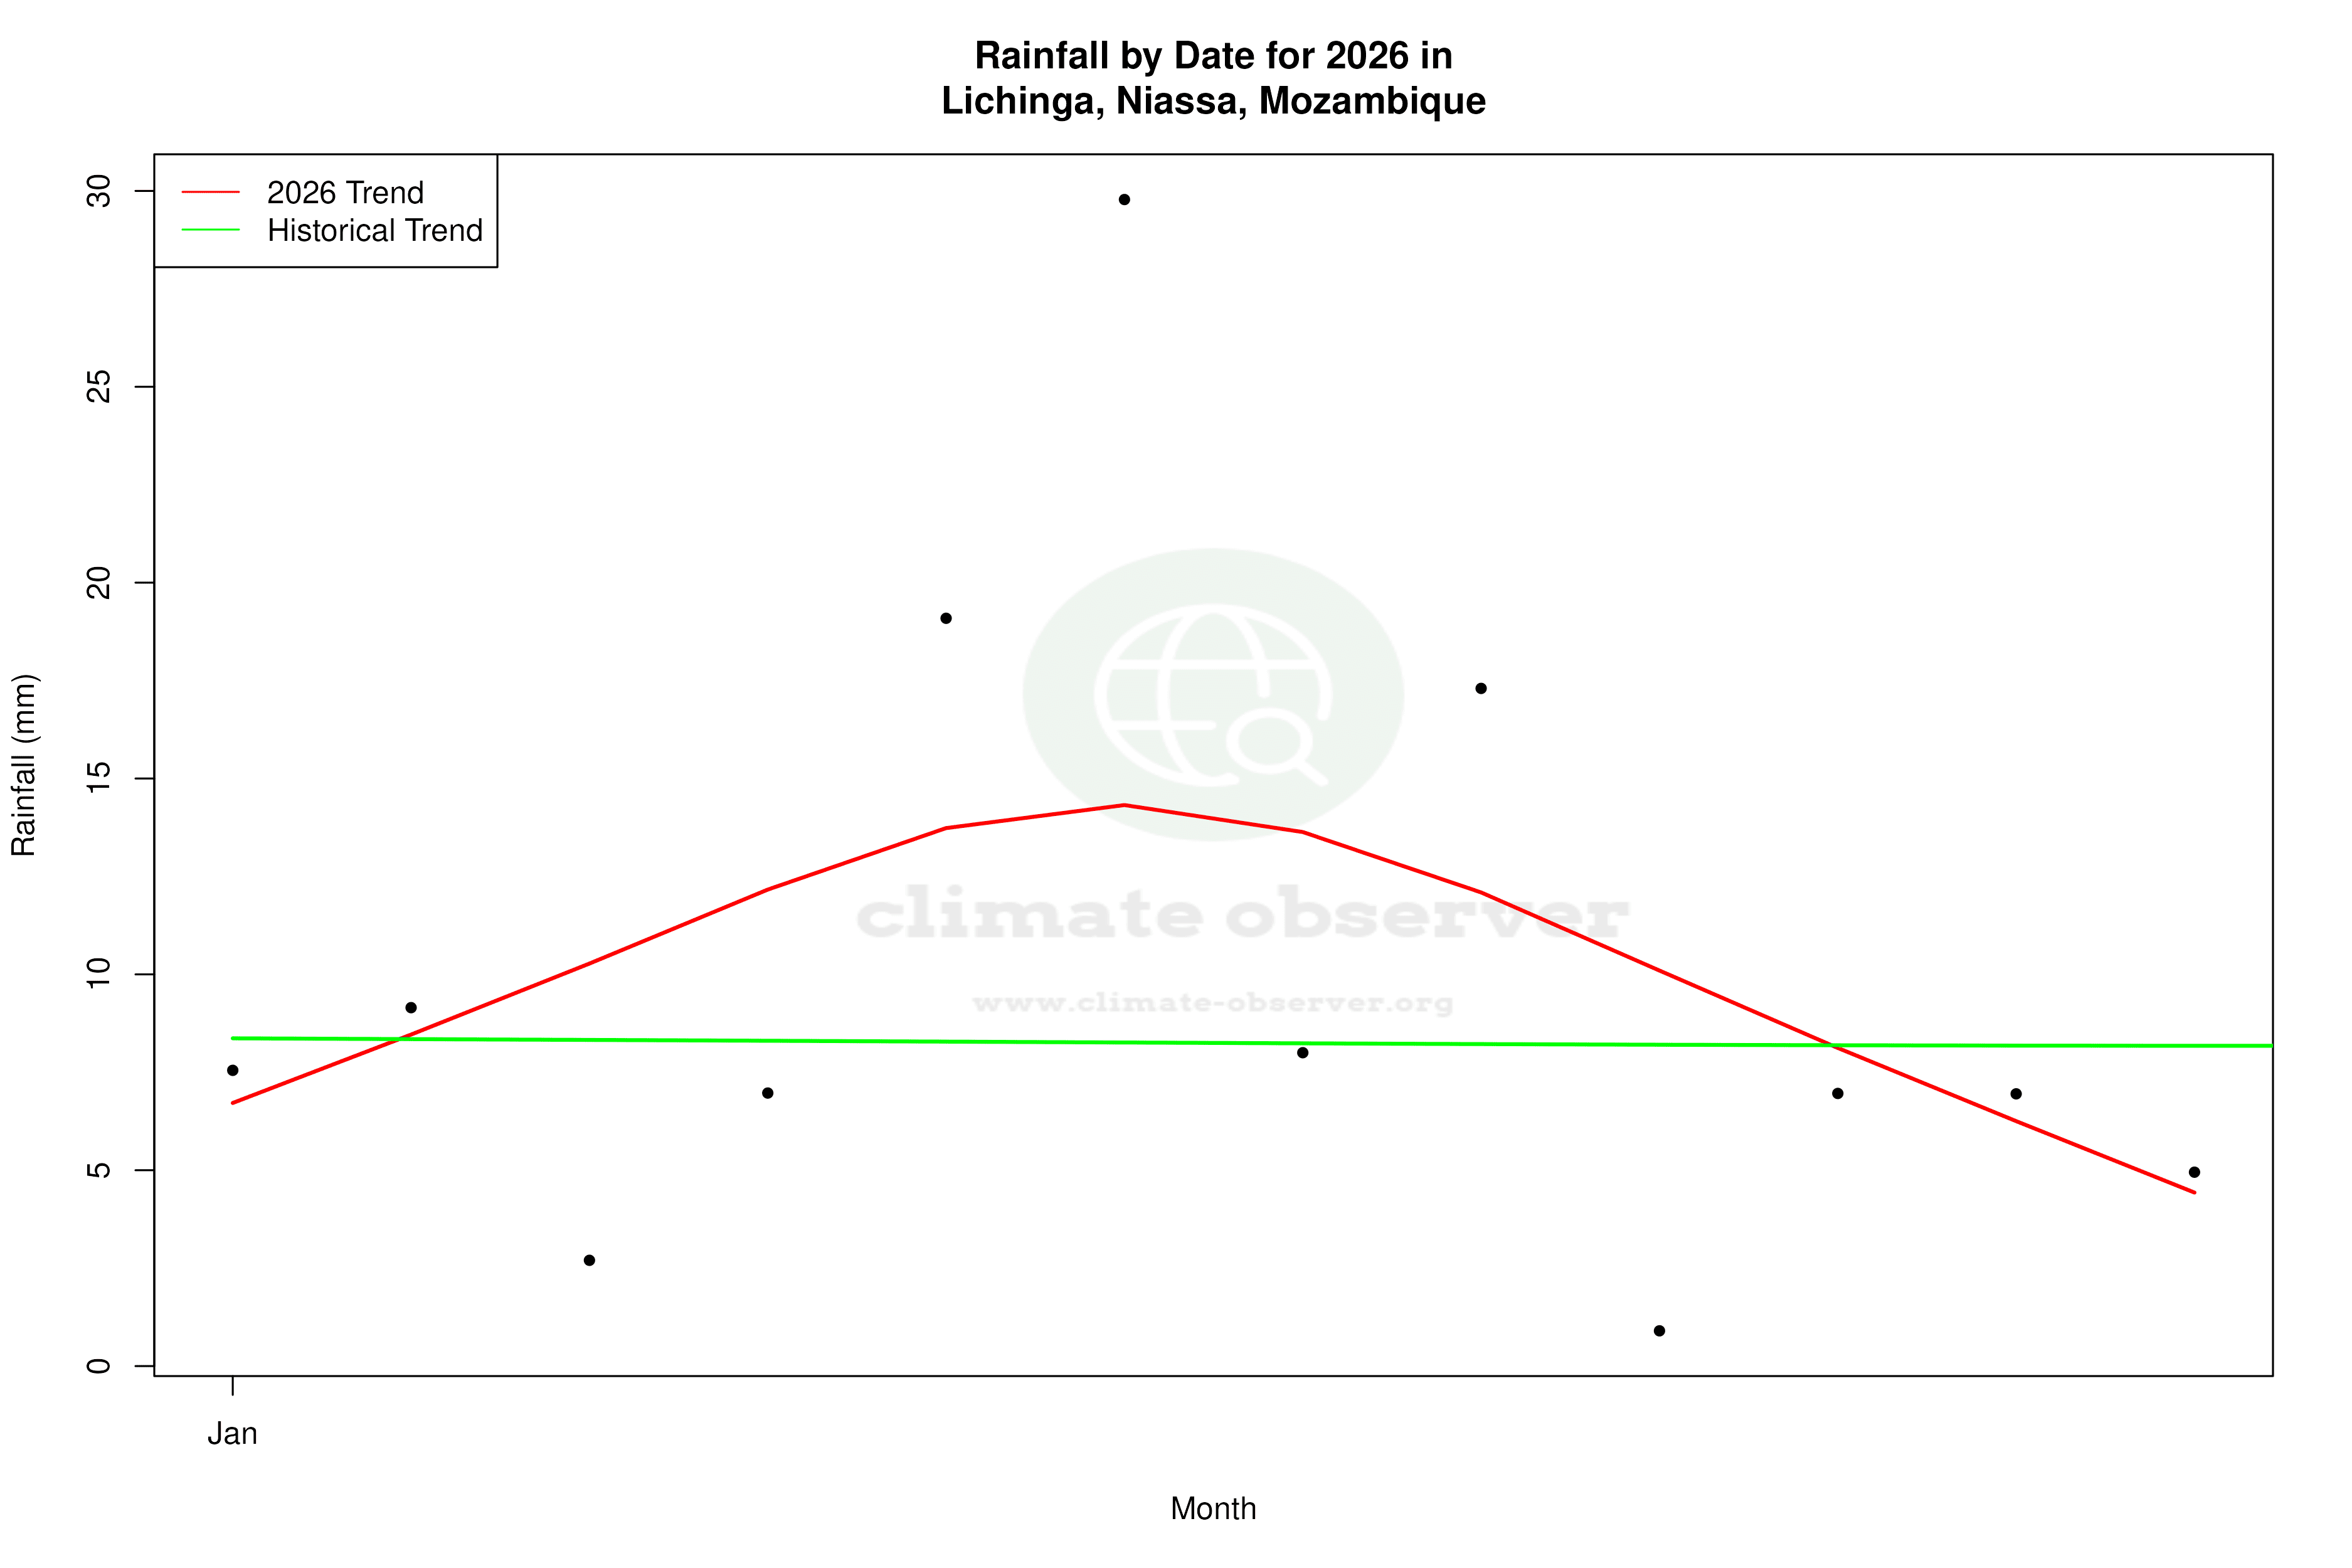
Precipitation Patterns: A Shift Towards Even Distribution
The Precipitation Concentration Index (PCI) for Lichinga has decreased from a baseline of 22.1 to a current value of 19.2. This indicates a shift towards a more even distribution of rainfall events, as values over 20 suggest highly concentrated precipitation. This change could have significant implications for agriculture and water resource management in the region, aligning with Mozambique's broader climate resilience goals.
Record Extremes: A Snapshot of Variability
Lichinga's climate extremes are marked by a record high of 37.85°C (100.13°F) and a record low of 1.0°C (33.8°F). These extremes underscore the variability within the region's climate, which can pose challenges for local communities, especially in terms of infrastructure and health.
Regional Implications and Future Considerations
The observed trends in Lichinga are set against the backdrop of Mozambique's ongoing efforts to address climate change impacts. The recent cooling trend, coupled with a more even distribution of rainfall, suggests potential shifts in local climate patterns that could influence future policy and adaptation strategies. As Mozambique continues to develop its climate action plans, understanding these localised changes remains critical.
Station Statistics
10-Year Trend
High: -3.02 °C/decade
Low: -4.01 °C/decade
Rain: -0.45 mm/decade
25-Year Trend
High: -0.86 °C/decade
Low: -1.15 °C/decade
Rain: +0.06 mm/decade
50-Year Trend
High: +0.35 °C/decade
Low: +0.29 °C/decade
Rain: -0.01 mm/decade
All-Time Trend
High: +0.49 °C/decade
Low: +0.48 °C/decade
Rain: -0.04 mm/decade
Percentage Above-Average Days
Last 12 Months: 47.7%
This Year: 70.1%
Precipitation Concentration Index (PCI) ℹ️
Last 12 Months: 18.5
Historical Average: 21.0
Percentile Rank of Last 12 Months ℹ️
High: 50th percentile
Low: 54th percentile
Rain: 51st percentile
Change in Variance ℹ️
High: -8.6%
Low: +4.7%
Intraday: +26.3%
Data Coverage
91.0%
First Year of Data
1951
Station Location
Historical Weather Records
| Max High | Avg High | Min High | Max Avg | Avg Avg | Min Avg | Max Low | Avg Low | Min Low | Max Precipitation | Avg Precipitation | Max Snow | Avg Snow | |
|---|---|---|---|---|---|---|---|---|---|---|---|---|---|
| Record | 37.9 °C | — | 13.1 °C | 32.2 °C | — | 10.0 °C | 27.0 °C | — | 1.0 °C | 113.5 mm | — | — | — |
| January | 33.7 °C | 25.4 °C | 18.5 °C | 28.8 °C | 22.0 °C | 16.6 °C | 24.4 °C | 17.5 °C | 12.0 °C | 100.0 mm | 8.2 mm | — | — |
| February | 32.5 °C | 25.4 °C | 18.6 °C | 28.0 °C | 22.0 °C | 17.6 °C | 24.3 °C | 17.5 °C | 11.4 °C | 95.1 mm | 7.9 mm | — | — |
| March | 32.4 °C | 25.4 °C | 16.6 °C | 27.3 °C | 21.8 °C | 17.2 °C | 24.2 °C | 17.0 °C | 10.5 °C | 91.5 mm | 6.0 mm | — | — |
| April | 32.0 °C | 24.9 °C | 14.5 °C | 27.0 °C | 20.8 °C | 14.9 °C | 23.8 °C | 15.8 °C | 7.8 °C | 72.9 mm | 2.4 mm | — | — |
| May | 33.5 °C | 23.8 °C | 16.2 °C | 27.4 °C | 19.1 °C | 12.8 °C | 22.8 °C | 13.3 °C | 6.5 °C | 55.0 mm | 0.6 mm | — | — |
| June | 29.5 °C | 22.3 °C | 14.3 °C | 24.1 °C | 17.5 °C | 10.4 °C | 20.4 °C | 11.2 °C | 2.7 °C | 11.5 mm | 0.1 mm | — | — |
| July | 29.5 °C | 21.9 °C | 13.1 °C | 23.2 °C | 17.1 °C | 11.2 °C | 18.9 °C | 10.7 °C | 1.0 °C | 13.1 mm | 0.1 mm | — | — |
| August | 31.9 °C | 23.8 °C | 15.8 °C | 26.3 °C | 18.6 °C | 10.0 °C | 20.2 °C | 11.7 °C | 1.8 °C | 71.5 mm | 0.1 mm | — | — |
| September | 35.1 °C | 26.7 °C | 15.0 °C | 29.6 °C | 21.4 °C | 12.7 °C | 22.8 °C | 13.8 °C | 5.7 °C | 24.2 mm | 0.1 mm | — | — |
| October | 37.7 °C | 28.8 °C | 17.5 °C | 31.3 °C | 23.6 °C | 13.1 °C | 25.3 °C | 16.4 °C | 6.9 °C | 46.2 mm | 0.5 mm | — | — |
| November | 37.9 °C | 28.8 °C | 17.0 °C | 32.2 °C | 24.2 °C | 15.5 °C | 27.0 °C | 17.8 °C | 10.1 °C | 113.5 mm | 2.6 mm | — | — |
| December | 36.3 °C | 26.7 °C | 18.0 °C | 30.9 °C | 23.1 °C | 16.6 °C | 25.7 °C | 17.8 °C | 11.0 °C | 101.5 mm | 6.9 mm | — | — |
Data Visualisations
Remove WatermarksCurrent Year Climate Trends vs Historical


Max Temperature this Year | 1 of 6
Climate 12-Month Moving Averages


Max Temperature 12-Month MA | 1 of 6
Daily Data Points and Averages Throughout the Year


Average Max Temperature Throughout Year | 1 of 5
