Climate for Station: Nampula, Mozambique
Loading live weather...
Climate Analysis & Overview
Nampula's climate is experiencing subtle yet significant shifts, with a 0.21°C (0.38°F) warming in all-time high temperatures and a notable 0.18°C (0.32°F) rise in low temperatures. The precipitation pattern has become more evenly distributed, as indicated by a decrease in the Precipitation Concentration Index from 20.97 to 17.77.
Warming Trends and Temperature Dynamics
Nampula, located in northern Mozambique, is characterised by a tropical savanna climate under the Köppen classification. This region's climate is influenced by its proximity to the Indian Ocean, which moderates temperatures and contributes to a distinct wet and dry season pattern. Over the long term, Nampula has witnessed a warming trend in both high and low temperatures. The all-time high temperatures have risen by 0.21°C (0.38°F), while the lows have increased by 0.18°C (0.32°F). Interestingly, the 10-year trend reveals a different dynamic, with high temperatures showing a slight cooling of 0.05°C (0.09°F), juxtaposed against a more pronounced warming of 0.41°C (0.74°F) in low temperatures. This suggests a narrowing of the diurnal temperature range, potentially impacting local agriculture and biodiversity.
Precipitation Patterns: A Shift Towards Even Distribution
The Precipitation Concentration Index (PCI) offers insights into rainfall distribution. A decrease from 20.97 to 17.77 indicates a shift towards more evenly distributed precipitation events. This change suggests that rainfall is less concentrated in a few intense storms and is now spread more consistently across the wet season. Such a pattern can be beneficial for agriculture, reducing the risk of soil erosion and improving water availability for crops. However, it also requires adjustments in water management strategies to maximise the benefits of this more stable precipitation regime.
Temperature Extremes: Historical Records
Nampula's climate extremes are marked by a record high of 40.94°C (105.69°F) and a record low of 10.0°C (50.0°F). These extremes highlight the variability within the region's tropical climate. While the warming trends suggest an increase in average temperatures, these historical records remind us of the potential for significant temperature variability, which can have profound impacts on both human and natural systems.
Regional Implications and Climate Goals
Mozambique has been proactive in addressing climate change, with regional goals focusing on adaptation and resilience. The observed trends in Nampula align with broader regional patterns of warming and changing precipitation. These shifts underscore the importance of integrating climate data into planning and policy to enhance the resilience of communities and ecosystems. The nuanced changes in temperature and precipitation patterns provide critical insights for local stakeholders aiming to mitigate climate impacts while leveraging opportunities for sustainable development.
Station Statistics
10-Year Trend
High: -0.16 °C/decade
Low: +0.33 °C/decade
Rain: -0.95 mm/decade
25-Year Trend
High: -0.01 °C/decade
Low: +0.42 °C/decade
Rain: -0.25 mm/decade
50-Year Trend
High: +0.27 °C/decade
Low: +0.16 °C/decade
Rain: +0.11 mm/decade
All-Time Trend
High: +0.21 °C/decade
Low: +0.18 °C/decade
Rain: +0.07 mm/decade
Percentage Above-Average Days
Last 12 Months: 49.6%
This Year: 51.9%
Precipitation Concentration Index (PCI) ℹ️
Last 12 Months: 16.8
Historical Average: 20.6
Percentile Rank of Last 12 Months ℹ️
High: 73rd percentile
Low: 95th percentile
Rain: 44th percentile
Change in Variance ℹ️
High: -3.6%
Low: -12.1%
Intraday: -9.2%
Data Coverage
92.5%
First Year of Data
1956
Station Location
Historical Weather Records
| Max High | Avg High | Min High | Max Avg | Avg Avg | Min Avg | Max Low | Avg Low | Min Low | Max Precipitation | Avg Precipitation | Max Snow | Avg Snow | |
|---|---|---|---|---|---|---|---|---|---|---|---|---|---|
| Record | 40.9 °C | — | 18.3 °C | 34.6 °C | — | 16.2 °C | 25.4 °C | — | 10.0 °C | 201.0 mm | — | — | — |
| January | 37.0 °C | 30.4 °C | 22.2 °C | 31.1 °C | 26.0 °C | 21.7 °C | 24.8 °C | 21.8 °C | 17.3 °C | 197.1 mm | 9.6 mm | — | — |
| February | 39.0 °C | 30.2 °C | 23.0 °C | 30.8 °C | 25.9 °C | 21.6 °C | 25.0 °C | 21.8 °C | 17.3 °C | 201.0 mm | 8.6 mm | — | — |
| March | 35.4 °C | 29.7 °C | 23.0 °C | 31.4 °C | 25.4 °C | 20.6 °C | 24.8 °C | 21.4 °C | 16.3 °C | 126.7 mm | 6.2 mm | — | — |
| April | 36.6 °C | 28.8 °C | 23.0 °C | 30.7 °C | 24.4 °C | 19.3 °C | 24.0 °C | 20.2 °C | 14.1 °C | 111.9 mm | 3.2 mm | — | — |
| May | 35.0 °C | 27.5 °C | 20.6 °C | 29.7 °C | 22.8 °C | 17.3 °C | 22.6 °C | 18.1 °C | 10.0 °C | 38.5 mm | 0.7 mm | — | — |
| June | 32.2 °C | 26.1 °C | 18.7 °C | 28.6 °C | 21.2 °C | 16.8 °C | 22.1 °C | 16.4 °C | 10.2 °C | 48.5 mm | 0.7 mm | — | — |
| July | 32.0 °C | 25.8 °C | 18.3 °C | 26.1 °C | 20.8 °C | 16.2 °C | 21.3 °C | 15.8 °C | 10.0 °C | 32.7 mm | 0.7 mm | — | — |
| August | 34.1 °C | 27.8 °C | 19.7 °C | 29.4 °C | 22.1 °C | 16.7 °C | 20.5 °C | 16.3 °C | 10.1 °C | 45.9 mm | 0.4 mm | — | — |
| September | 38.5 °C | 30.6 °C | 20.0 °C | 30.4 °C | 24.3 °C | 17.0 °C | 22.0 °C | 17.7 °C | 12.3 °C | 21.5 mm | 0.2 mm | — | — |
| October | 40.9 °C | 32.7 °C | 22.2 °C | 31.9 °C | 26.2 °C | 18.7 °C | 23.4 °C | 19.4 °C | 12.5 °C | 50.0 mm | 0.6 mm | — | — |
| November | 40.0 °C | 33.5 °C | 23.2 °C | 34.6 °C | 27.3 °C | 19.1 °C | 24.8 °C | 21.0 °C | 14.5 °C | 115.0 mm | 2.2 mm | — | — |
| December | 39.5 °C | 32.1 °C | 23.3 °C | 34.5 °C | 26.9 °C | 20.4 °C | 25.4 °C | 21.8 °C | 16.3 °C | 161.0 mm | 6.2 mm | — | — |
Data Visualisations
Remove WatermarksCurrent Year Climate Trends vs Historical


Max Temperature this Year | 1 of 6
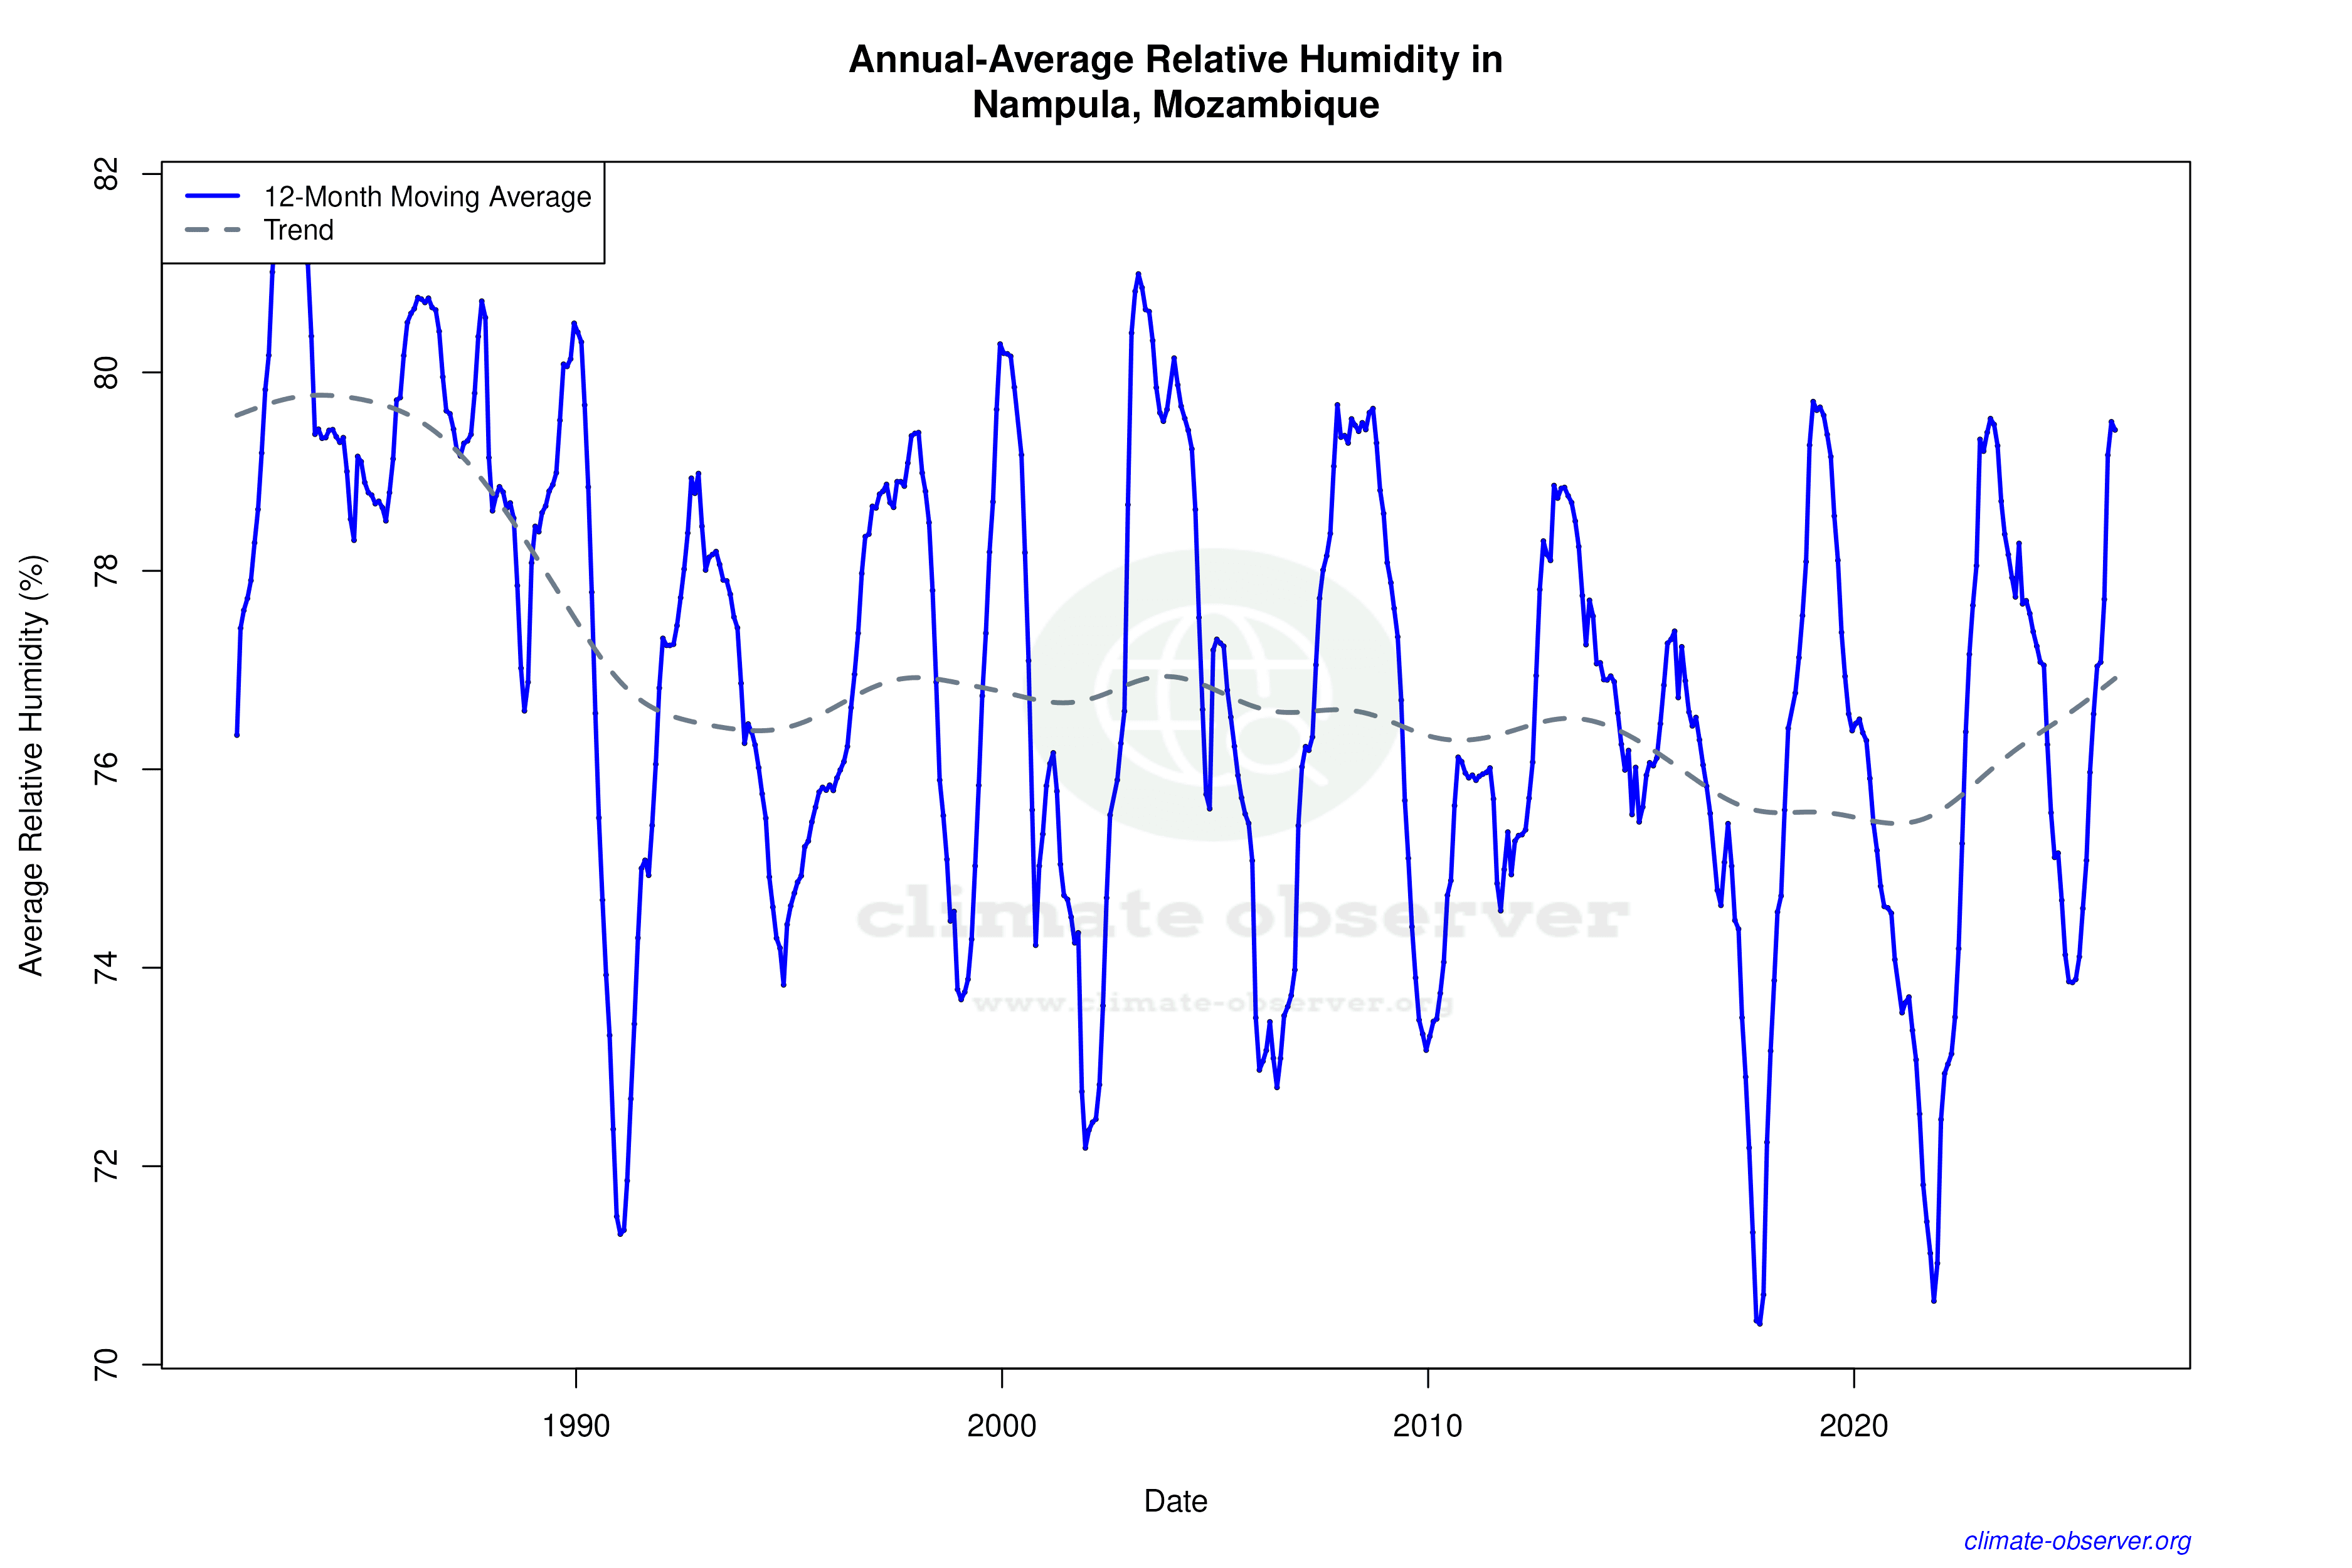
Climate 12-Month Moving Averages


Max Temperature 12-Month MA | 1 of 6
Daily Data Points and Averages Throughout the Year


Average Max Temperature Throughout Year | 1 of 5
