Climate for Station: Beira, Sofala, Mozambique
Loading live weather...
Climate Analysis & Overview
Beira's climate narrative reveals a complex interplay of warming highs and cooling lows over the past decade, contrasting with a long-term warming trend. The city's precipitation pattern has become slightly more evenly distributed, suggesting subtle shifts in its climatic behaviour.
Coastal Climate Dynamics
Beira, located at -19.8, 34.9 in Mozambique, is characterised by a tropical savanna climate under the Köppen classification. This coastal city, adjacent to the Indian Ocean, experiences significant maritime influences that moderate its temperature extremes. Over the past decade, Beira has witnessed a notable warming of its high temperatures by 2.29°C (4.12°F), while its low temperatures have cooled by 1.89°C (3.40°F). This divergence highlights a complex thermal oscillation, potentially influenced by oceanic currents and regional atmospheric patterns.
Long-term Temperature Trends
Despite the recent decade's contrasting temperature shifts, Beira's all-time temperature trends paint a more uniform picture. The highs have experienced a marginal warming of 0.02°C (0.04°F), while the lows have risen by 0.35°C (0.63°F). This long-term warming trend suggests a gradual rise in baseline temperatures, possibly linked to broader climatic changes affecting the southern African region. The record temperatures, with a maximum of 40.2°C (104.4°F) and a minimum of 7.4°C (45.3°F), underscore the range of thermal conditions that Beira can experience.
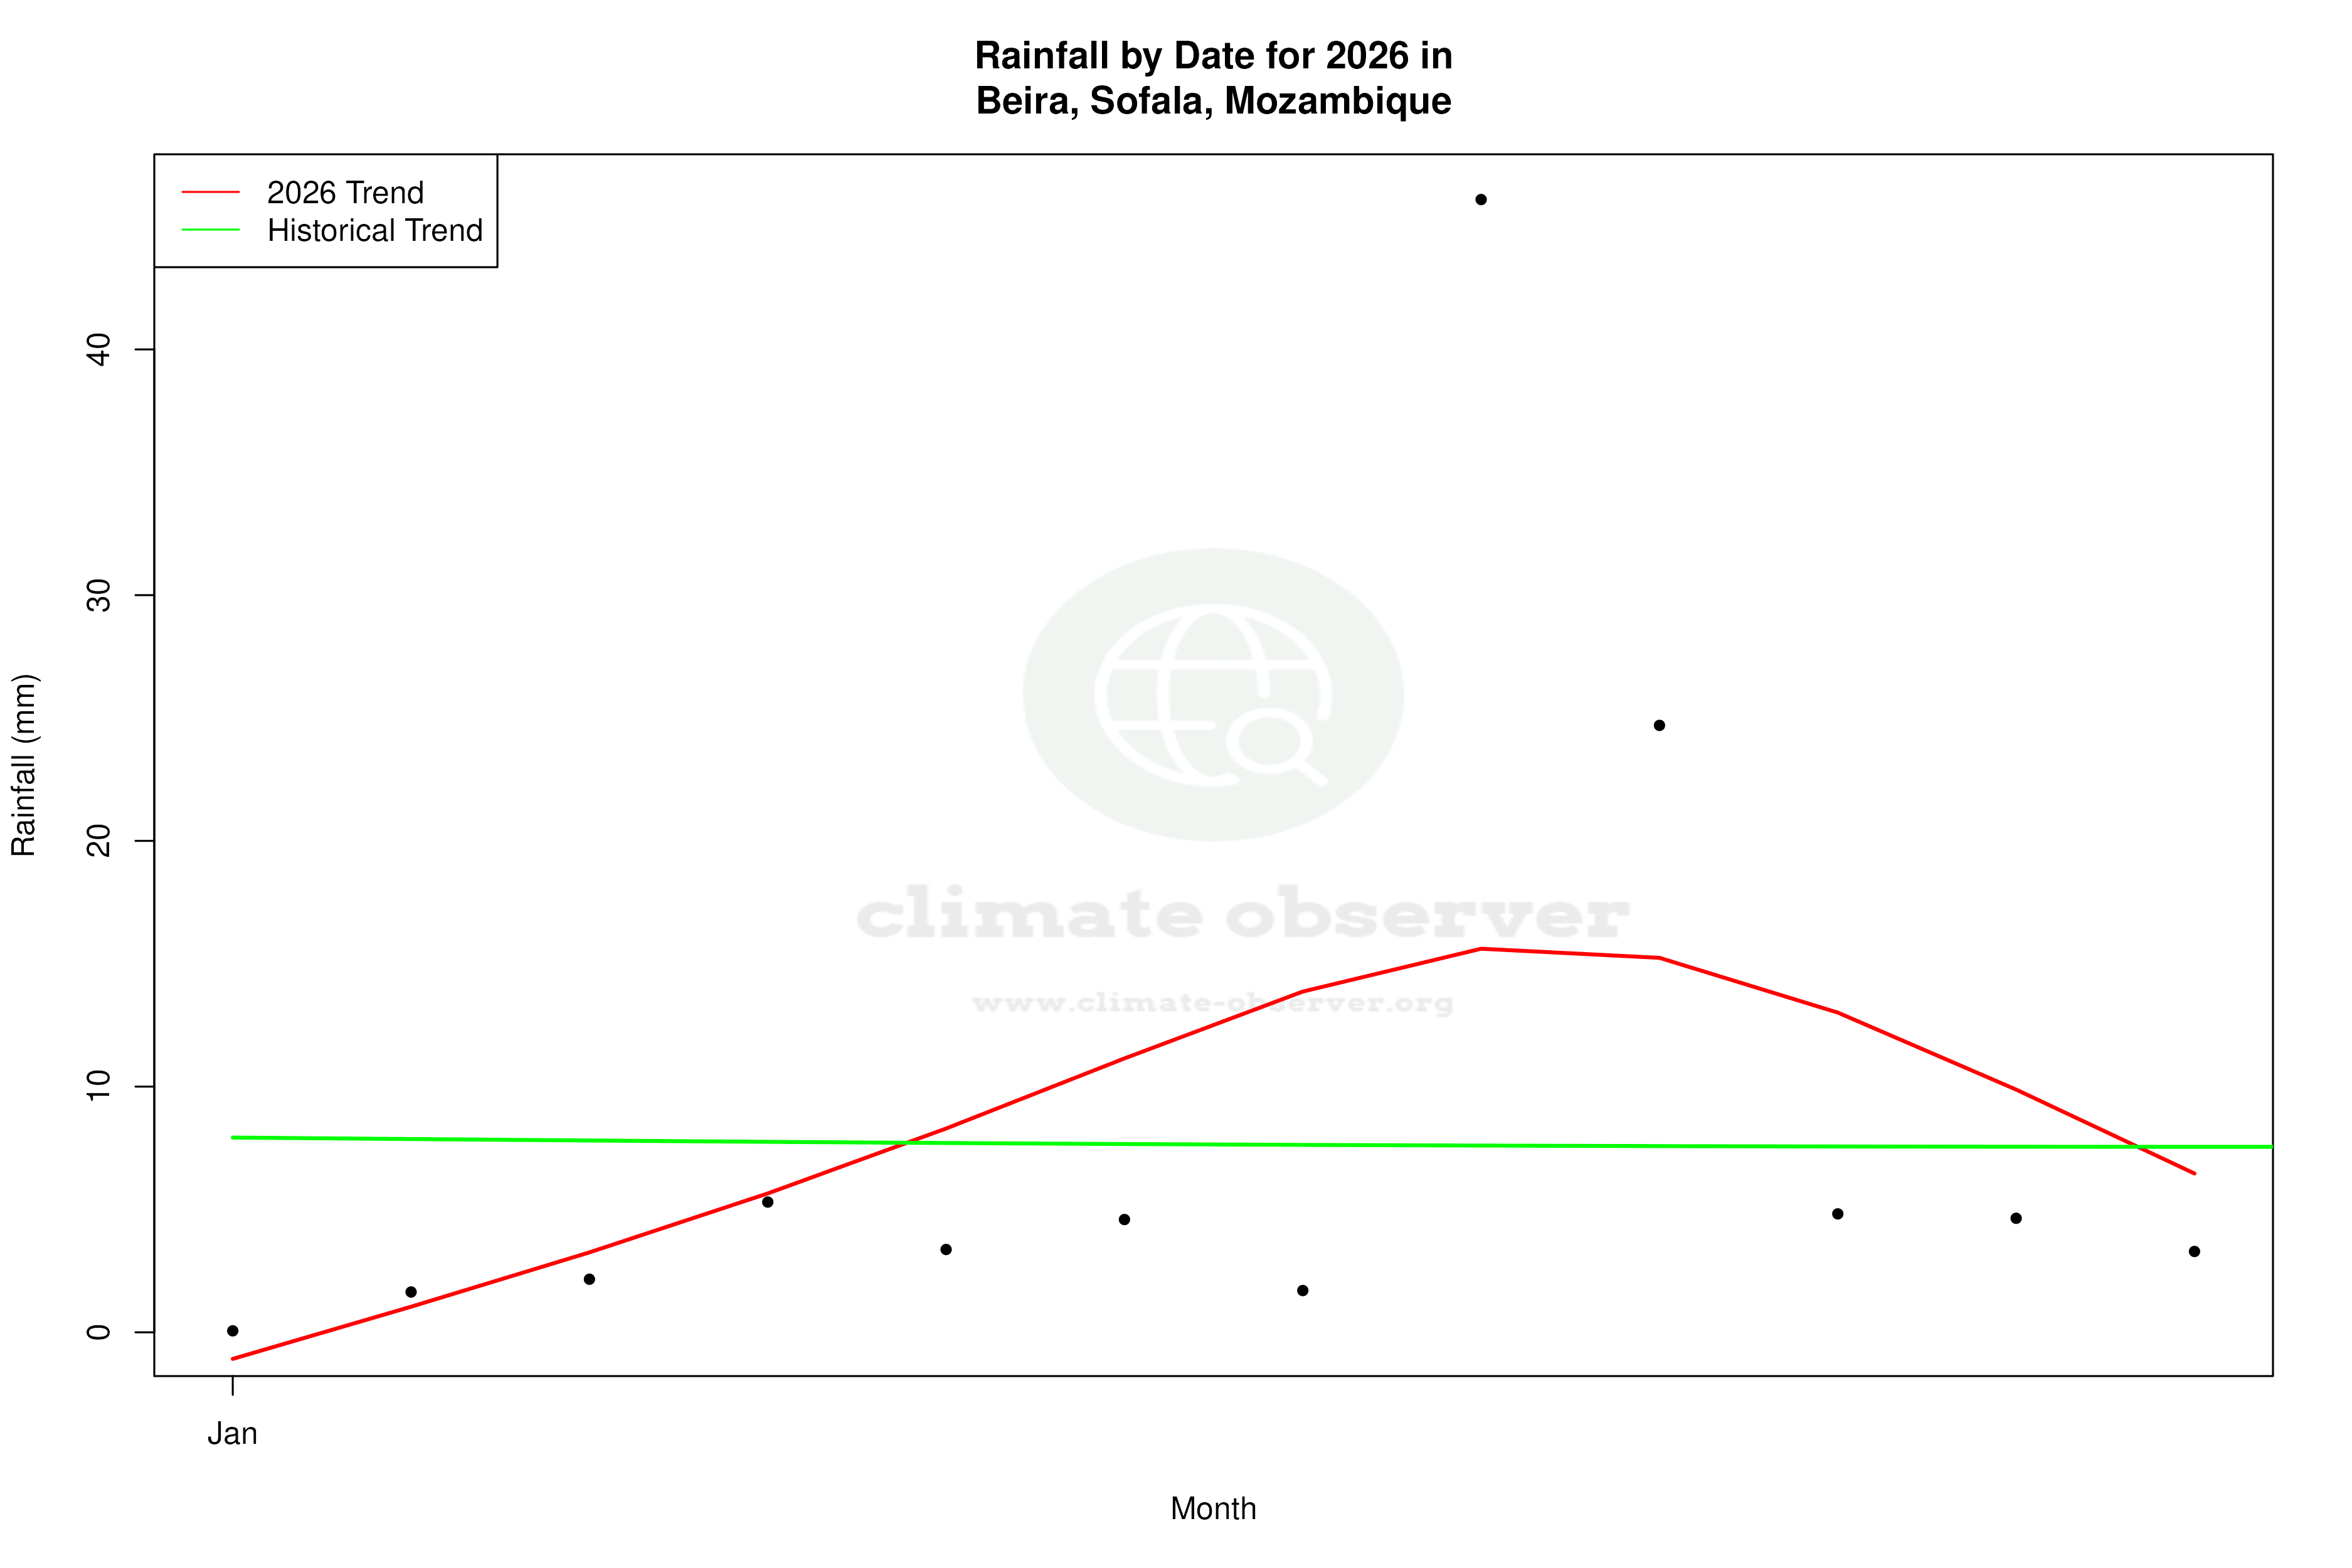
Precipitation Patterns and Distribution
The Precipitation Concentration Index (PCI) offers insight into how rainfall is distributed throughout the year. Beira's PCI has decreased slightly from a baseline of 17.7 to a current value of 16.7. This marginal reduction indicates a more even distribution of precipitation events, suggesting a subtle shift towards less concentrated rainfall periods. Such changes in precipitation patterns can have significant implications for local agriculture and water resource management.
Regional Implications and Climate Goals
Mozambique's regional climate goals focus on enhancing resilience to climate variability, including temperature extremes and shifting precipitation patterns. Beira's recent climatic data, with its warming highs and cooling lows, provides critical insights for policymakers and environmental planners. The city's slight shift towards more evenly distributed rainfall could support initiatives aimed at improving water management and agricultural productivity in the face of climate change.
Navigating Climatic Variability
Understanding Beira's climatic variability is crucial for anticipating future challenges and opportunities. The interplay of warming and cooling trends over different time scales highlights the need for adaptive strategies that account for both immediate and long-term climatic shifts. As Mozambique continues to navigate its climate goals, Beira's climate profile serves as a vital piece of the broader environmental puzzle.
Station Statistics
10-Year Trend
High: +2.06 °C/decade
Low: -1.45 °C/decade
Rain: -0.58 mm/decade
25-Year Trend
High: +0.39 °C/decade
Low: -0.30 °C/decade
Rain: +0.13 mm/decade
50-Year Trend
High: +0.02 °C/decade
Low: +0.31 °C/decade
Rain: -0.04 mm/decade
All-Time Trend
High: +0.02 °C/decade
Low: +0.35 °C/decade
Rain: -0.12 mm/decade
Percentage Above-Average Days
Last 12 Months: 50.1%
This Year: 39.6%
Precipitation Concentration Index (PCI) ℹ️
Last 12 Months: 15.6
Historical Average: 16.9
Percentile Rank of Last 12 Months ℹ️
High: 95th percentile
Low: 62nd percentile
Rain: 42nd percentile
Change in Variance ℹ️
High: +5.8%
Low: -6.2%
Intraday: +14.3%
Data Coverage
85.2%
First Year of Data
1951
Station Location
Historical Weather Records
| Max High | Avg High | Min High | Max Avg | Avg Avg | Min Avg | Max Low | Avg Low | Min Low | Max Precipitation | Avg Precipitation | Max Snow | Avg Snow | |
|---|---|---|---|---|---|---|---|---|---|---|---|---|---|
| Record | 40.2 °C | — | 18.1 °C | 33.1 °C | — | 15.3 °C | 29.0 °C | — | 7.4 °C | 366.2 mm | — | — | — |
| January | 39.5 °C | 31.0 °C | 24.2 °C | 33.1 °C | 28.1 °C | 22.1 °C | 28.6 °C | 24.6 °C | 18.0 °C | 286.6 mm | 7.8 mm | — | — |
| February | 39.3 °C | 30.8 °C | 23.7 °C | 32.4 °C | 28.0 °C | 21.4 °C | 29.0 °C | 24.6 °C | 17.7 °C | 366.2 mm | 8.8 mm | — | — |
| March | 38.5 °C | 30.3 °C | 24.5 °C | 33.0 °C | 27.5 °C | 23.5 °C | 28.4 °C | 24.1 °C | 18.3 °C | 205.0 mm | 7.3 mm | — | — |
| April | 37.2 °C | 29.1 °C | 23.0 °C | 30.3 °C | 25.9 °C | 20.4 °C | 27.7 °C | 22.4 °C | 15.4 °C | 108.0 mm | 3.9 mm | — | — |
| May | 36.8 °C | 27.5 °C | 20.0 °C | 31.1 °C | 23.8 °C | 18.4 °C | 25.9 °C | 19.8 °C | 12.0 °C | 88.0 mm | 1.8 mm | — | — |
| June | 34.2 °C | 25.7 °C | 18.1 °C | 26.9 °C | 22.0 °C | 17.0 °C | 23.7 °C | 17.7 °C | 8.0 °C | 49.2 mm | 1.3 mm | — | — |
| July | 33.1 °C | 25.0 °C | 19.8 °C | 27.3 °C | 21.2 °C | 16.2 °C | 22.9 °C | 17.1 °C | 10.5 °C | 62.0 mm | 1.3 mm | — | — |
| August | 35.0 °C | 26.0 °C | 20.8 °C | 29.3 °C | 22.2 °C | 15.3 °C | 23.0 °C | 17.8 °C | 10.0 °C | 83.0 mm | 1.0 mm | — | — |
| September | 36.2 °C | 27.4 °C | 20.2 °C | 29.3 °C | 23.8 °C | 18.4 °C | 24.5 °C | 19.5 °C | 7.4 °C | 101.8 mm | 0.7 mm | — | — |
| October | 37.2 °C | 28.7 °C | 20.7 °C | 30.7 °C | 25.3 °C | 19.4 °C | 26.7 °C | 21.4 °C | 12.0 °C | 107.3 mm | 1.2 mm | — | — |
| November | 40.2 °C | 29.9 °C | 20.7 °C | 32.9 °C | 26.8 °C | 18.6 °C | 27.8 °C | 22.9 °C | 13.4 °C | 210.1 mm | 3.3 mm | — | — |
| December | 39.5 °C | 30.6 °C | 24.5 °C | 33.0 °C | 27.6 °C | 21.0 °C | 28.1 °C | 24.0 °C | 16.5 °C | 208.5 mm | 7.4 mm | — | — |
Data Visualisations
Remove WatermarksCurrent Year Climate Trends vs Historical
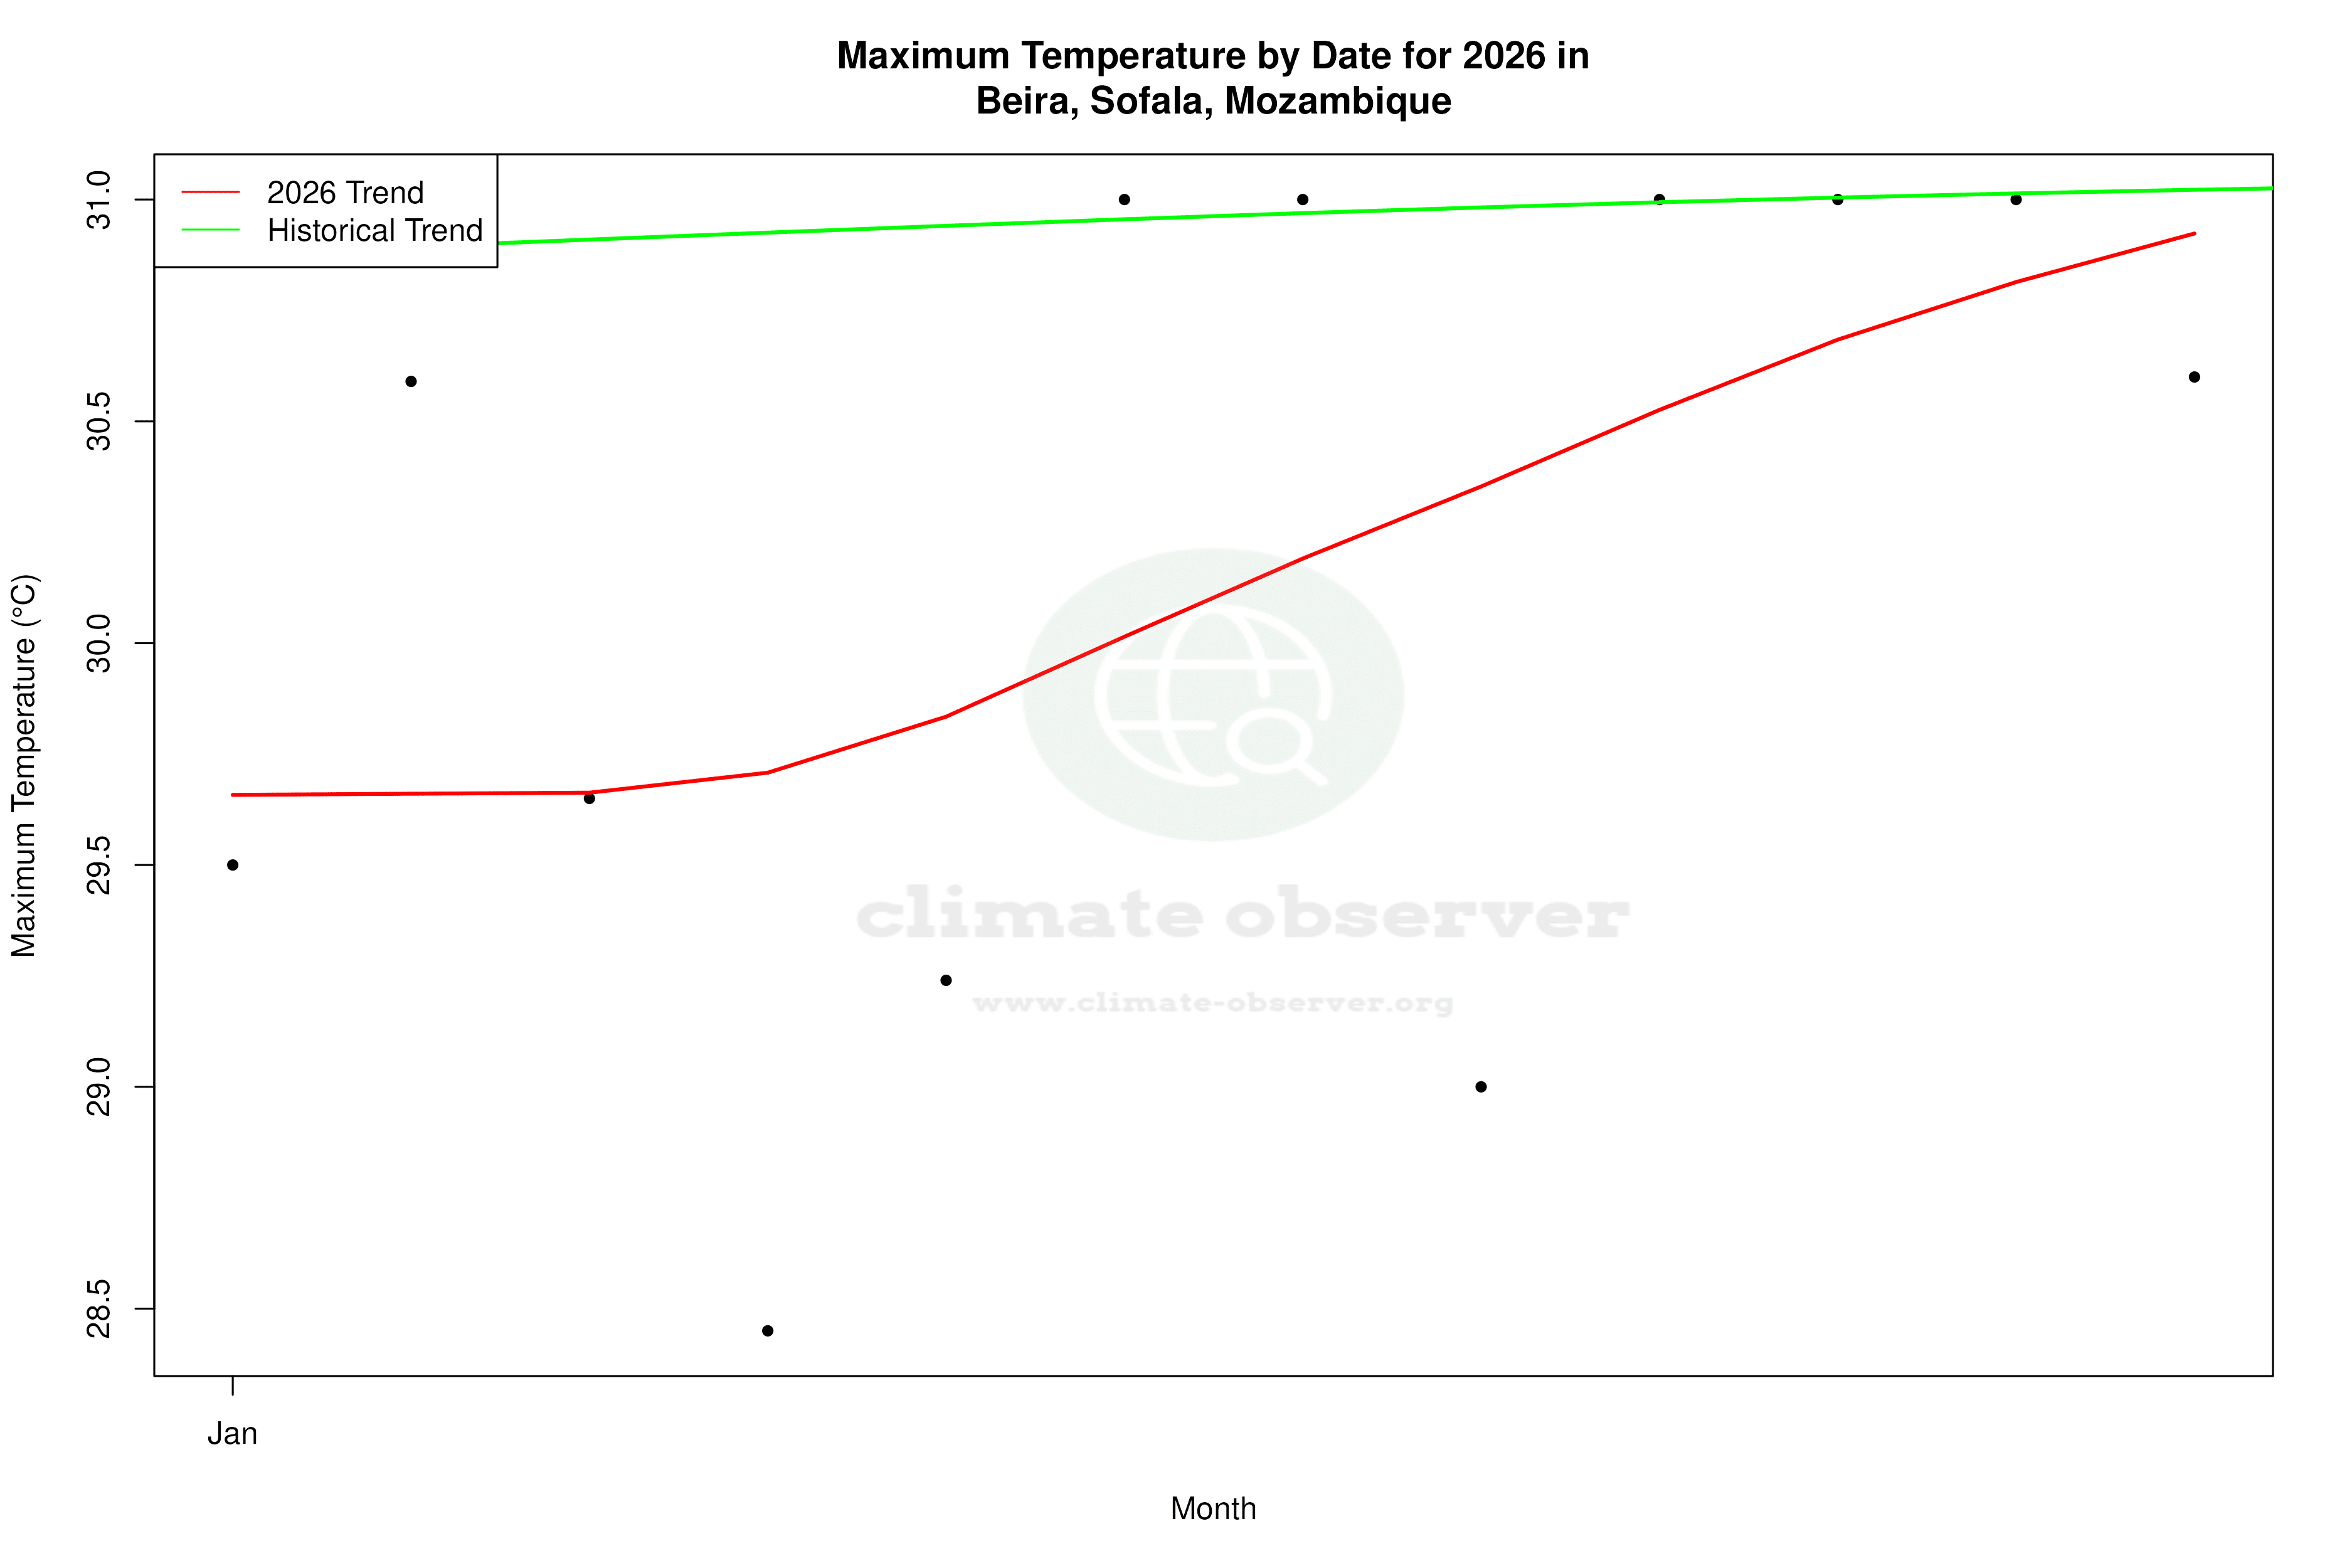


Max Temperature this Year | 1 of 6
Climate 12-Month Moving Averages


Max Temperature 12-Month MA | 1 of 6
Daily Data Points and Averages Throughout the Year


Average Max Temperature Throughout Year | 1 of 5
