Climate for Station: Niamey Aero, Niamey, Niger
Loading live weather...
Climate Analysis & Overview
Niamey Aero's climate profile reveals a complex interplay of warming and cooling trends, with a significant increase in precipitation concentration. Over the past decade, the region has experienced a notable warming of daytime highs and a cooling of nighttime lows, against a backdrop of long-term warming trends. This dynamic climate is influenced by its Sahelian location, where the shifting patterns of precipitation are becoming more pronounced.
Sahelian Climate Dynamics
Located in the heart of the Sahel, Niamey Aero experiences a hot semi-arid climate, classified as BSh under the Köppen system. This region is characterised by a stark contrast between the wet and dry seasons, heavily influenced by the West African Monsoon. The nearby Niger River plays a crucial role in moderating the local climate, providing a vital source of moisture during the rainy season. However, the area's climate is marked by variability, as evidenced by the recent trends in temperature and precipitation.
Temperature Trends and Variability
Over the past decade, Niamey Aero has witnessed a warming trend in daytime high temperatures, with an increase of 0.38°C (0.68°F). This contrasts with a cooling trend in nighttime low temperatures, which have decreased by 0.61°C (1.10°F). These recent changes highlight the region's temperature variability, which differs from the long-term trends. The all-time data shows a modest warming of high temperatures by 0.04°C (0.07°F), while low temperatures have risen by 0.31°C (0.56°F). This indicates a gradual warming over the years, aligning with broader regional climate patterns.
Precipitation Patterns: A Shift Towards Concentration
The Precipitation Concentration Index (PCI) for Niamey Aero has shown a significant increase from a baseline of 24.8 to a current value of 32.6. The PCI measures how rainfall is distributed over time, with higher values indicating that precipitation is concentrated in fewer, more intense events. This shift suggests that the region is experiencing more sporadic and intense rainfall, which can have profound implications for agriculture and water management in Niger.
Implications for Regional Climate Goals
Niger has set ambitious climate goals, including enhancing resilience to climate change and improving water resource management. The trends observed at Niamey Aero underscore the challenges faced by the region. The increase in precipitation concentration and the variability in temperature trends highlight the need for adaptive strategies to mitigate the impacts of climate change. Recent weather events, such as intense rainstorms and heatwaves, further emphasise the urgency of these goals.
Record Extremes: A Testament to Variability
Niamey Aero's records reflect the extreme variability of its climate, with a maximum temperature of 49.8°C (121.6°F) and a minimum of 7.6°C (45.7°F). These extremes illustrate the wide range of conditions that can occur in this Sahelian region, reinforcing the importance of monitoring and adapting to changing climate patterns.
Station Statistics
10-Year Trend
High: +0.36 °C/decade
Low: -0.38 °C/decade
Rain: -0.73 mm/decade
25-Year Trend
High: +0.11 °C/decade
Low: +0.38 °C/decade
Rain: -0.06 mm/decade
50-Year Trend
High: +0.24 °C/decade
Low: +0.38 °C/decade
Rain: -0.00 mm/decade
All-Time Trend
High: +0.04 °C/decade
Low: +0.32 °C/decade
Rain: +0.00 mm/decade
Percentage Above-Average Days
Last 12 Months: 58.1%
This Year: 69.0%
Precipitation Concentration Index (PCI) ℹ️
Last 12 Months: 26.1
Historical Average: 25.3
Percentile Rank of Last 12 Months ℹ️
High: 82nd percentile
Low: 88th percentile
Rain: 16th percentile
Change in Variance ℹ️
High: -0.2%
Low: -8.9%
Intraday: -21.7%
Data Coverage
92.3%
First Year of Data
1940
Station Location
Historical Weather Records
| Max High | Avg High | Min High | Max Avg | Avg Avg | Min Avg | Max Low | Avg Low | Min Low | Max Precipitation | Avg Precipitation | Max Snow | Avg Snow | |
|---|---|---|---|---|---|---|---|---|---|---|---|---|---|
| Record | 49.8 °C | — | 22.7 °C | 39.8 °C | — | 16.8 °C | 36.8 °C | — | 7.6 °C | 173.1 mm | — | — | — |
| January | 41.6 °C | 32.9 °C | 22.7 °C | 33.8 °C | 24.6 °C | 16.8 °C | 26.4 °C | 16.4 °C | 7.6 °C | 3.9 mm | 0.0 mm | — | — |
| February | 46.5 °C | 35.9 °C | 26.1 °C | 37.7 °C | 27.6 °C | 19.7 °C | 28.2 °C | 19.0 °C | 10.5 °C | 4.5 mm | 0.0 mm | — | — |
| March | 46.0 °C | 39.4 °C | 27.0 °C | 38.2 °C | 31.6 °C | 22.6 °C | 32.0 °C | 23.1 °C | 13.6 °C | 24.5 mm | 0.0 mm | — | — |
| April | 49.8 °C | 41.4 °C | 33.0 °C | 39.8 °C | 34.5 °C | 25.2 °C | 33.3 °C | 26.8 °C | 15.2 °C | 46.8 mm | 0.2 mm | — | — |
| May | 48.6 °C | 40.6 °C | 29.0 °C | 39.8 °C | 34.3 °C | 25.5 °C | 33.0 °C | 28.0 °C | 18.0 °C | 104.2 mm | 1.1 mm | — | — |
| June | 47.8 °C | 37.7 °C | 24.7 °C | 38.2 °C | 31.9 °C | 23.7 °C | 36.8 °C | 26.1 °C | 17.8 °C | 70.7 mm | 2.8 mm | — | — |
| July | 47.5 °C | 34.4 °C | 24.4 °C | 34.8 °C | 29.2 °C | 22.8 °C | 30.0 °C | 24.2 °C | 13.0 °C | 110.0 mm | 5.2 mm | — | — |
| August | 43.3 °C | 32.5 °C | 23.2 °C | 34.2 °C | 27.9 °C | 22.5 °C | 28.9 °C | 23.4 °C | 17.0 °C | 173.1 mm | 6.3 mm | — | — |
| September | 41.8 °C | 34.5 °C | 23.0 °C | 35.5 °C | 29.1 °C | 22.8 °C | 32.0 °C | 23.9 °C | 17.7 °C | 98.0 mm | 3.3 mm | — | — |
| October | 43.0 °C | 37.9 °C | 27.7 °C | 35.5 °C | 30.9 °C | 24.7 °C | 29.0 °C | 24.1 °C | 16.0 °C | 59.2 mm | 0.5 mm | — | — |
| November | 42.8 °C | 36.9 °C | 27.6 °C | 34.9 °C | 28.6 °C | 21.2 °C | 29.4 °C | 19.9 °C | 13.0 °C | 15.8 mm | 0.0 mm | — | — |
| December | 40.2 °C | 33.6 °C | 23.8 °C | 32.5 °C | 25.3 °C | 17.9 °C | 25.0 °C | 16.9 °C | 8.7 °C | 0.7 mm | 0.0 mm | — | — |
Data Visualisations
Remove WatermarksCurrent Year Climate Trends vs Historical


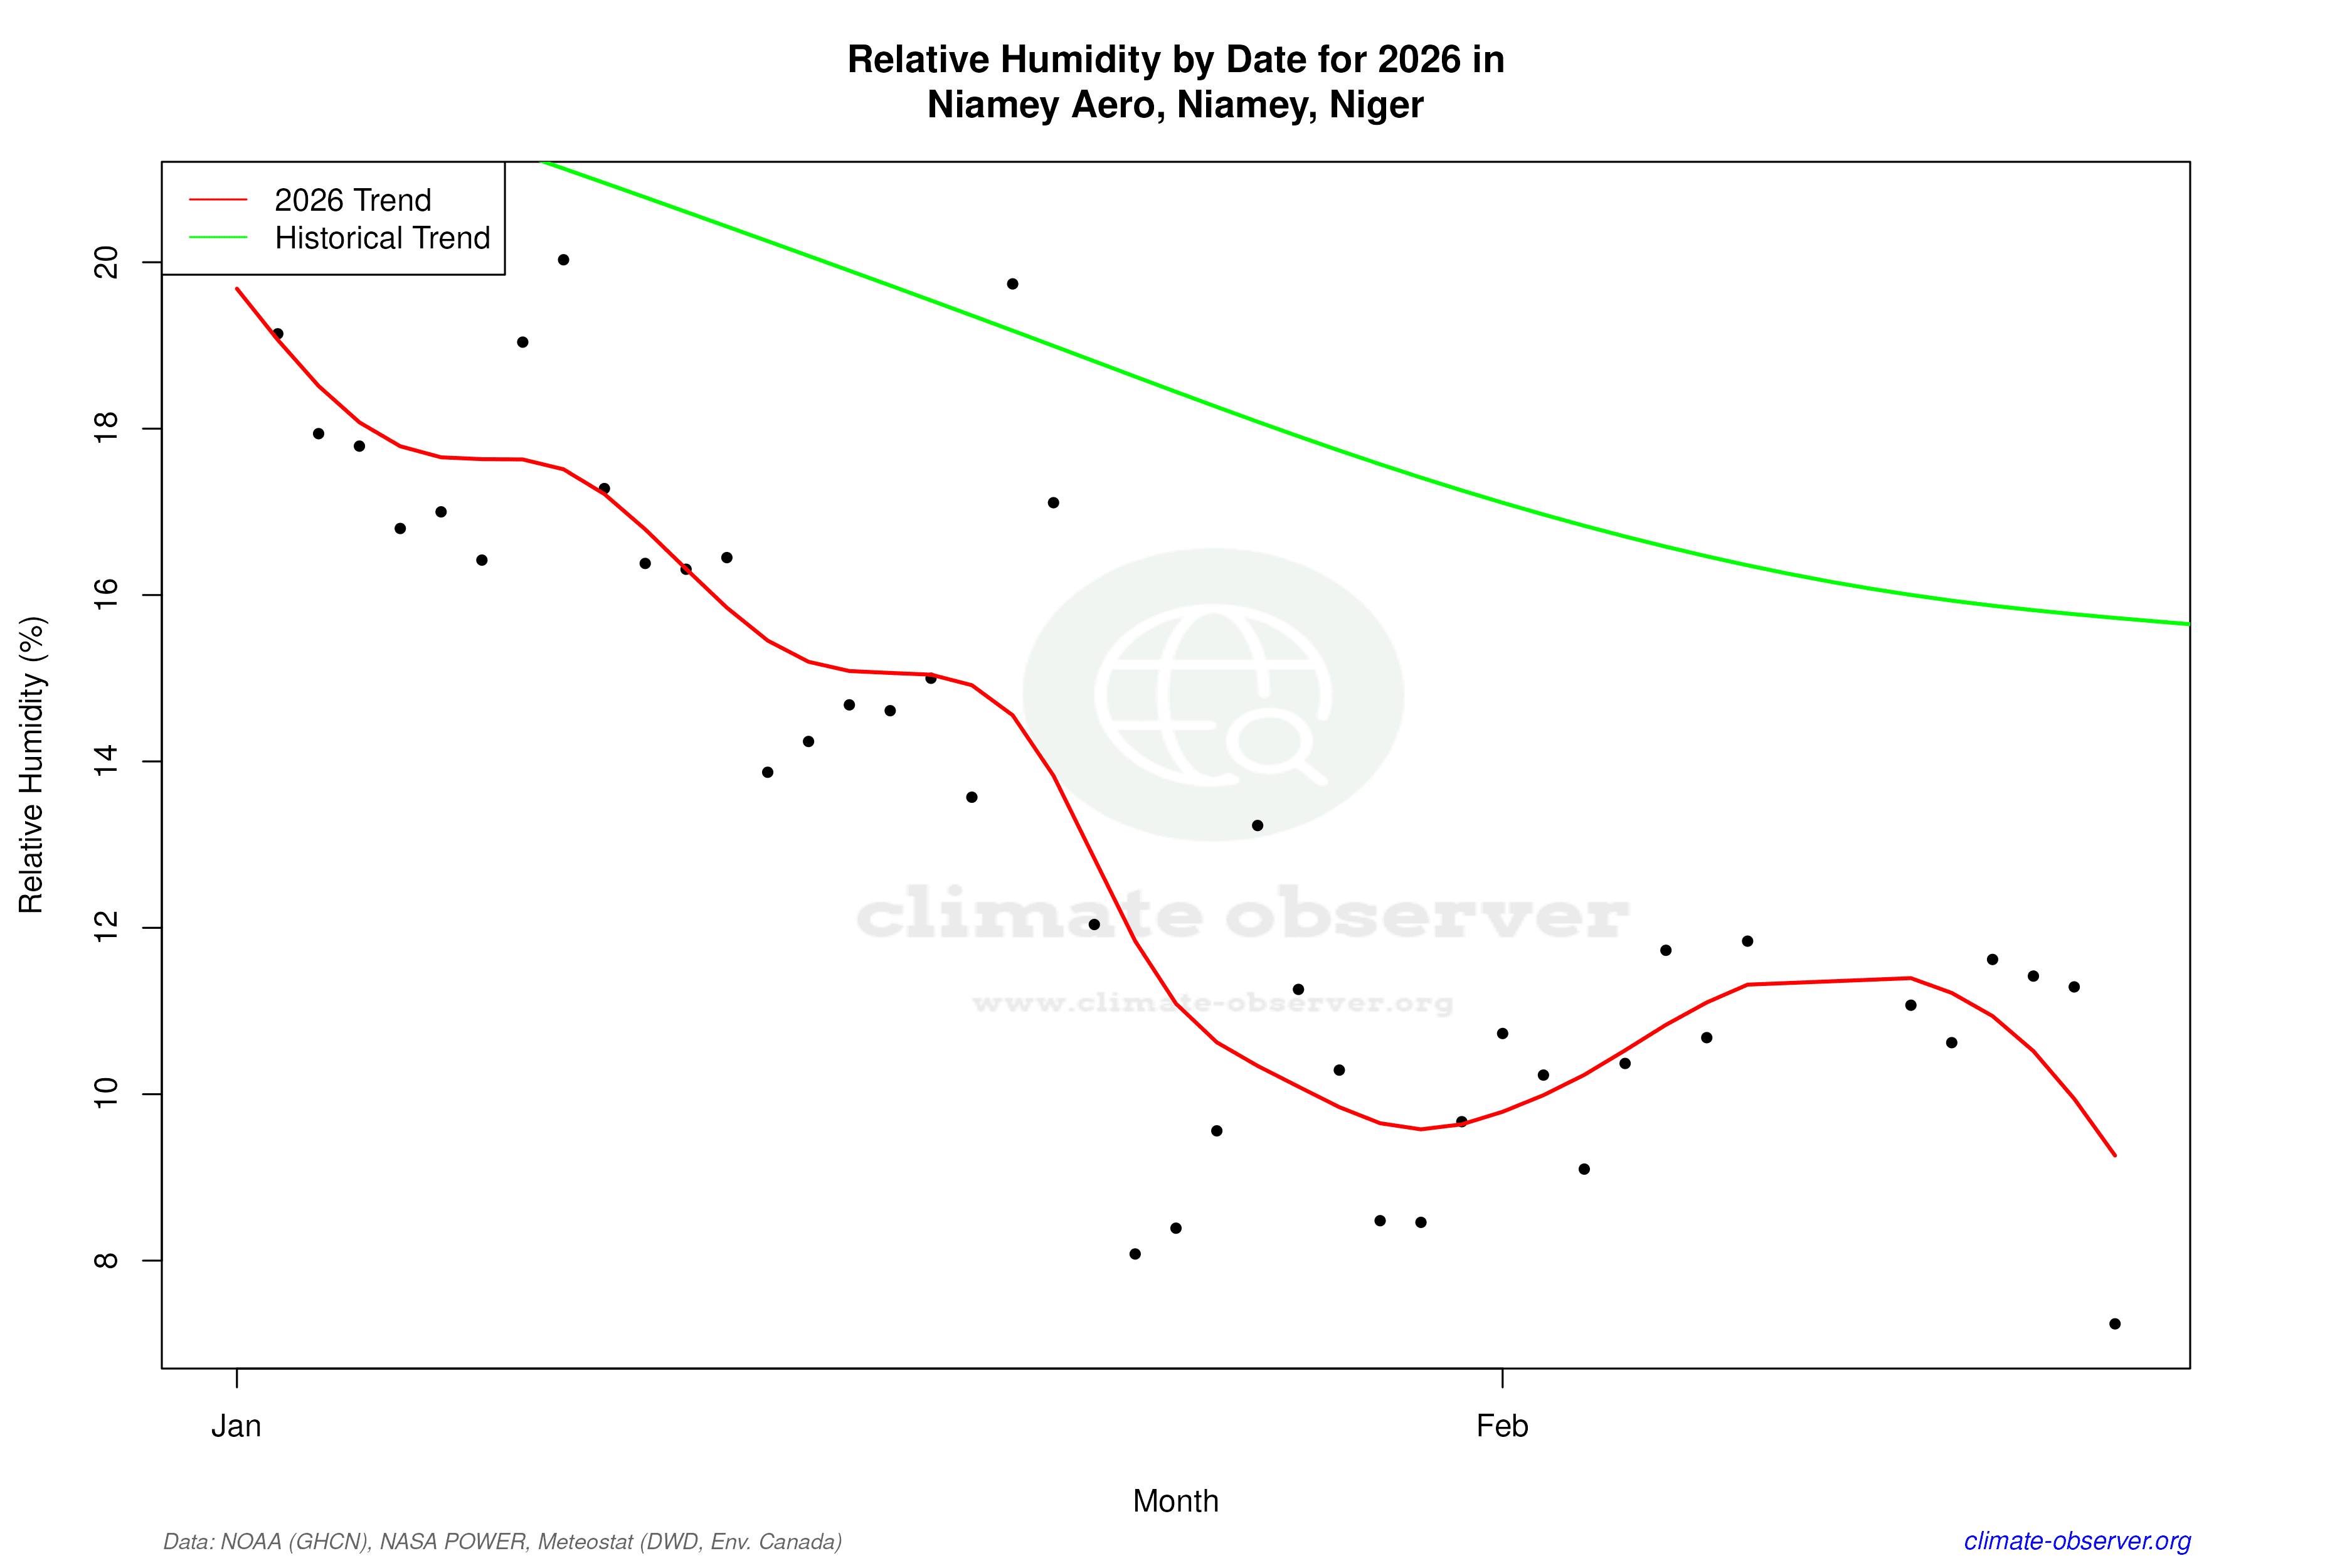

Max Temperature this Year | 1 of 6
Climate 12-Month Moving Averages


Max Temperature 12-Month MA | 1 of 6
Daily Data Points and Averages Throughout the Year


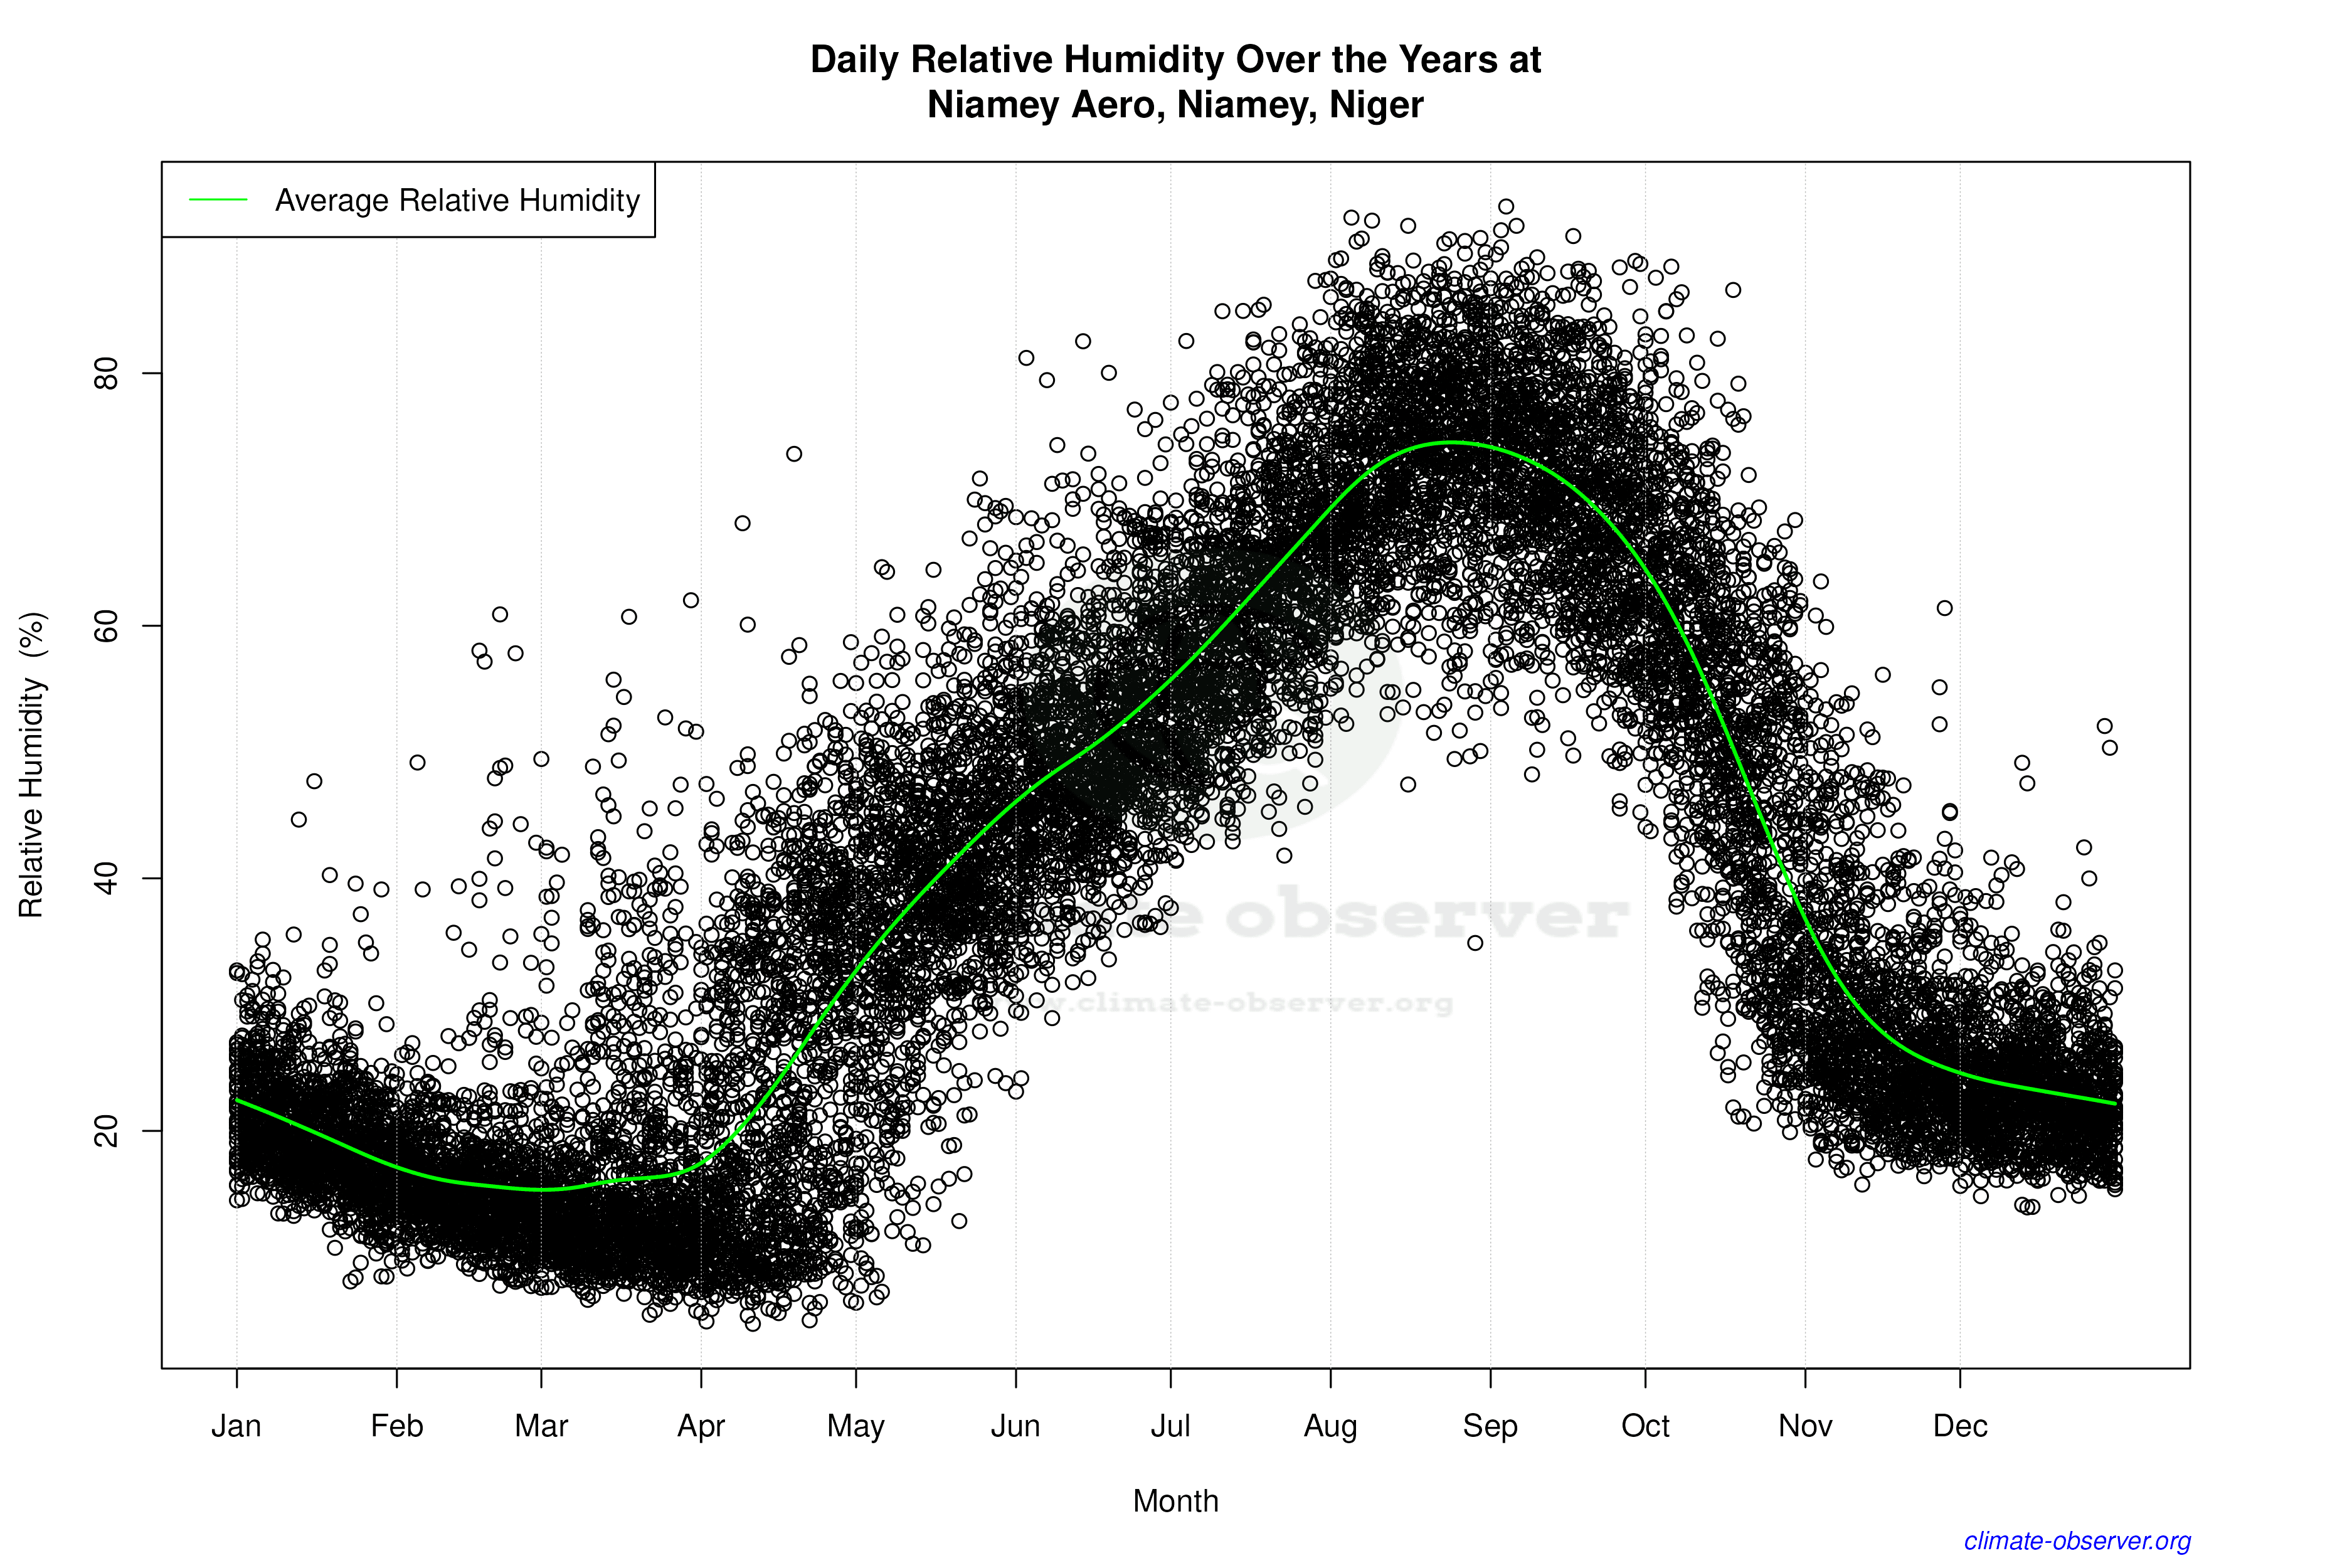

Average Max Temperature Throughout Year | 1 of 5
