Climate for Station: Zinder, Niger
Loading live weather...
Climate Analysis & Overview
Zinder's climate is marked by a complex interplay of warming and cooling trends, with recent years showing a noticeable rise in high temperatures. The precipitation pattern has become more concentrated, suggesting a shift towards fewer, more intense rainfall events. These changes are critical in the context of Niger's climate adaptation strategies.
Geographical Context and Climate Classification
Zinder, located at 13.8°N, 9.0°E, falls under the hot semi-arid climate classification (BSh) according to the Köppen system. This region, part of Niger's Sahel zone, experiences extreme temperatures and variable rainfall. The absence of significant geographical features like mountains or large bodies of water means that the climate is primarily influenced by the seasonal movement of the Intertropical Convergence Zone (ITCZ), which dictates the timing and intensity of the rainy season.
Temperature Trends: A Decade of Change
In the past decade, Zinder has experienced a warming trend in high temperatures, with an increase of 0.46°C (0.83°F). This is in contrast to the all-time trend, which shows a slight cooling of 0.03°C (0.05°F) in high temperatures. Meanwhile, the low temperatures have shown a cooling trend over the last ten years, decreasing by 0.37°C (0.67°F), whereas the all-time trend indicates a warming of 0.19°C (0.34°F). This divergence between short-term and long-term trends highlights the complexity of local climate dynamics.
Extreme Temperature Records
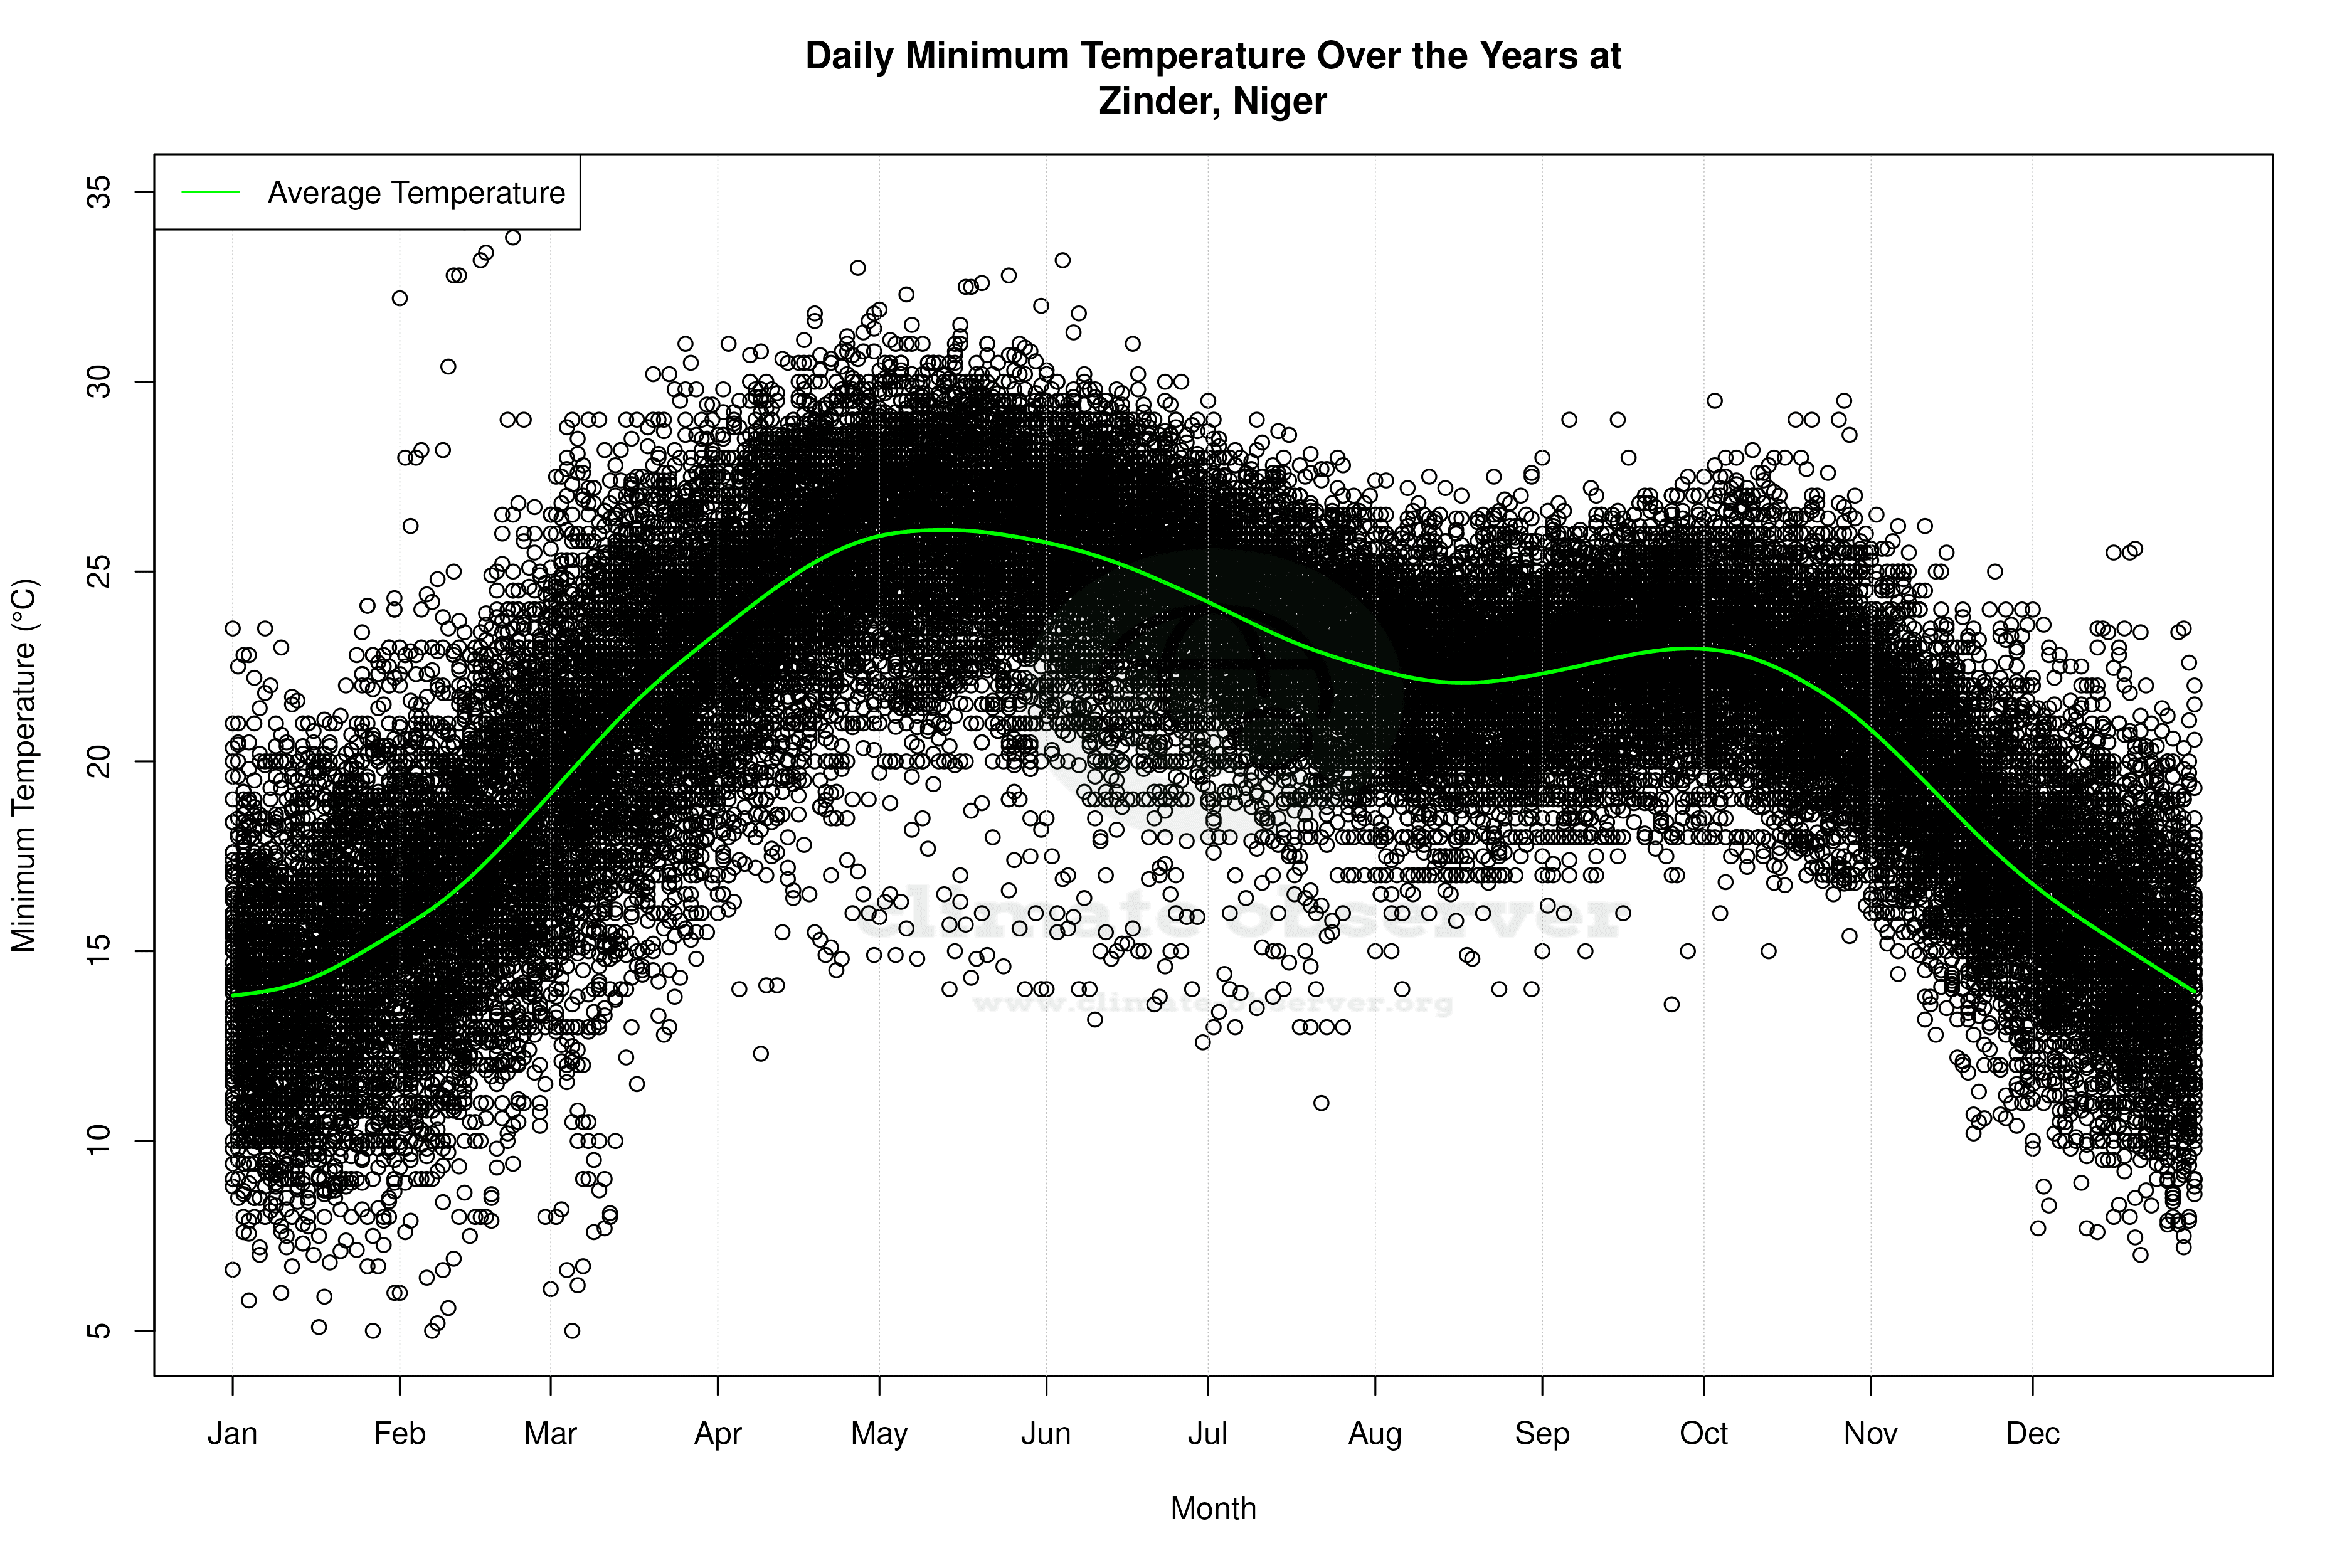
Zinder's climate is characterised by extreme temperatures, with historical records showing a maximum of 50.5°C (122.9°F) and a minimum of 5.0°C (41.0°F). These extremes reflect the harsh conditions typical of the Sahel, where temperature fluctuations can be severe, impacting agriculture and daily life.
Precipitation Patterns: Intensifying Extremes
The Precipitation Concentration Index (PCI) for Zinder has increased from a baseline of 29.5 to a current value of 33.4, indicating a more concentrated rainfall pattern. This shift suggests that precipitation is occurring in fewer, more intense events, which can lead to challenges such as flash flooding and soil erosion. Such changes are significant for a region heavily reliant on rain-fed agriculture.
Regional Implications and Climate Goals
These climatic shifts occur against the backdrop of Niger's regional climate goals, which aim to enhance resilience to climate change impacts. Recent weather events, such as prolonged dry spells and intense rainfall, underscore the urgency of these goals. Understanding the localised trends in Zinder is crucial for developing effective adaptation strategies that align with national and regional objectives.
Station Statistics
10-Year Trend
High: +0.28 °C/decade
Low: -0.35 °C/decade
Rain: +0.73 mm/decade
25-Year Trend
High: +0.22 °C/decade
Low: +0.27 °C/decade
Rain: +0.16 mm/decade
50-Year Trend
High: +0.27 °C/decade
Low: +0.17 °C/decade
Rain: +0.08 mm/decade
All-Time Trend
High: -0.02 °C/decade
Low: +0.18 °C/decade
Rain: -0.00 mm/decade
Percentage Above-Average Days
Last 12 Months: 55.1%
This Year: 86.8%
Precipitation Concentration Index (PCI) ℹ️
Last 12 Months: 39.5
Historical Average: 30.7
Percentile Rank of Last 12 Months ℹ️
High: 55th percentile
Low: 54th percentile
Rain: 90th percentile
Change in Variance ℹ️
High: -4.4%
Low: -3.9%
Intraday: -15.0%
Data Coverage
76.4%
First Year of Data
1906
Station Location
Historical Weather Records
| Max High | Avg High | Min High | Max Avg | Avg Avg | Min Avg | Max Low | Avg Low | Min Low | Max Precipitation | Avg Precipitation | Max Snow | Avg Snow | |
|---|---|---|---|---|---|---|---|---|---|---|---|---|---|
| Record | 50.5 °C | — | 15.4 °C | 40.3 °C | — | 13.1 °C | 34.8 °C | — | 5.0 °C | 217.2 mm | — | — | — |
| January | 39.6 °C | 30.0 °C | 17.5 °C | 33.1 °C | 22.8 °C | 13.1 °C | 24.3 °C | 14.5 °C | 5.0 °C | 2.0 mm | 0.0 mm | — | — |
| February | 45.8 °C | 33.2 °C | 21.3 °C | 36.2 °C | 25.7 °C | 15.4 °C | 34.8 °C | 17.1 °C | 5.0 °C | 13.5 mm | 0.1 mm | — | — |
| March | 49.2 °C | 37.6 °C | 24.0 °C | 38.3 °C | 30.1 °C | 17.5 °C | 31.0 °C | 21.4 °C | 5.0 °C | 3.6 mm | 0.0 mm | — | — |
| April | 49.5 °C | 40.6 °C | 28.3 °C | 39.7 °C | 33.7 °C | 24.3 °C | 33.0 °C | 24.8 °C | 12.3 °C | 20.3 mm | 0.1 mm | — | — |
| May | 50.5 °C | 40.9 °C | 28.6 °C | 40.3 °C | 34.3 °C | 25.3 °C | 32.8 °C | 26.0 °C | 14.0 °C | 99.9 mm | 0.9 mm | — | — |
| June | 49.1 °C | 38.7 °C | 25.2 °C | 40.0 °C | 32.4 °C | 23.3 °C | 33.2 °C | 25.1 °C | 12.6 °C | 99.9 mm | 1.9 mm | — | — |
| July | 46.2 °C | 34.8 °C | 23.1 °C | 36.1 °C | 29.3 °C | 20.9 °C | 29.5 °C | 23.3 °C | 11.0 °C | 217.2 mm | 5.8 mm | — | — |
| August | 41.4 °C | 32.6 °C | 21.4 °C | 34.6 °C | 27.9 °C | 19.9 °C | 27.6 °C | 22.2 °C | 14.0 °C | 119.0 mm | 7.7 mm | — | — |
| September | 44.0 °C | 35.2 °C | 23.2 °C | 35.7 °C | 29.4 °C | 22.1 °C | 29.0 °C | 22.7 °C | 13.6 °C | 99.9 mm | 3.0 mm | — | — |
| October | 45.6 °C | 37.5 °C | 27.1 °C | 36.0 °C | 30.6 °C | 24.0 °C | 29.5 °C | 22.3 °C | 15.0 °C | 84.0 mm | 0.3 mm | — | — |
| November | 42.5 °C | 34.6 °C | 23.5 °C | 34.5 °C | 27.5 °C | 18.2 °C | 26.5 °C | 18.8 °C | 10.2 °C | 17.2 mm | 0.0 mm | — | — |
| December | 43.8 °C | 30.8 °C | 15.4 °C | 32.7 °C | 23.7 °C | 14.4 °C | 25.6 °C | 15.3 °C | 7.0 °C | 29.3 mm | 0.0 mm | — | — |
Data Visualisations
Remove WatermarksCurrent Year Climate Trends vs Historical


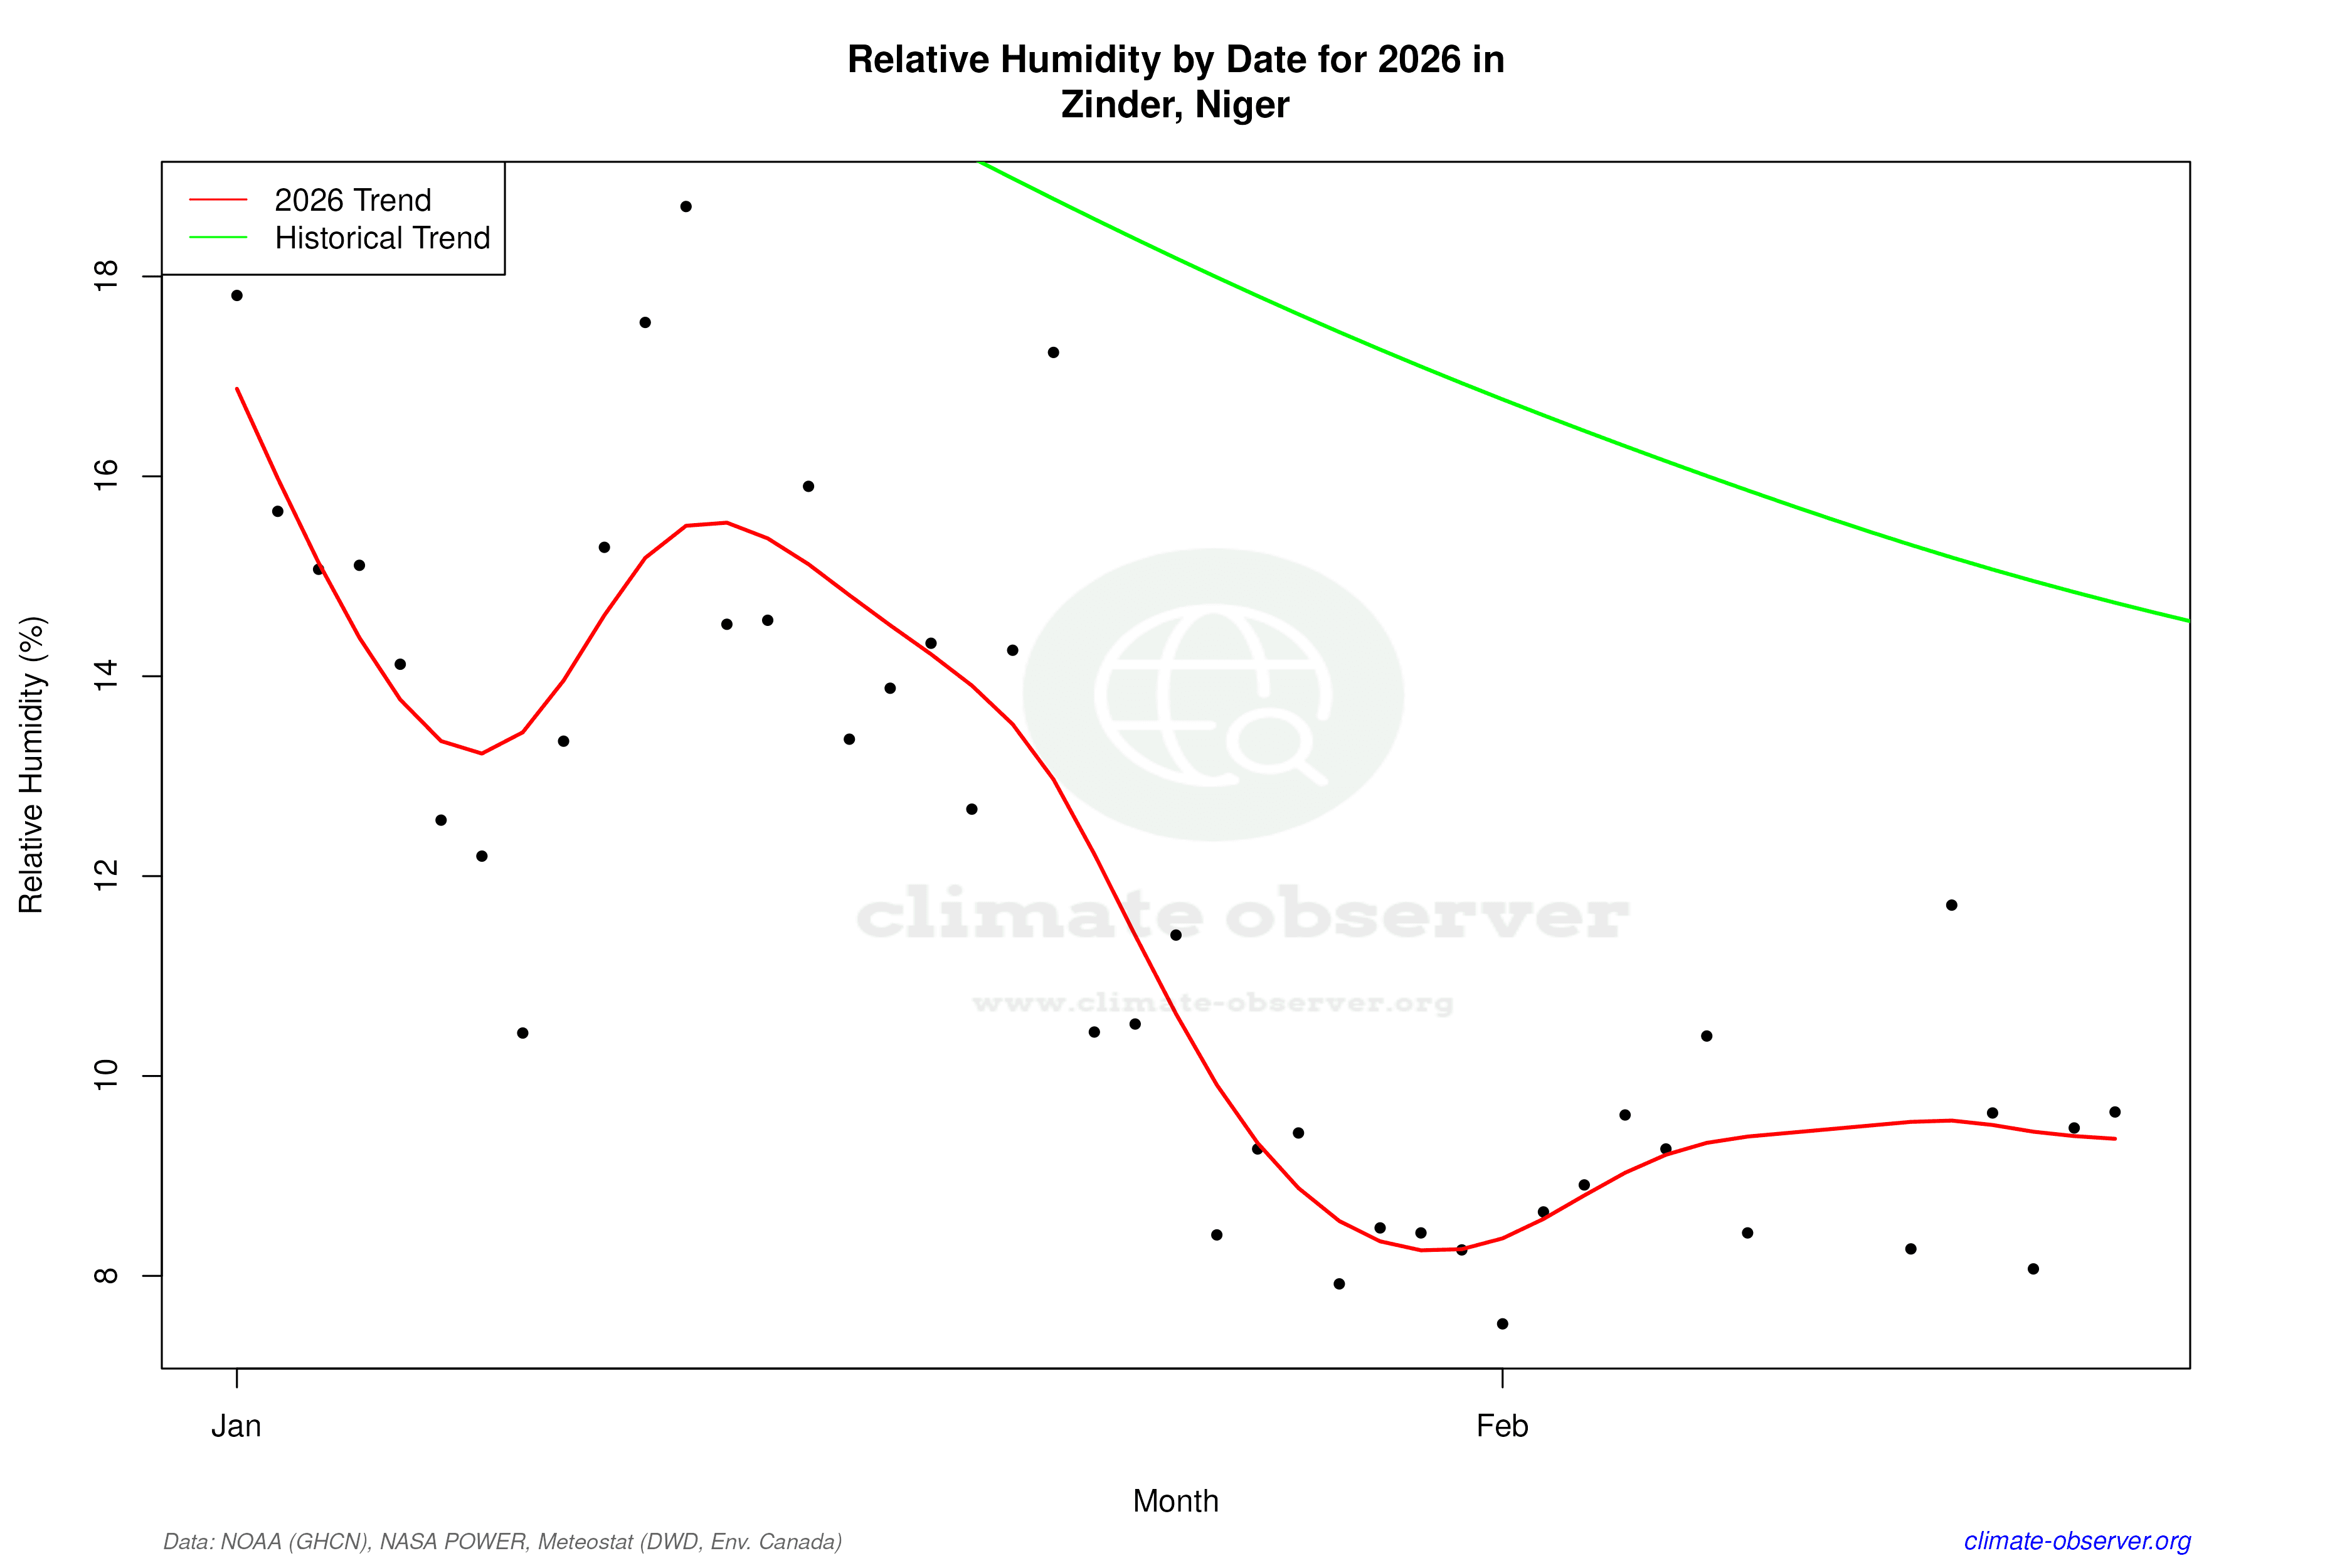

Max Temperature this Year | 1 of 6
Climate 12-Month Moving Averages

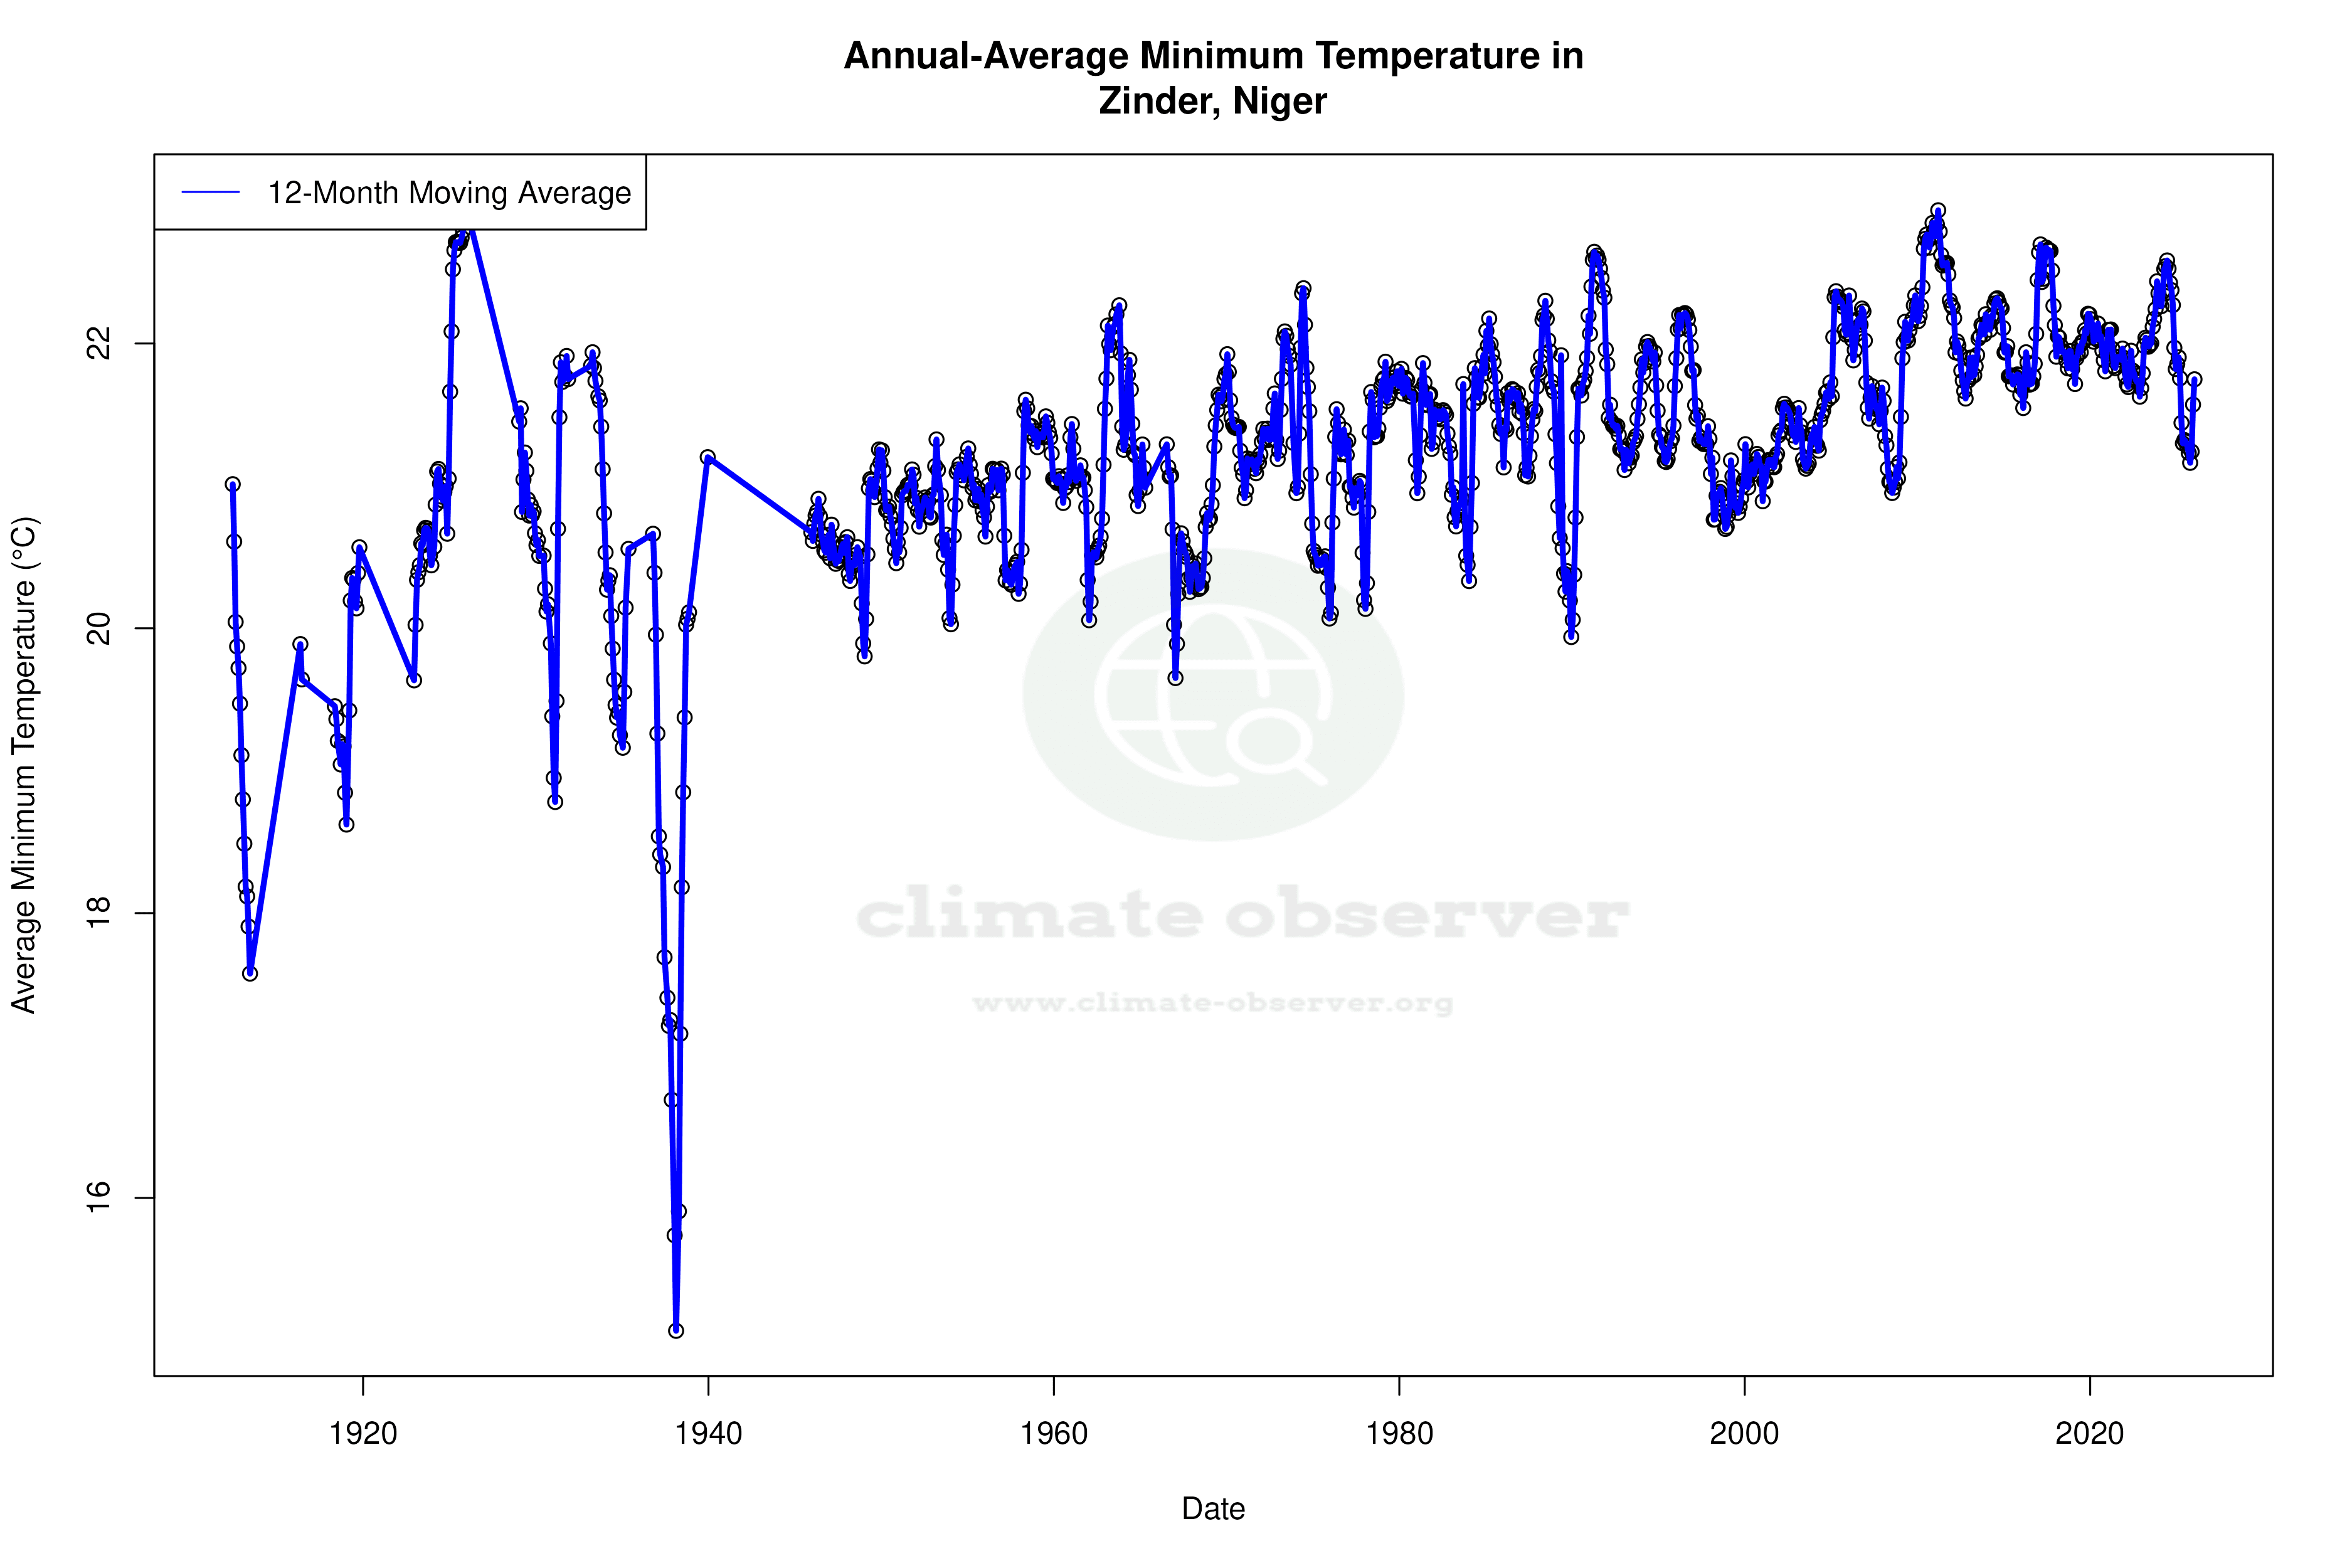
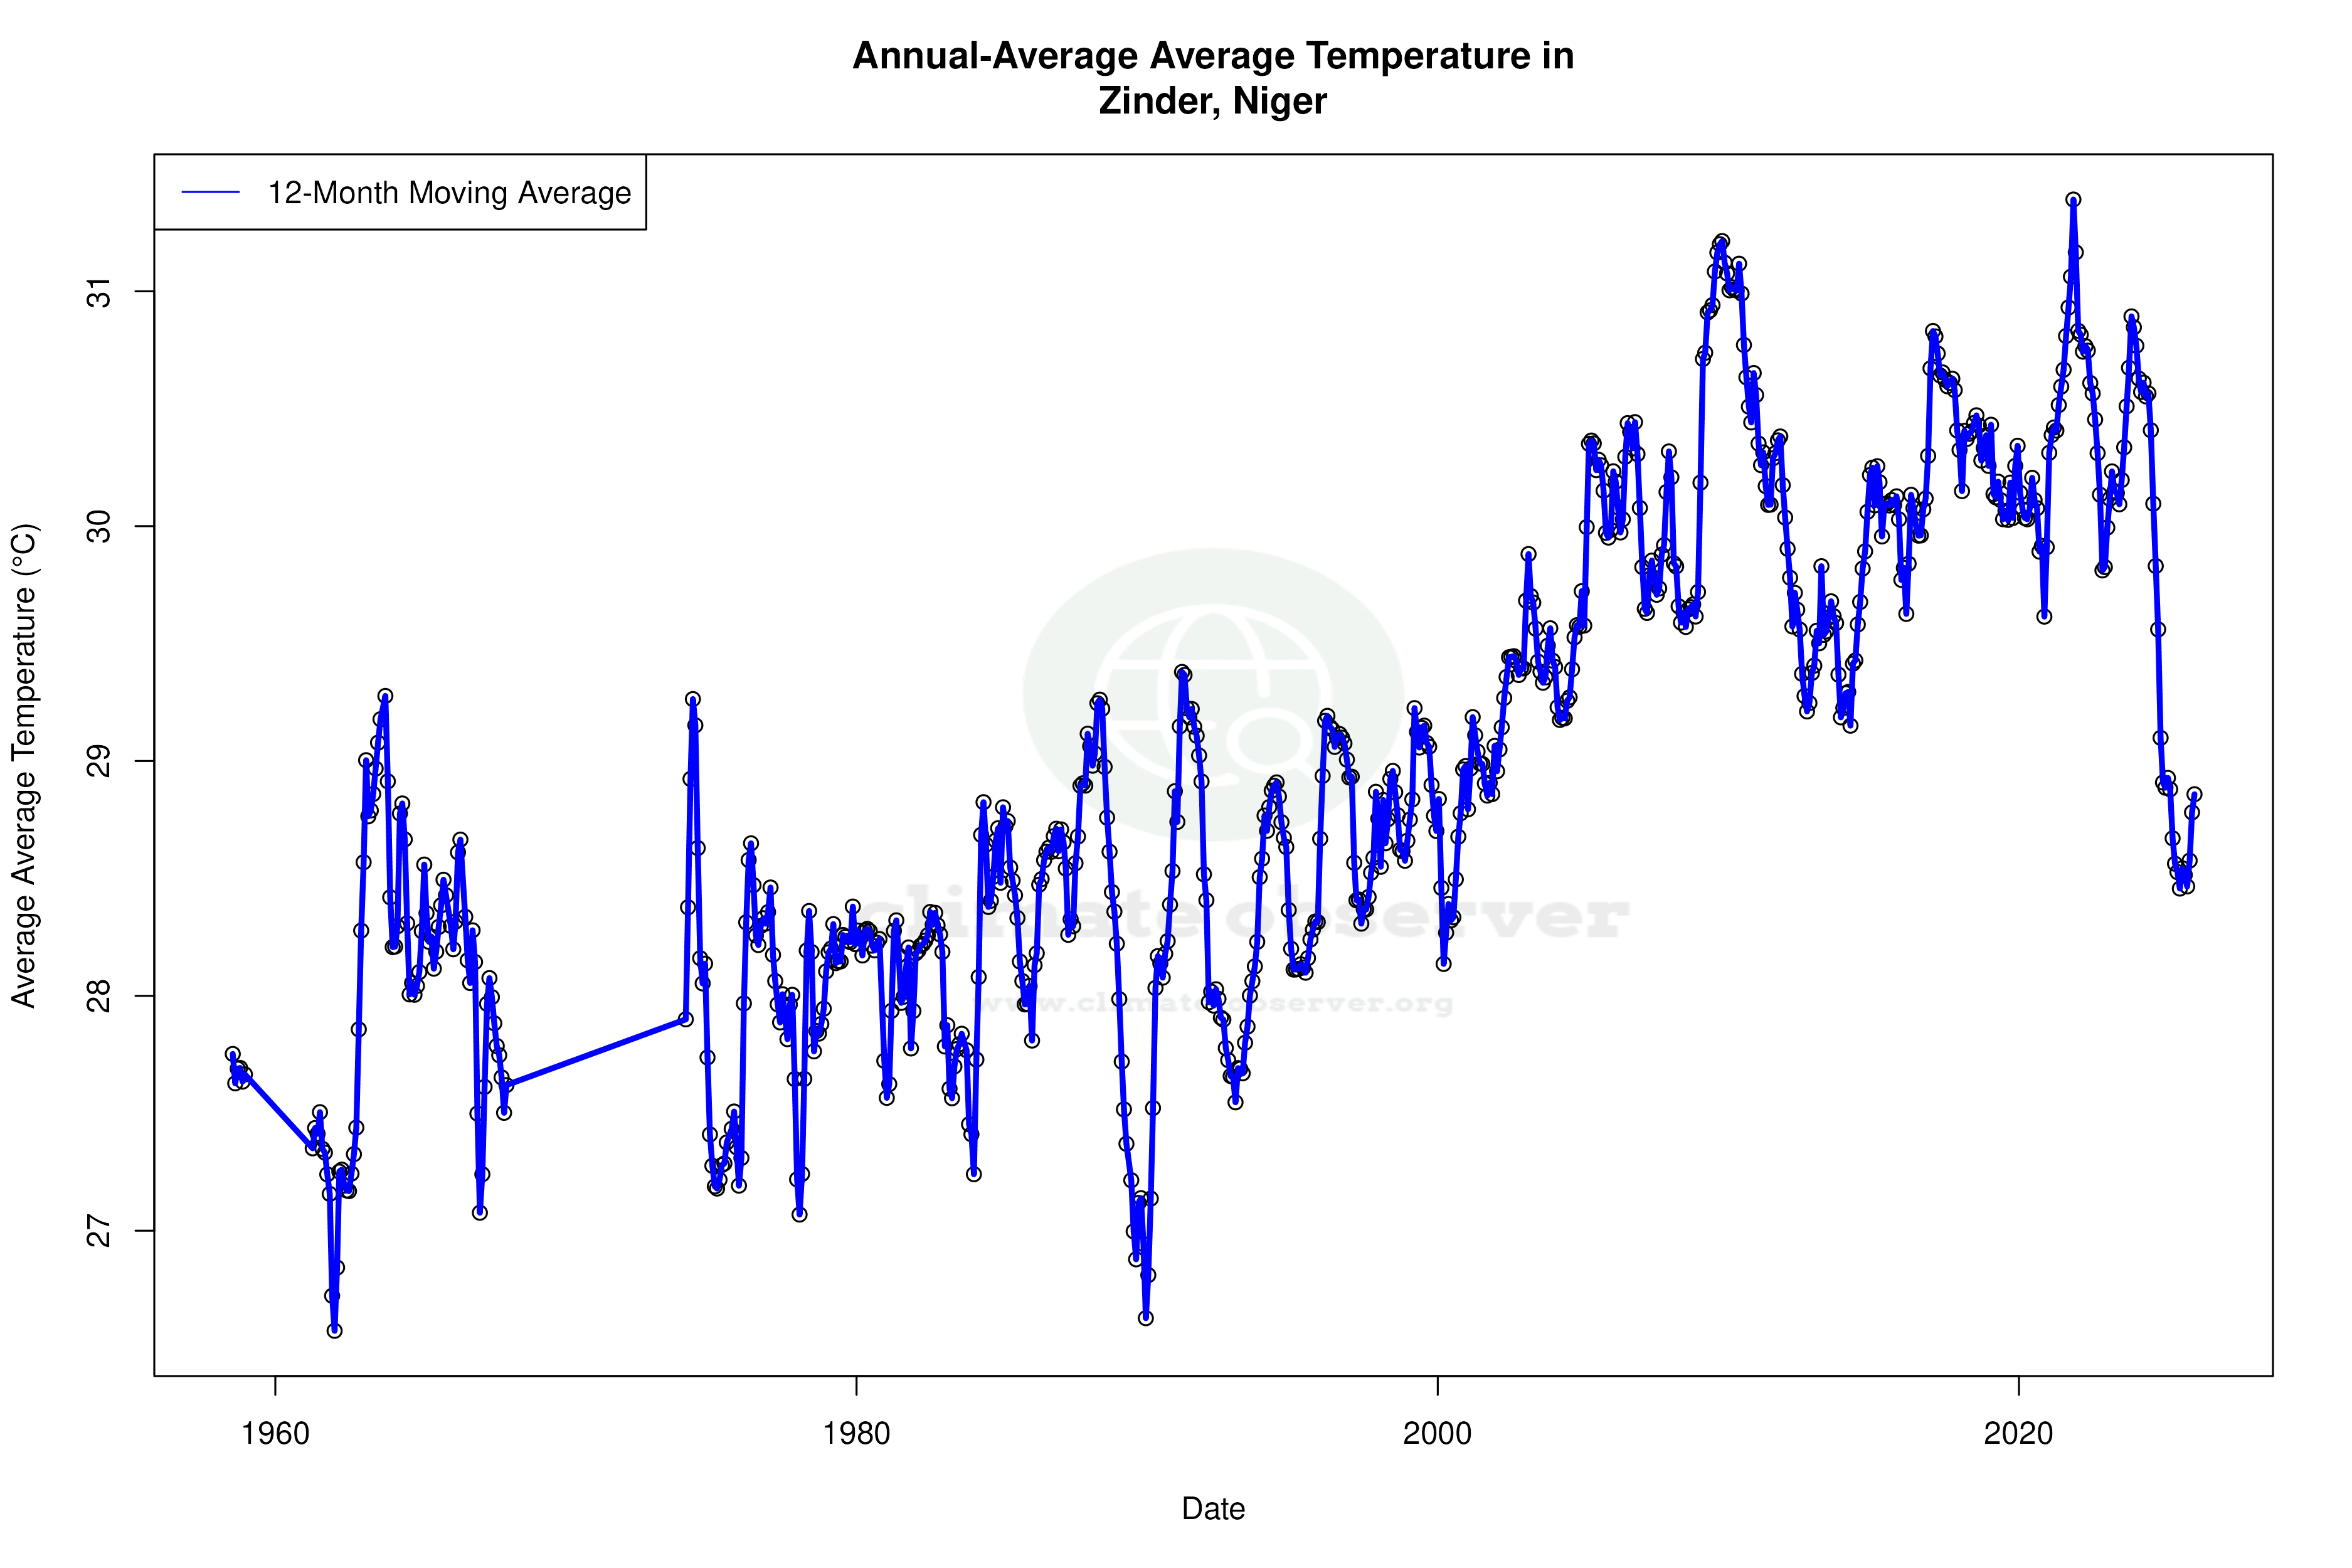
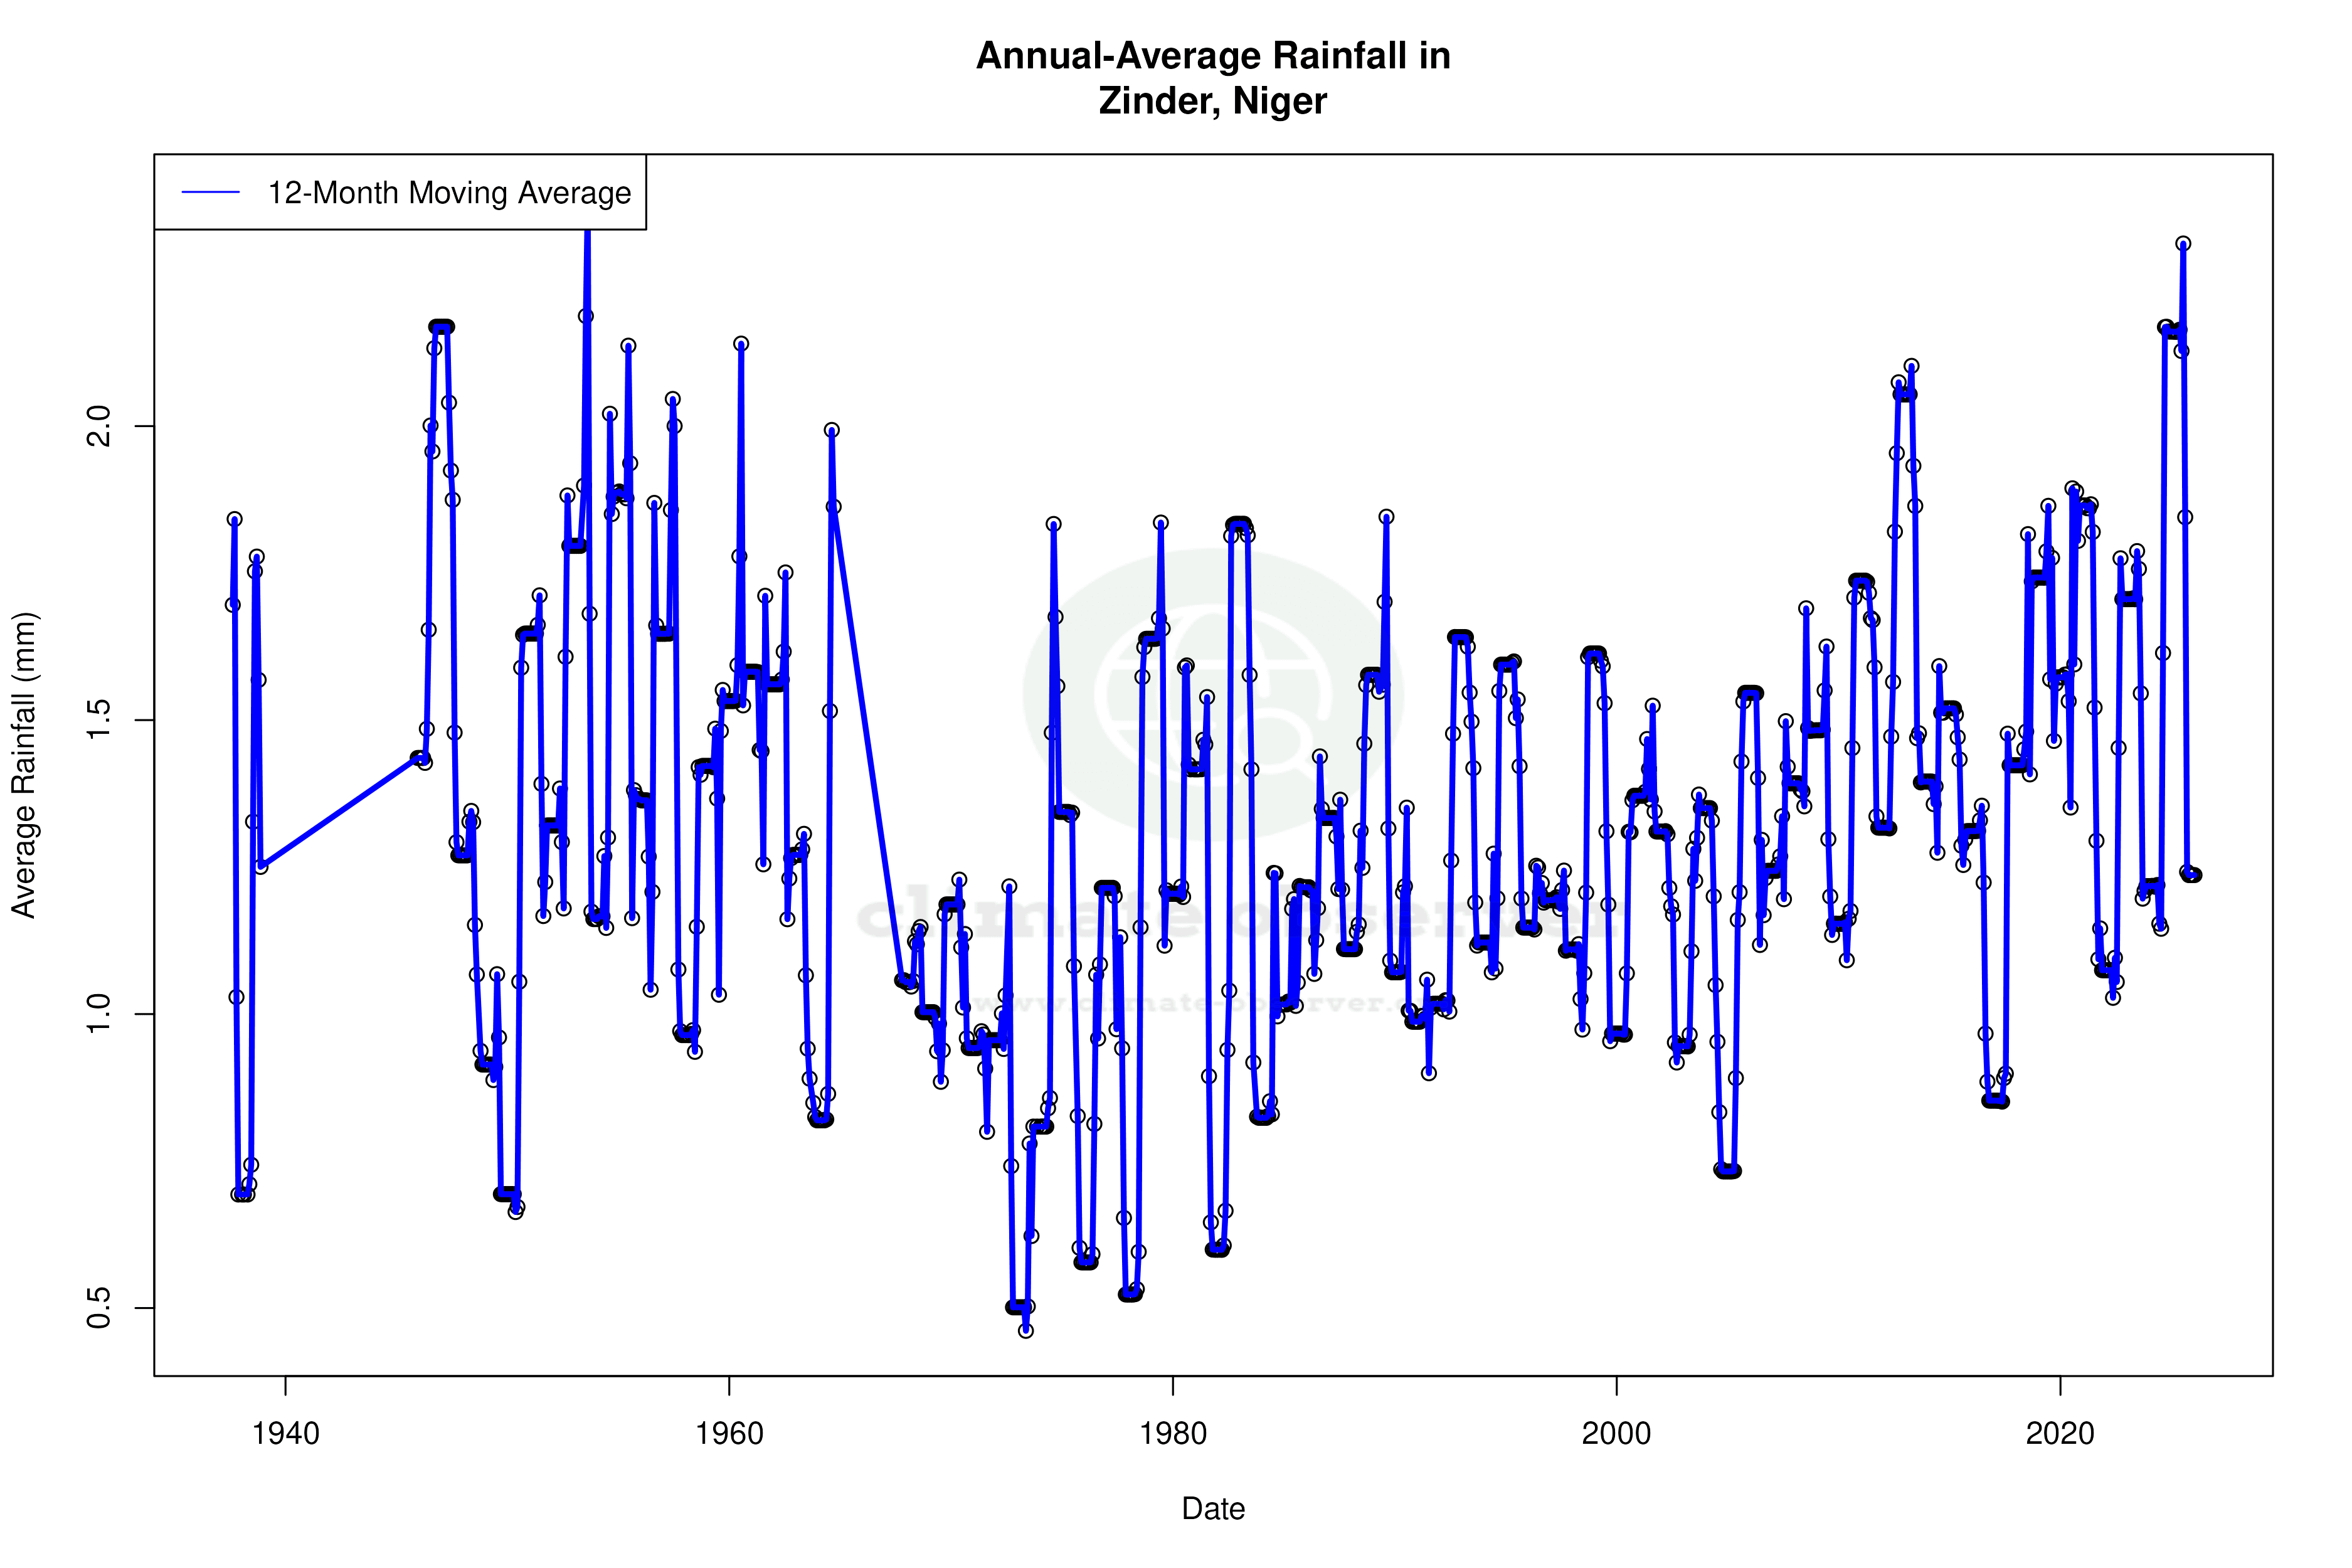


Max Temperature 12-Month MA | 1 of 6
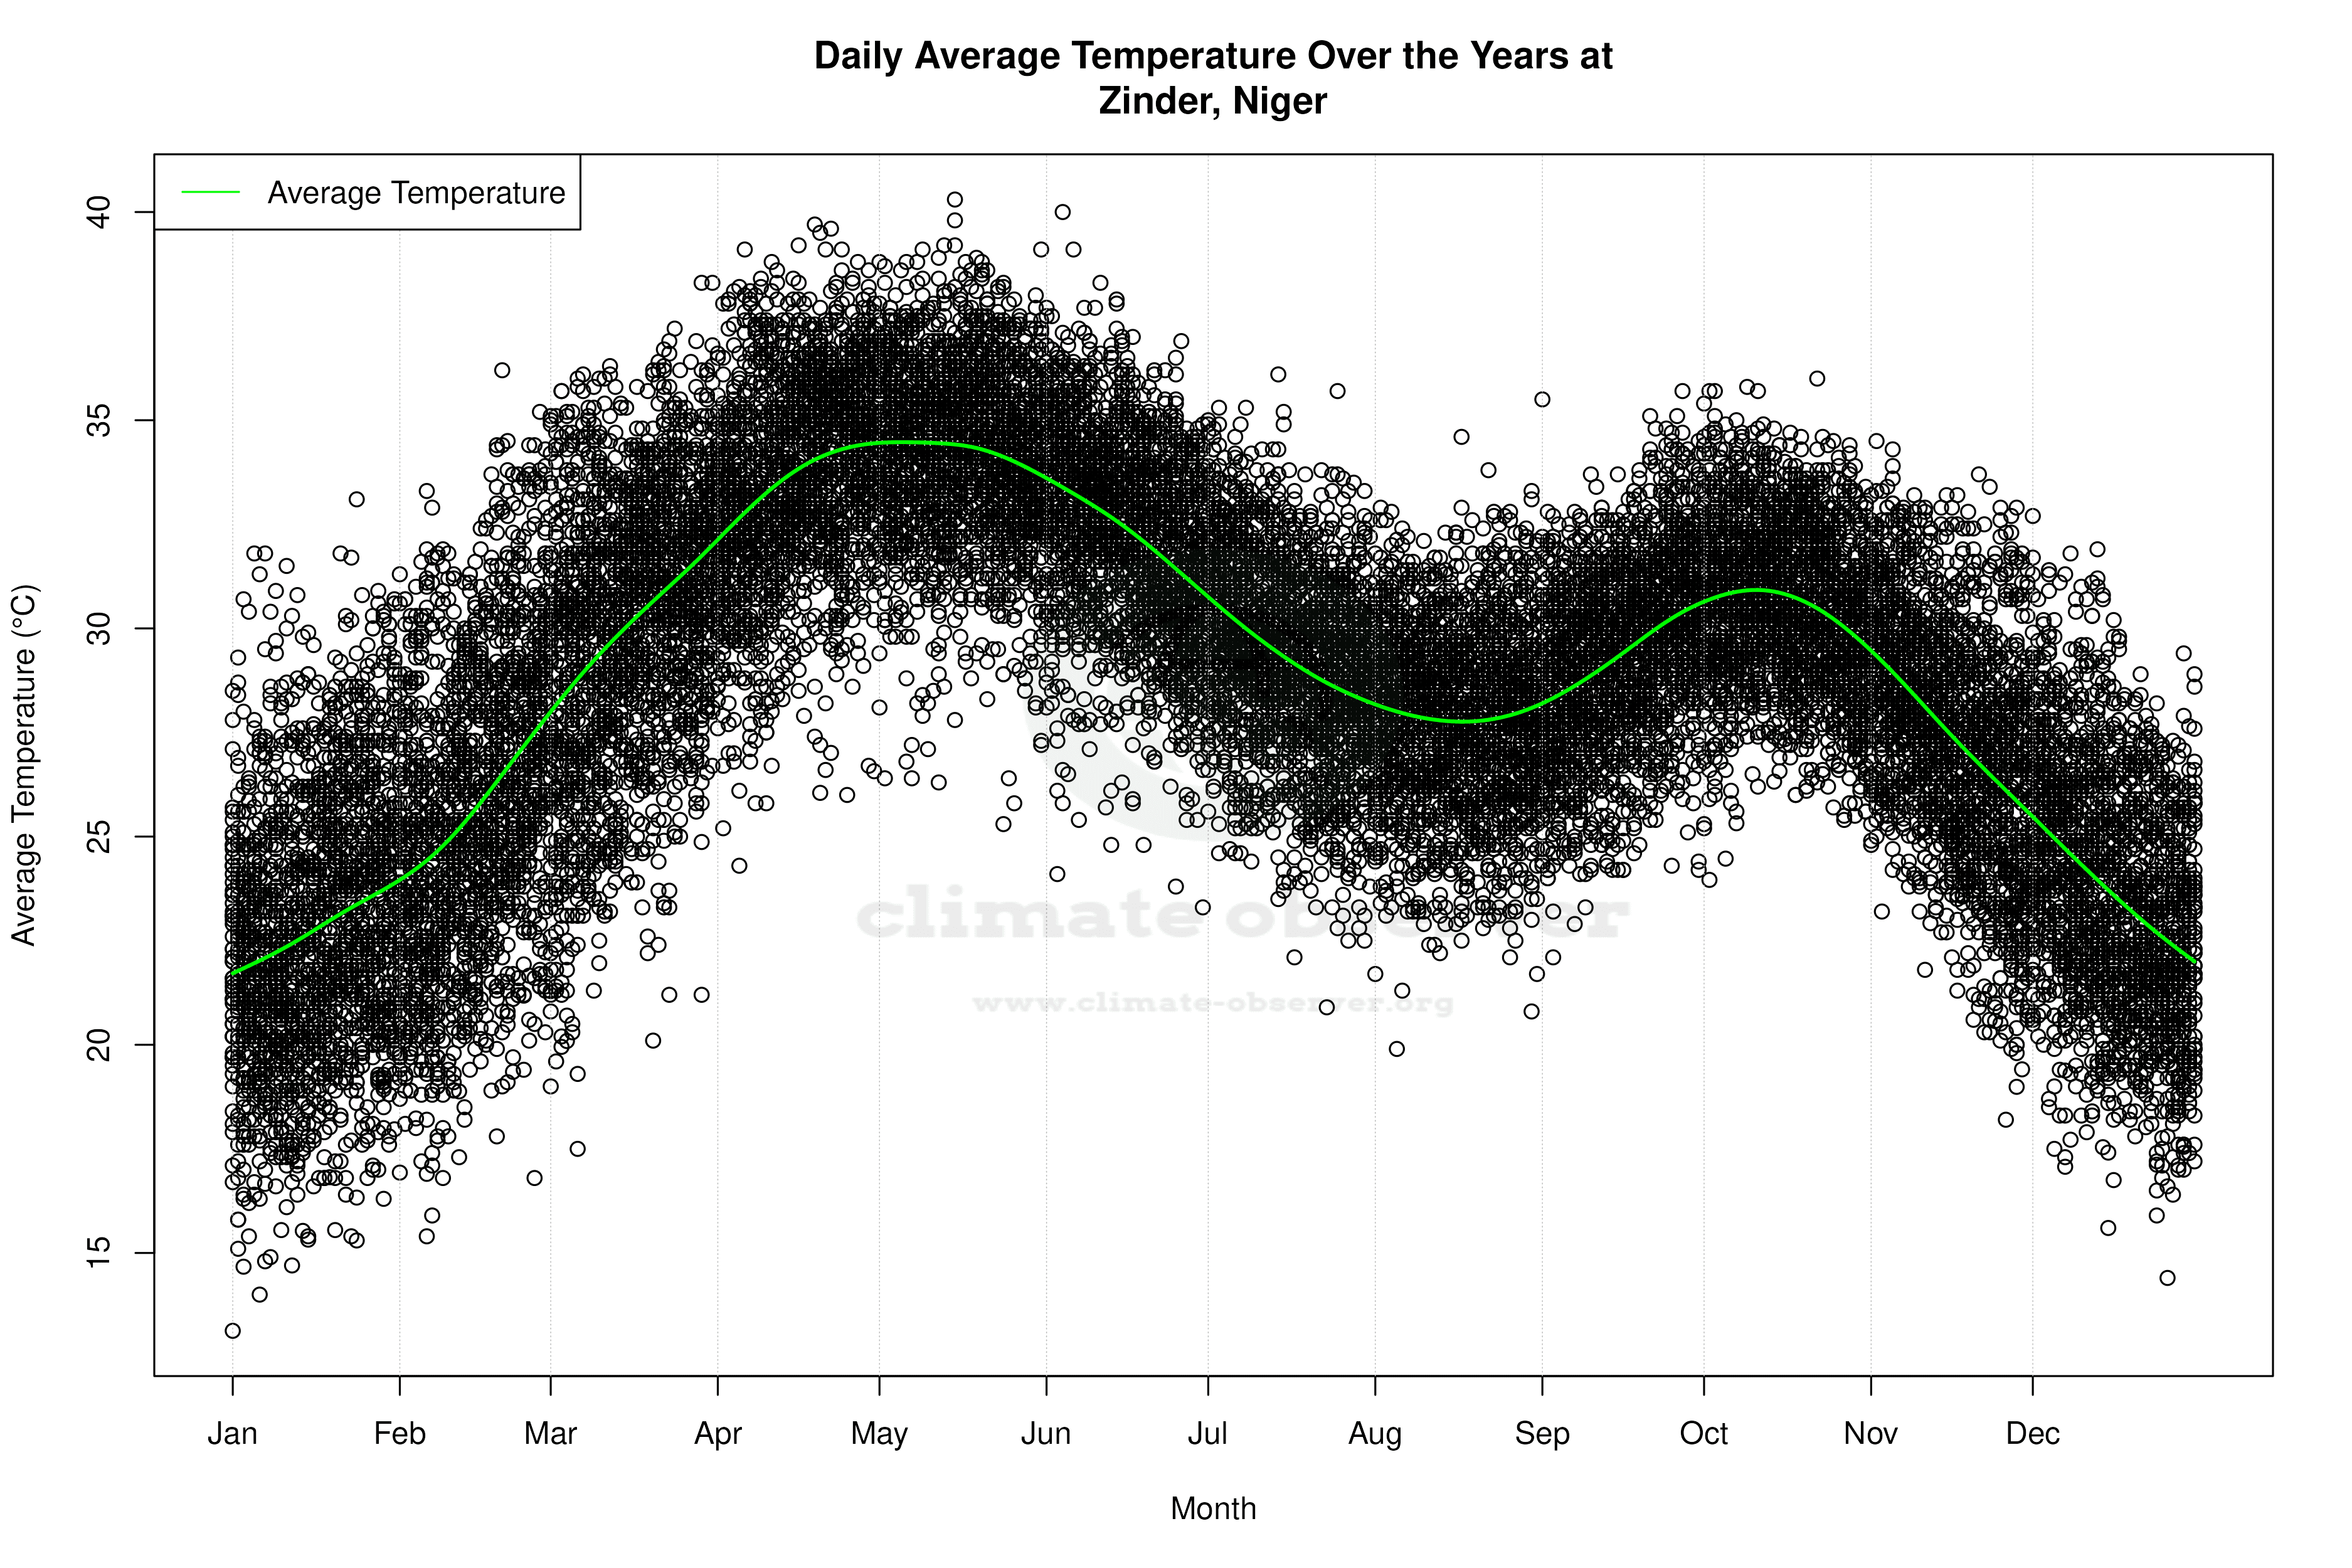
Daily Data Points and Averages Throughout the Year
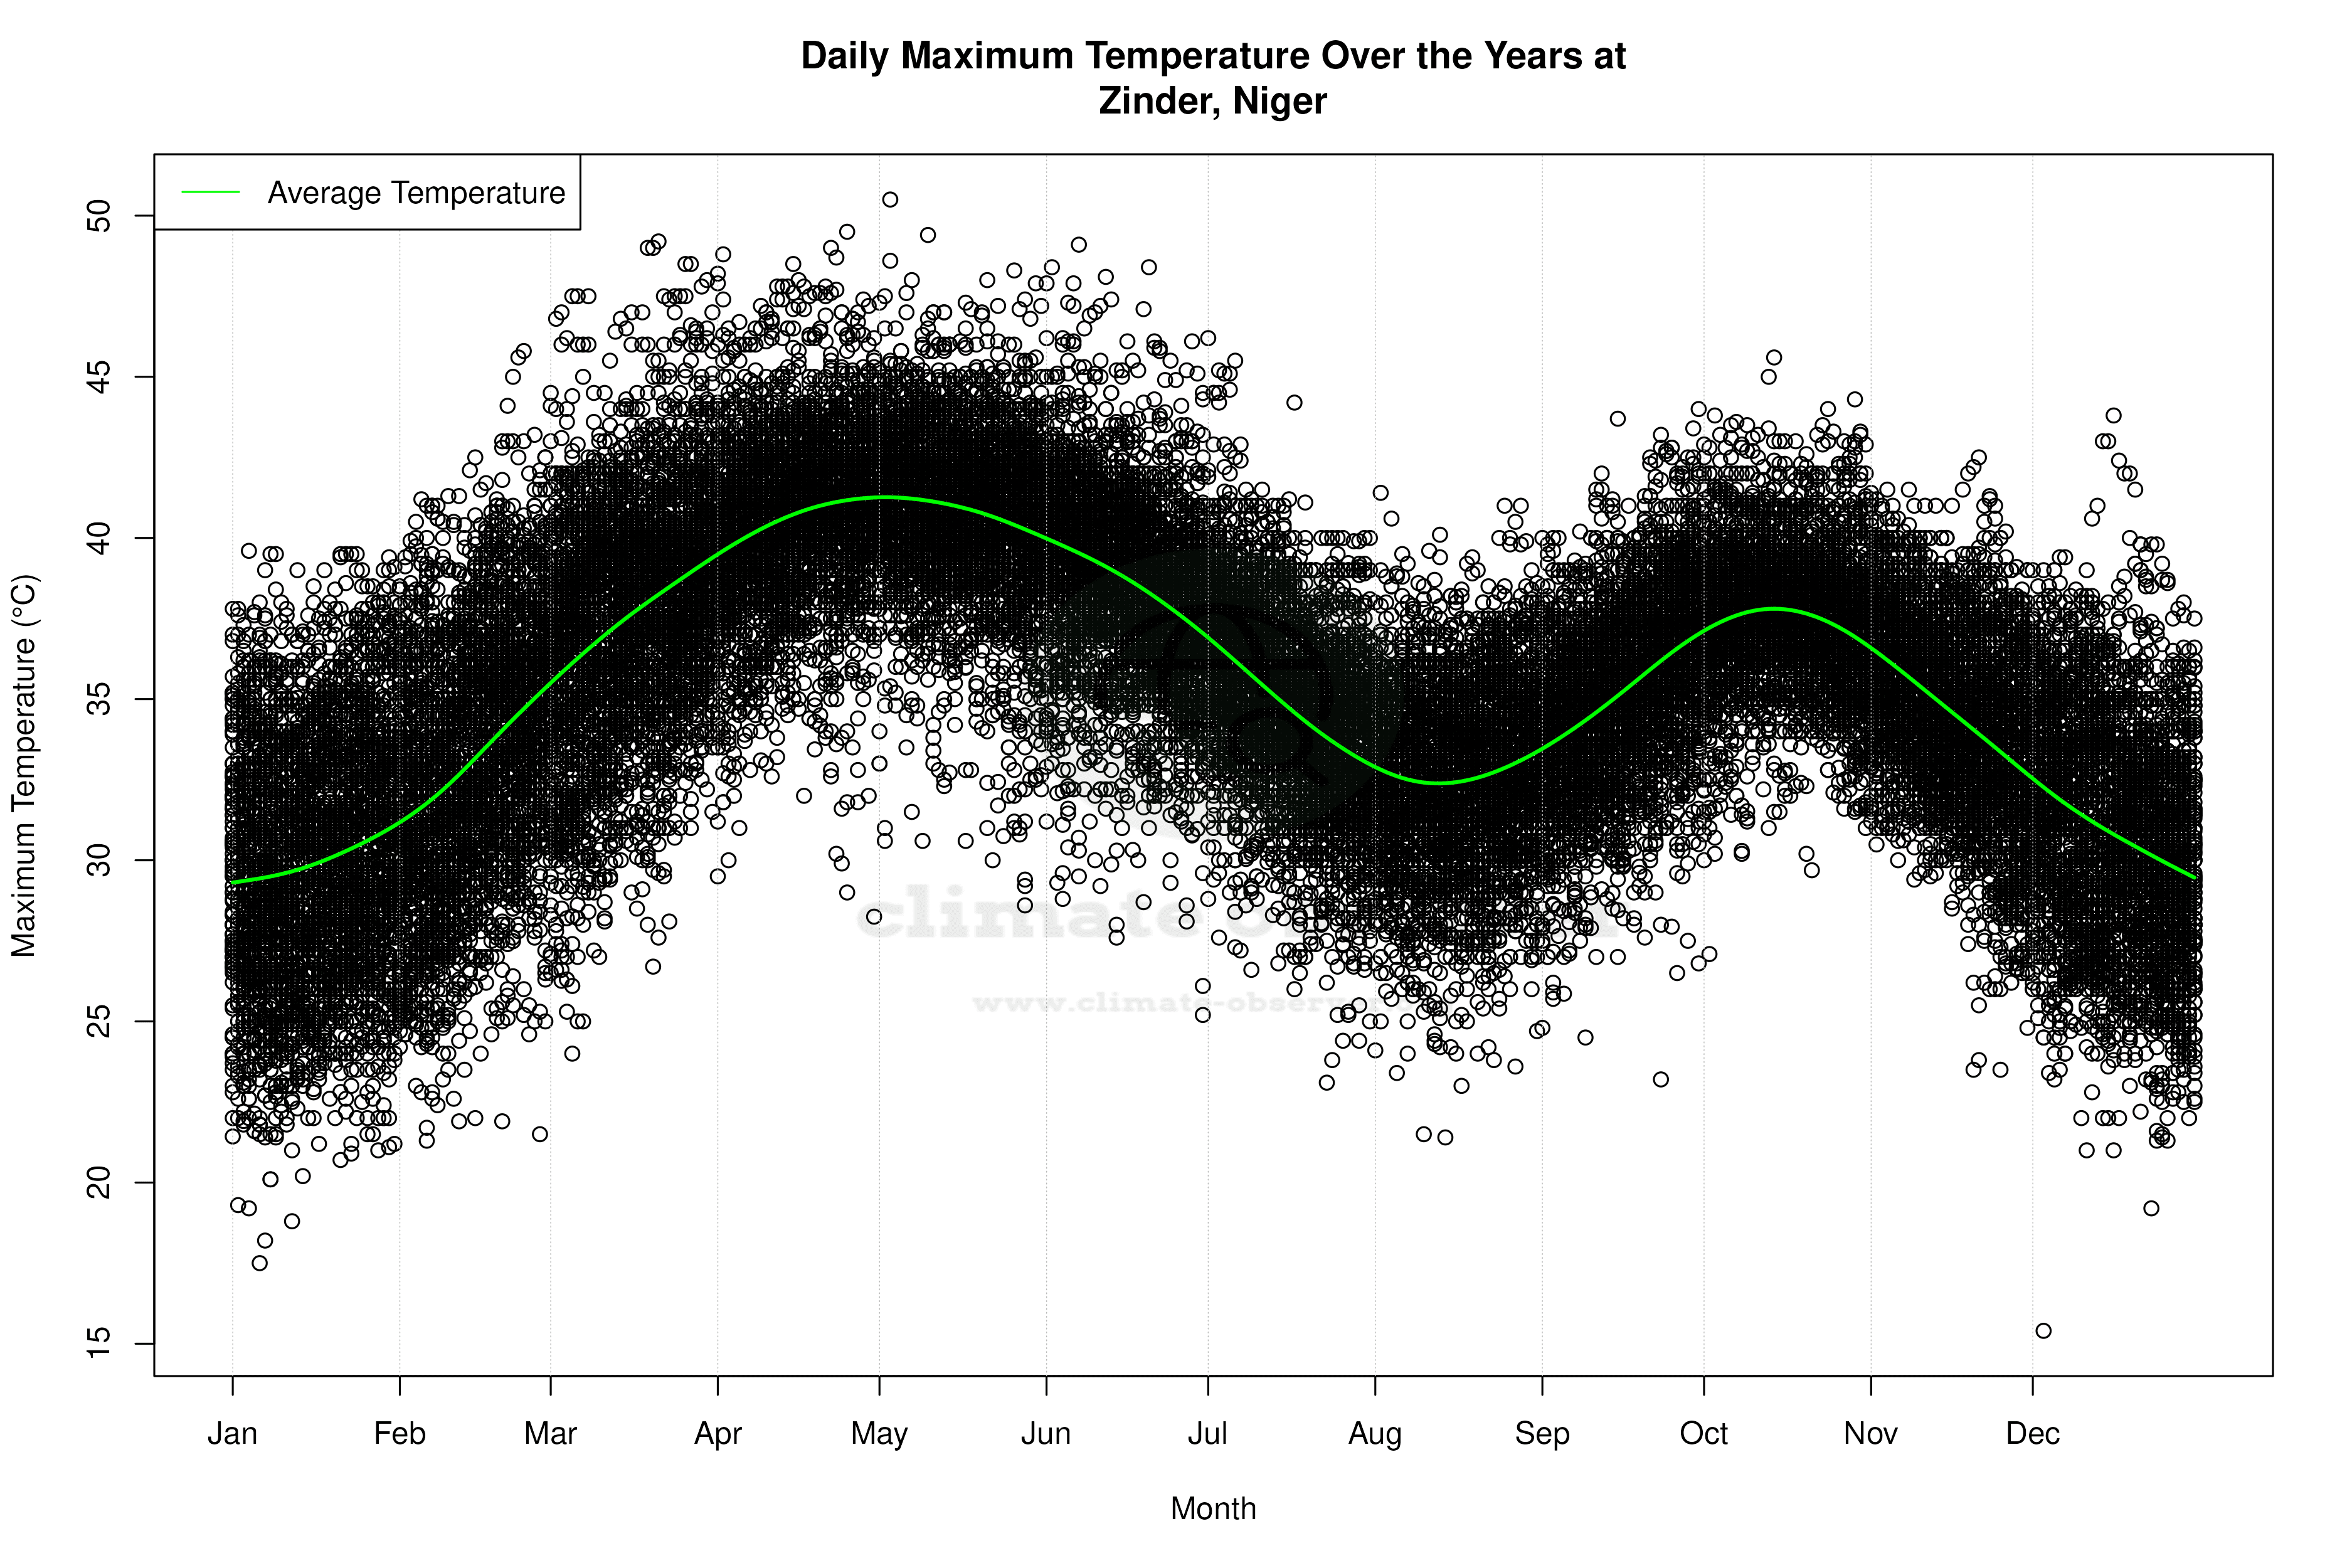


Average Max Temperature Throughout Year | 1 of 5
