Climate for Station: Agadez, Niger
Loading live weather...
Climate Analysis & Overview
Agadez, situated in the heart of Niger, is experiencing a warming trend in both high and low temperatures over the long term, with a significant increase in precipitation concentration. These climatic shifts pose challenges to regional climate goals, emphasizing the need for adaptive strategies.
Desert Climate Dynamics
Agadez is classified under the BWh category of the Köppen climate classification, indicative of a hot desert climate. This arid environment is characterized by extreme temperatures and minimal precipitation. The city's geographical position in the Sahara Desert significantly influences its climate, leading to high temperature variability and scarce rainfall. Over the past decade, Agadez has experienced a 0.08°C (0.14°F) increase in low temperatures, while high temperatures have shown a slight decrease of 0.02°C (0.04°F). However, the all-time trends reveal a more pronounced warming, with highs rising by 0.27°C (0.49°F) and lows by 0.38°C (0.68°F). These trends suggest a gradual warming of the region, aligning with broader global patterns of climate change.
Temperature Extremes
Agadez's temperature records highlight the extremities of its desert climate. The highest recorded temperature stands at 49.1°C (120.4°F), while the lowest dips to 3.4°C (38.1°F). These extremes underscore the harsh conditions that the local population must endure. The warming trend in low temperatures may provide some relief during the coldest periods, yet the rising highs could exacerbate heat-related challenges.
Precipitation Patterns and Challenges
The Precipitation Concentration Index (PCI) for Agadez has increased from a baseline of 35.6 to a current value of 40.3. This significant rise indicates that rainfall events are becoming more concentrated, leading to intense but infrequent downpours. Such changes can result in flash flooding and soil erosion, complicating water management and agricultural practices. The increase in PCI also suggests that the region's already scarce water resources are becoming even less predictable, posing a threat to local livelihoods.
Regional Implications and Adaptation
The climatic shifts observed in Agadez are reflective of broader regional challenges faced by Niger. The country's climate goals focus on enhancing resilience to climate change impacts, particularly in arid and semi-arid regions. Recent weather events, such as severe droughts and floods, have highlighted the urgency of these efforts. As temperatures rise and precipitation becomes more erratic, adaptive strategies will be crucial to ensure sustainable development and food security in Agadez and beyond.
Station Statistics
10-Year Trend
High: -0.00 °C/decade
Low: +0.17 °C/decade
Rain: -0.16 mm/decade
25-Year Trend
High: +0.00 °C/decade
Low: +0.13 °C/decade
Rain: -0.00 mm/decade
50-Year Trend
High: +0.31 °C/decade
Low: +0.37 °C/decade
Rain: +0.03 mm/decade
All-Time Trend
High: +0.27 °C/decade
Low: +0.38 °C/decade
Rain: +0.03 mm/decade
Percentage Above-Average Days
Last 12 Months: 57.5%
This Year: 67.9%
Precipitation Concentration Index (PCI) ℹ️
Last 12 Months: 42.4
Historical Average: 37.5
Percentile Rank of Last 12 Months ℹ️
High: 63rd percentile
Low: 73rd percentile
Rain: 46th percentile
Change in Variance ℹ️
High: -2.2%
Low: -2.7%
Intraday: -6.9%
Data Coverage
82.2%
First Year of Data
1957
Station Location
Historical Weather Records
| Max High | Avg High | Min High | Max Avg | Avg Avg | Min Avg | Max Low | Avg Low | Min Low | Max Precipitation | Avg Precipitation | Max Snow | Avg Snow | |
|---|---|---|---|---|---|---|---|---|---|---|---|---|---|
| Record | 49.1 °C | — | 19.5 °C | 42.7 °C | — | 12.3 °C | 35.7 °C | — | 3.4 °C | 68.3 mm | — | — | — |
| January | 40.0 °C | 28.4 °C | 19.5 °C | 32.6 °C | 21.7 °C | 12.3 °C | 22.6 °C | 12.8 °C | 4.2 °C | 1.0 mm | 0.0 mm | — | — |
| February | 41.1 °C | 31.4 °C | 20.0 °C | 34.9 °C | 24.5 °C | 12.8 °C | 26.7 °C | 15.2 °C | 5.5 °C | 9.9 mm | 0.0 mm | — | — |
| March | 46.0 °C | 35.8 °C | 24.8 °C | 36.6 °C | 29.0 °C | 17.9 °C | 29.4 °C | 19.7 °C | 8.0 °C | 17.0 mm | 0.0 mm | — | — |
| April | 45.8 °C | 40.0 °C | 31.0 °C | 40.7 °C | 33.6 °C | 22.7 °C | 33.3 °C | 24.2 °C | 12.6 °C | 7.1 mm | 0.0 mm | — | — |
| May | 47.0 °C | 42.0 °C | 31.1 °C | 41.9 °C | 35.8 °C | 24.7 °C | 35.7 °C | 27.2 °C | 17.8 °C | 24.9 mm | 0.2 mm | — | — |
| June | 49.1 °C | 41.8 °C | 34.0 °C | 42.7 °C | 35.5 °C | 26.4 °C | 34.0 °C | 27.7 °C | 18.6 °C | 25.9 mm | 0.4 mm | — | — |
| July | 48.0 °C | 39.4 °C | 25.5 °C | 40.3 °C | 32.9 °C | 22.8 °C | 32.0 °C | 26.1 °C | 17.8 °C | 68.3 mm | 1.7 mm | — | — |
| August | 44.7 °C | 37.8 °C | 27.4 °C | 39.1 °C | 31.4 °C | 24.1 °C | 30.9 °C | 25.0 °C | 15.2 °C | 51.1 mm | 2.4 mm | — | — |
| September | 47.0 °C | 39.2 °C | 29.7 °C | 39.9 °C | 33.0 °C | 23.6 °C | 32.5 °C | 25.4 °C | 16.0 °C | 27.9 mm | 0.7 mm | — | — |
| October | 42.6 °C | 37.8 °C | 29.5 °C | 38.8 °C | 31.6 °C | 21.8 °C | 32.5 °C | 23.0 °C | 8.6 °C | 10.9 mm | 0.0 mm | — | — |
| November | 40.0 °C | 33.3 °C | 24.0 °C | 34.7 °C | 26.8 °C | 15.6 °C | 27.4 °C | 17.6 °C | 5.5 °C | 9.9 mm | 0.0 mm | — | — |
| December | 39.9 °C | 29.3 °C | 20.0 °C | 31.7 °C | 22.8 °C | 12.3 °C | 23.4 °C | 13.8 °C | 3.4 °C | 20.1 mm | 0.0 mm | — | — |
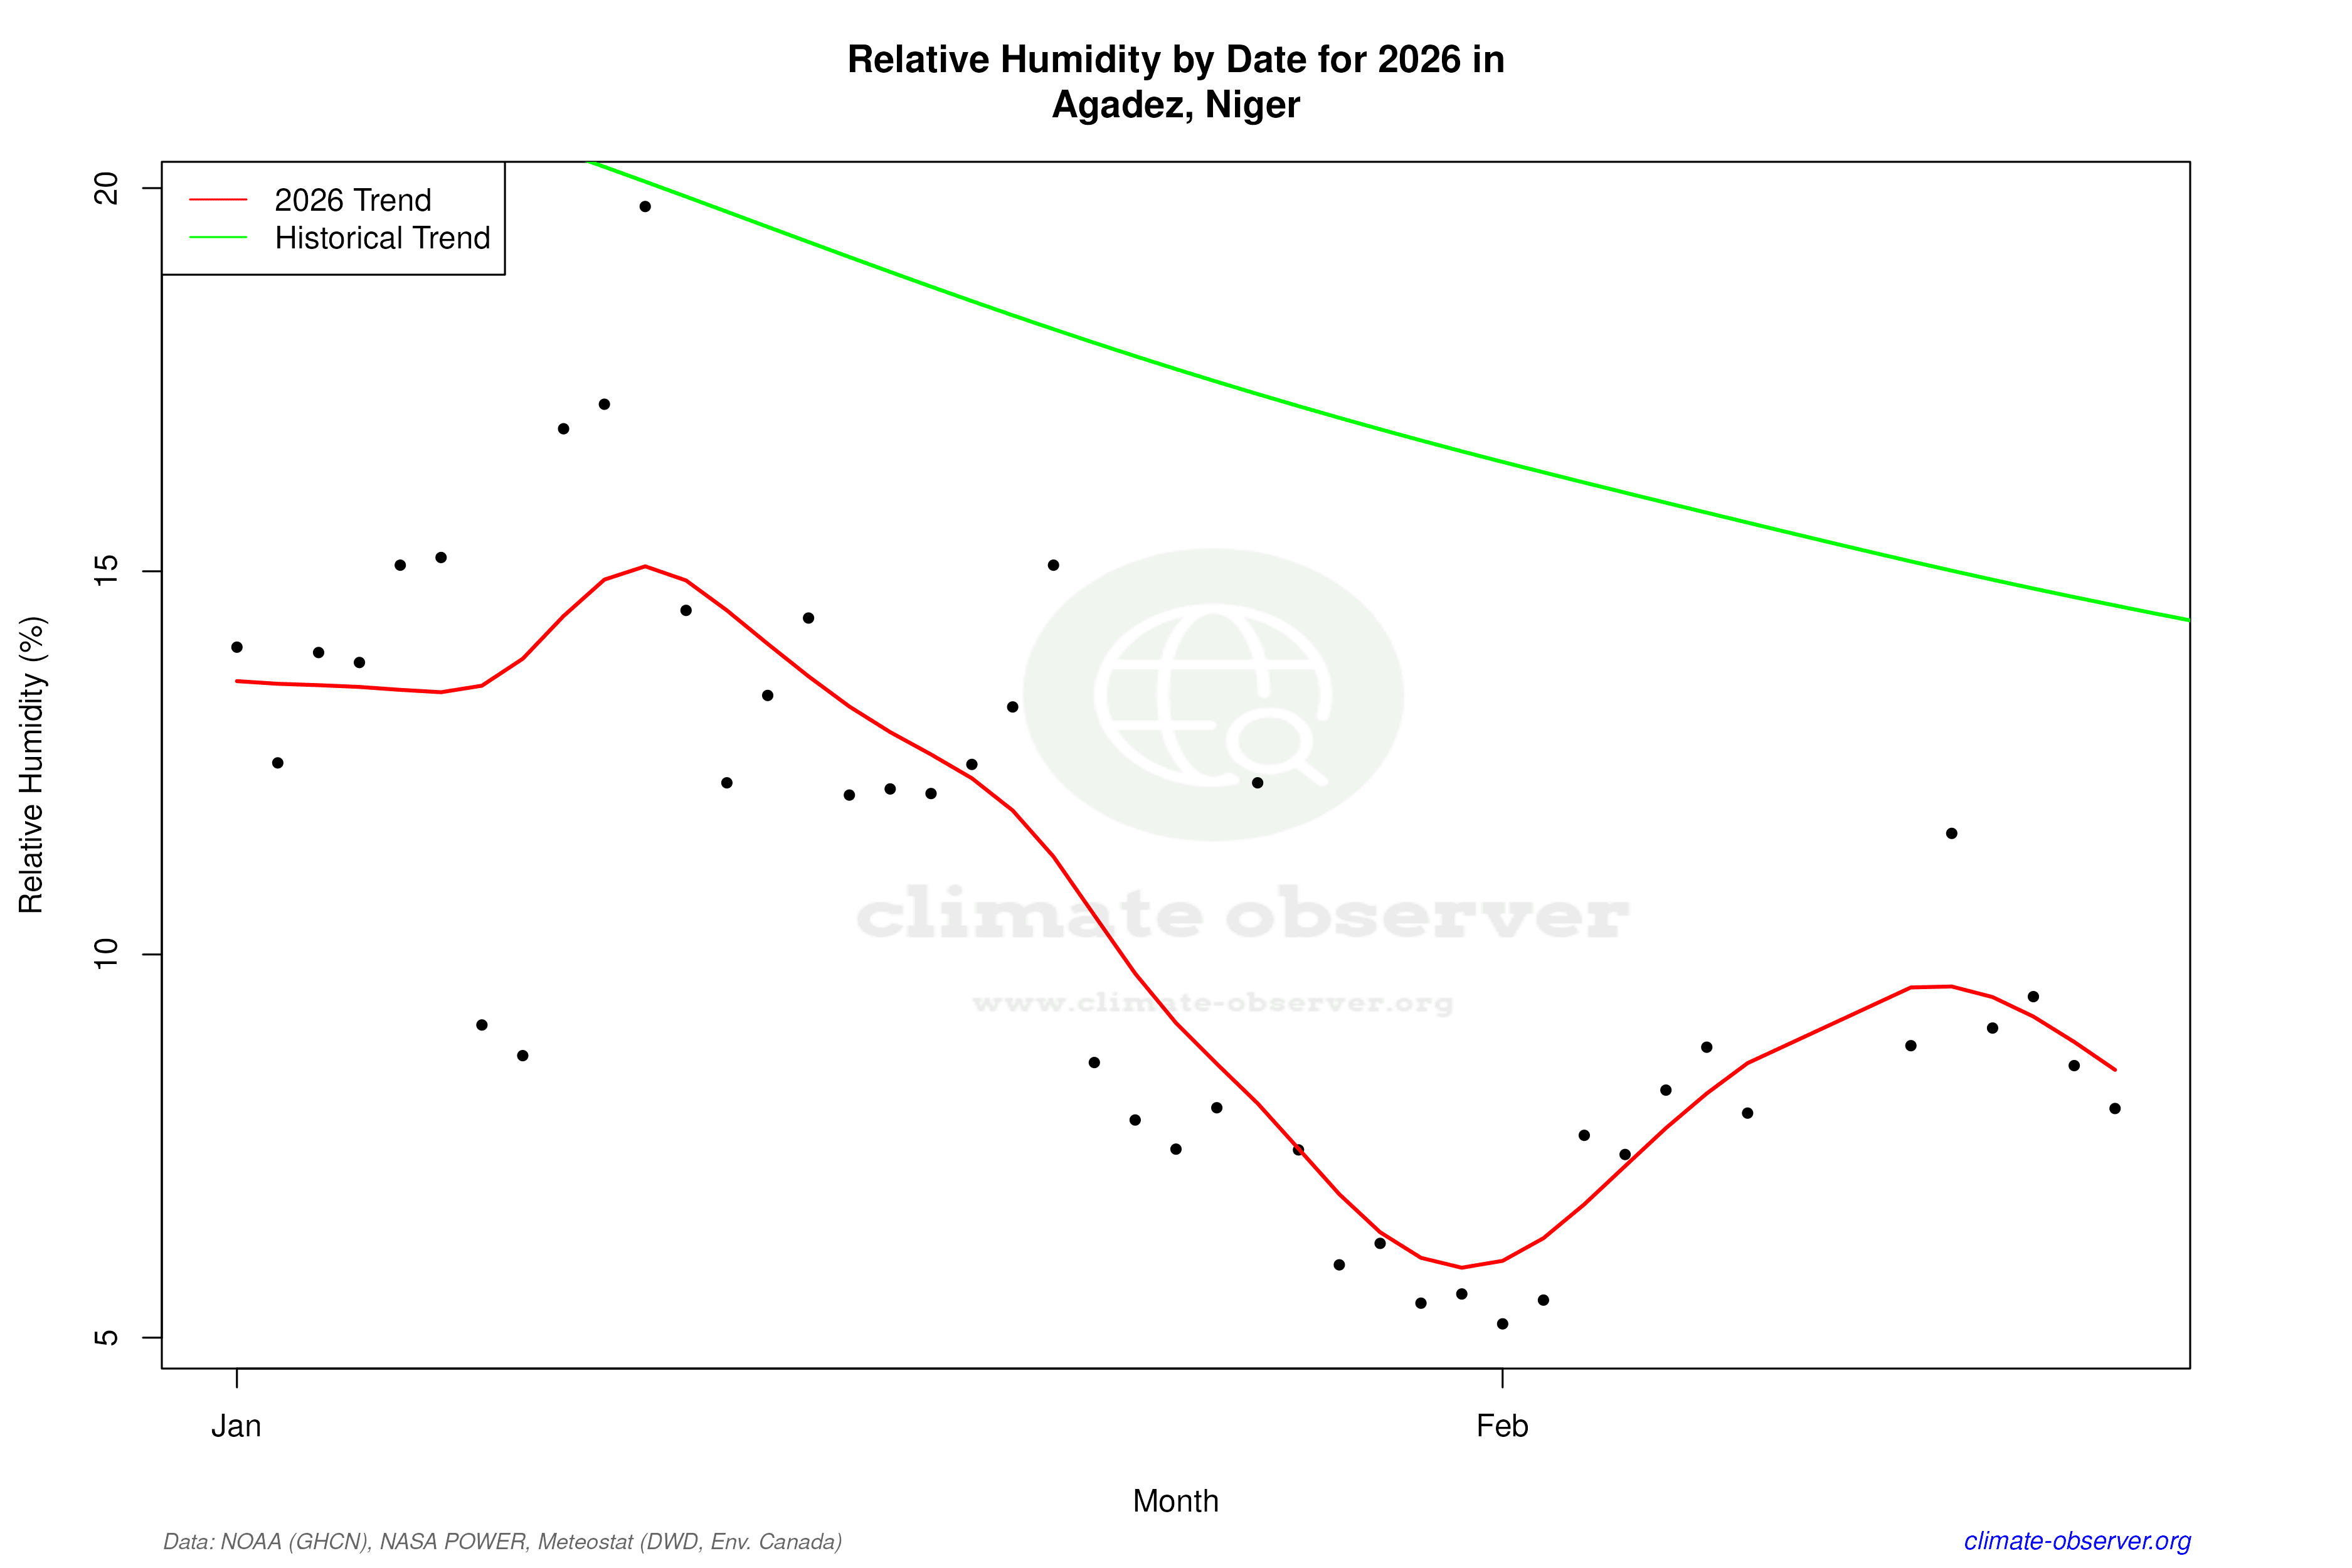
Data Visualisations
Remove WatermarksCurrent Year Climate Trends vs Historical


Max Temperature this Year | 1 of 6
Climate 12-Month Moving Averages


Max Temperature 12-Month MA | 1 of 6
Daily Data Points and Averages Throughout the Year


Average Max Temperature Throughout Year | 1 of 5
