Climate for Station: Eelde, Drenthe, Netherlands
Loading live weather...
Climate Analysis & Overview
The climate at Groningen Airport Eelde in the Netherlands is characterised by a subtle warming trend over the long term, with more pronounced changes in recent years. While the all-time temperature trends show a modest increase, the past decade reveals a sharper rise in both highs and lows. Precipitation has become more evenly distributed, reflecting a slight shift in local weather patterns.
Subtle Long-term Warming
Groningen Airport Eelde, located in the province of Drenthe, experiences a temperate oceanic climate (Cfb) according to the Köppen classification. This climate type is typical of the Netherlands, influenced by the North Sea, which moderates temperatures and brings frequent precipitation. Over the all-time record, the area has seen a 0.18°C (0.32°F) increase in high temperatures and a similar rise of 0.18°C (0.33°F) in low temperatures. These figures indicate a gradual warming trend, consistent with broader regional climate patterns observed across the Netherlands.
Decadal Trends: A Sharper Rise
In contrast to the all-time trends, the past decade has witnessed more pronounced warming. High temperatures have increased by 0.97°C (1.75°F), while low temperatures have risen by 0.29°C (0.52°F). This sharper rise over the last ten years suggests a more dynamic shift in local climate conditions, potentially influenced by recent global warming trends and regional weather patterns. Such changes could have implications for local agriculture, energy consumption, and infrastructure planning.
Precipitation Patterns: More Even Distribution
The Precipitation Concentration Index (PCI) at Groningen Airport Eelde has decreased from a baseline of 11.1 to a current value of 10.1. This marginal decrease indicates that precipitation is now more evenly distributed throughout the year, reducing the likelihood of intense rainfall events concentrated over short periods. This shift towards a more balanced precipitation pattern might mitigate some flood risks and benefit water management strategies in the region.
Temperature Extremes: Record Highs and Lows
The station has recorded an absolute maximum temperature of 36.9°C (98.4°F) and a minimum of -22.9°C (-9.2°F). These extremes highlight the variability inherent in the region's climate, where summer heatwaves and winter cold snaps can both occur. Such variability is typical for the temperate oceanic climate, where maritime influences can lead to significant temperature fluctuations.
Regional Climate Context
The climate profile of Groningen Airport Eelde is set against the backdrop of the Netherlands' commitment to reducing greenhouse gas emissions and adapting to climate change. Recent weather events, such as unusually warm winters or heavy rainfall, underscore the importance of understanding local climate dynamics. As the Netherlands continues to pursue its climate goals, insights from stations like Eelde are crucial for developing effective adaptation strategies.
Station Statistics
10-Year Trend
High: +0.59 °C/decade
Low: +0.25 °C/decade
Rain: +0.01 mm/decade
25-Year Trend
High: +0.49 °C/decade
Low: +0.13 °C/decade
Rain: -0.15 mm/decade
50-Year Trend
High: +0.52 °C/decade
Low: +0.31 °C/decade
Rain: +0.05 mm/decade
All-Time Trend
High: +0.19 °C/decade
Low: +0.19 °C/decade
Rain: +0.03 mm/decade
Percentage Above-Average Days
Last 12 Months: 58.4%
This Year: 58.8%
Precipitation Concentration Index (PCI) ℹ️
Last 12 Months: 10.4
Historical Average: 10.6
Percentile Rank of Last 12 Months ℹ️
High: 93rd percentile
Low: 81st percentile
Rain: 7th percentile
Change in Variance ℹ️
High: -3.7%
Low: -6.8%
Intraday: +25.2%
Data Coverage
79.1%
First Year of Data
1906
Station Location
Historical Weather Records
| Max High | Avg High | Min High | Max Avg | Avg Avg | Min Avg | Max Low | Avg Low | Min Low | Max Precipitation | Avg Precipitation | Max Snow | Avg Snow | |
|---|---|---|---|---|---|---|---|---|---|---|---|---|---|
| Record | 36.9 °C | — | -13.3 °C | 28.4 °C | — | -17.7 °C | 21.9 °C | — | -22.9 °C | 53.4 mm | — | — | — |
| January | 14.5 °C | 4.1 °C | -13.3 °C | 12.5 °C | 2.4 °C | -17.4 °C | 11.0 °C | -1.1 °C | -22.0 °C | 36.1 mm | 2.3 mm | — | — |
| February | 18.9 °C | 5.0 °C | -12.5 °C | 13.4 °C | 2.5 °C | -17.7 °C | 11.6 °C | -1.0 °C | -22.9 °C | 31.2 mm | 1.8 mm | — | — |
| March | 24.0 °C | 8.5 °C | -5.8 °C | 15.2 °C | 5.0 °C | -8.4 °C | 10.9 °C | 0.6 °C | -18.4 °C | 36.3 mm | 1.8 mm | — | — |
| April | 28.8 °C | 12.5 °C | 0.7 °C | 20.3 °C | 8.2 °C | -0.9 °C | 13.1 °C | 2.8 °C | -8.1 °C | 35.2 mm | 1.5 mm | — | — |
| May | 32.8 °C | 17.0 °C | 6.0 °C | 22.6 °C | 12.1 °C | 3.4 °C | 17.7 °C | 6.3 °C | -3.4 °C | 39.2 mm | 1.9 mm | — | — |
| June | 33.8 °C | 19.7 °C | 9.7 °C | 26.4 °C | 15.1 °C | 6.2 °C | 21.9 °C | 9.2 °C | 0.1 °C | 48.4 mm | 2.3 mm | — | — |
| July | 36.9 °C | 21.3 °C | 11.1 °C | 28.4 °C | 16.9 °C | 9.0 °C | 21.5 °C | 11.2 °C | 2.5 °C | 42.9 mm | 2.8 mm | — | — |
| August | 36.3 °C | 21.4 °C | 12.4 °C | 27.0 °C | 16.9 °C | 10.3 °C | 19.7 °C | 11.0 °C | 3.2 °C | 53.4 mm | 2.5 mm | — | — |
| September | 32.6 °C | 18.5 °C | 8.9 °C | 23.6 °C | 14.0 °C | 6.9 °C | 17.7 °C | 8.8 °C | -1.0 °C | 49.6 mm | 2.5 mm | — | — |
| October | 27.4 °C | 13.7 °C | 1.1 °C | 20.4 °C | 10.2 °C | -0.6 °C | 16.4 °C | 5.7 °C | -6.9 °C | 39.3 mm | 2.3 mm | — | — |
| November | 19.4 °C | 8.3 °C | -5.5 °C | 16.1 °C | 6.0 °C | -5.7 °C | 14.0 °C | 2.3 °C | -13.6 °C | 42.1 mm | 2.5 mm | — | — |
| December | 15.4 °C | 5.1 °C | -12.0 °C | 13.1 °C | 3.5 °C | -10.9 °C | 12.0 °C | 0.1 °C | -22.0 °C | 50.8 mm | 2.5 mm | — | — |
Data Visualisations
Remove WatermarksCurrent Year Climate Trends vs Historical


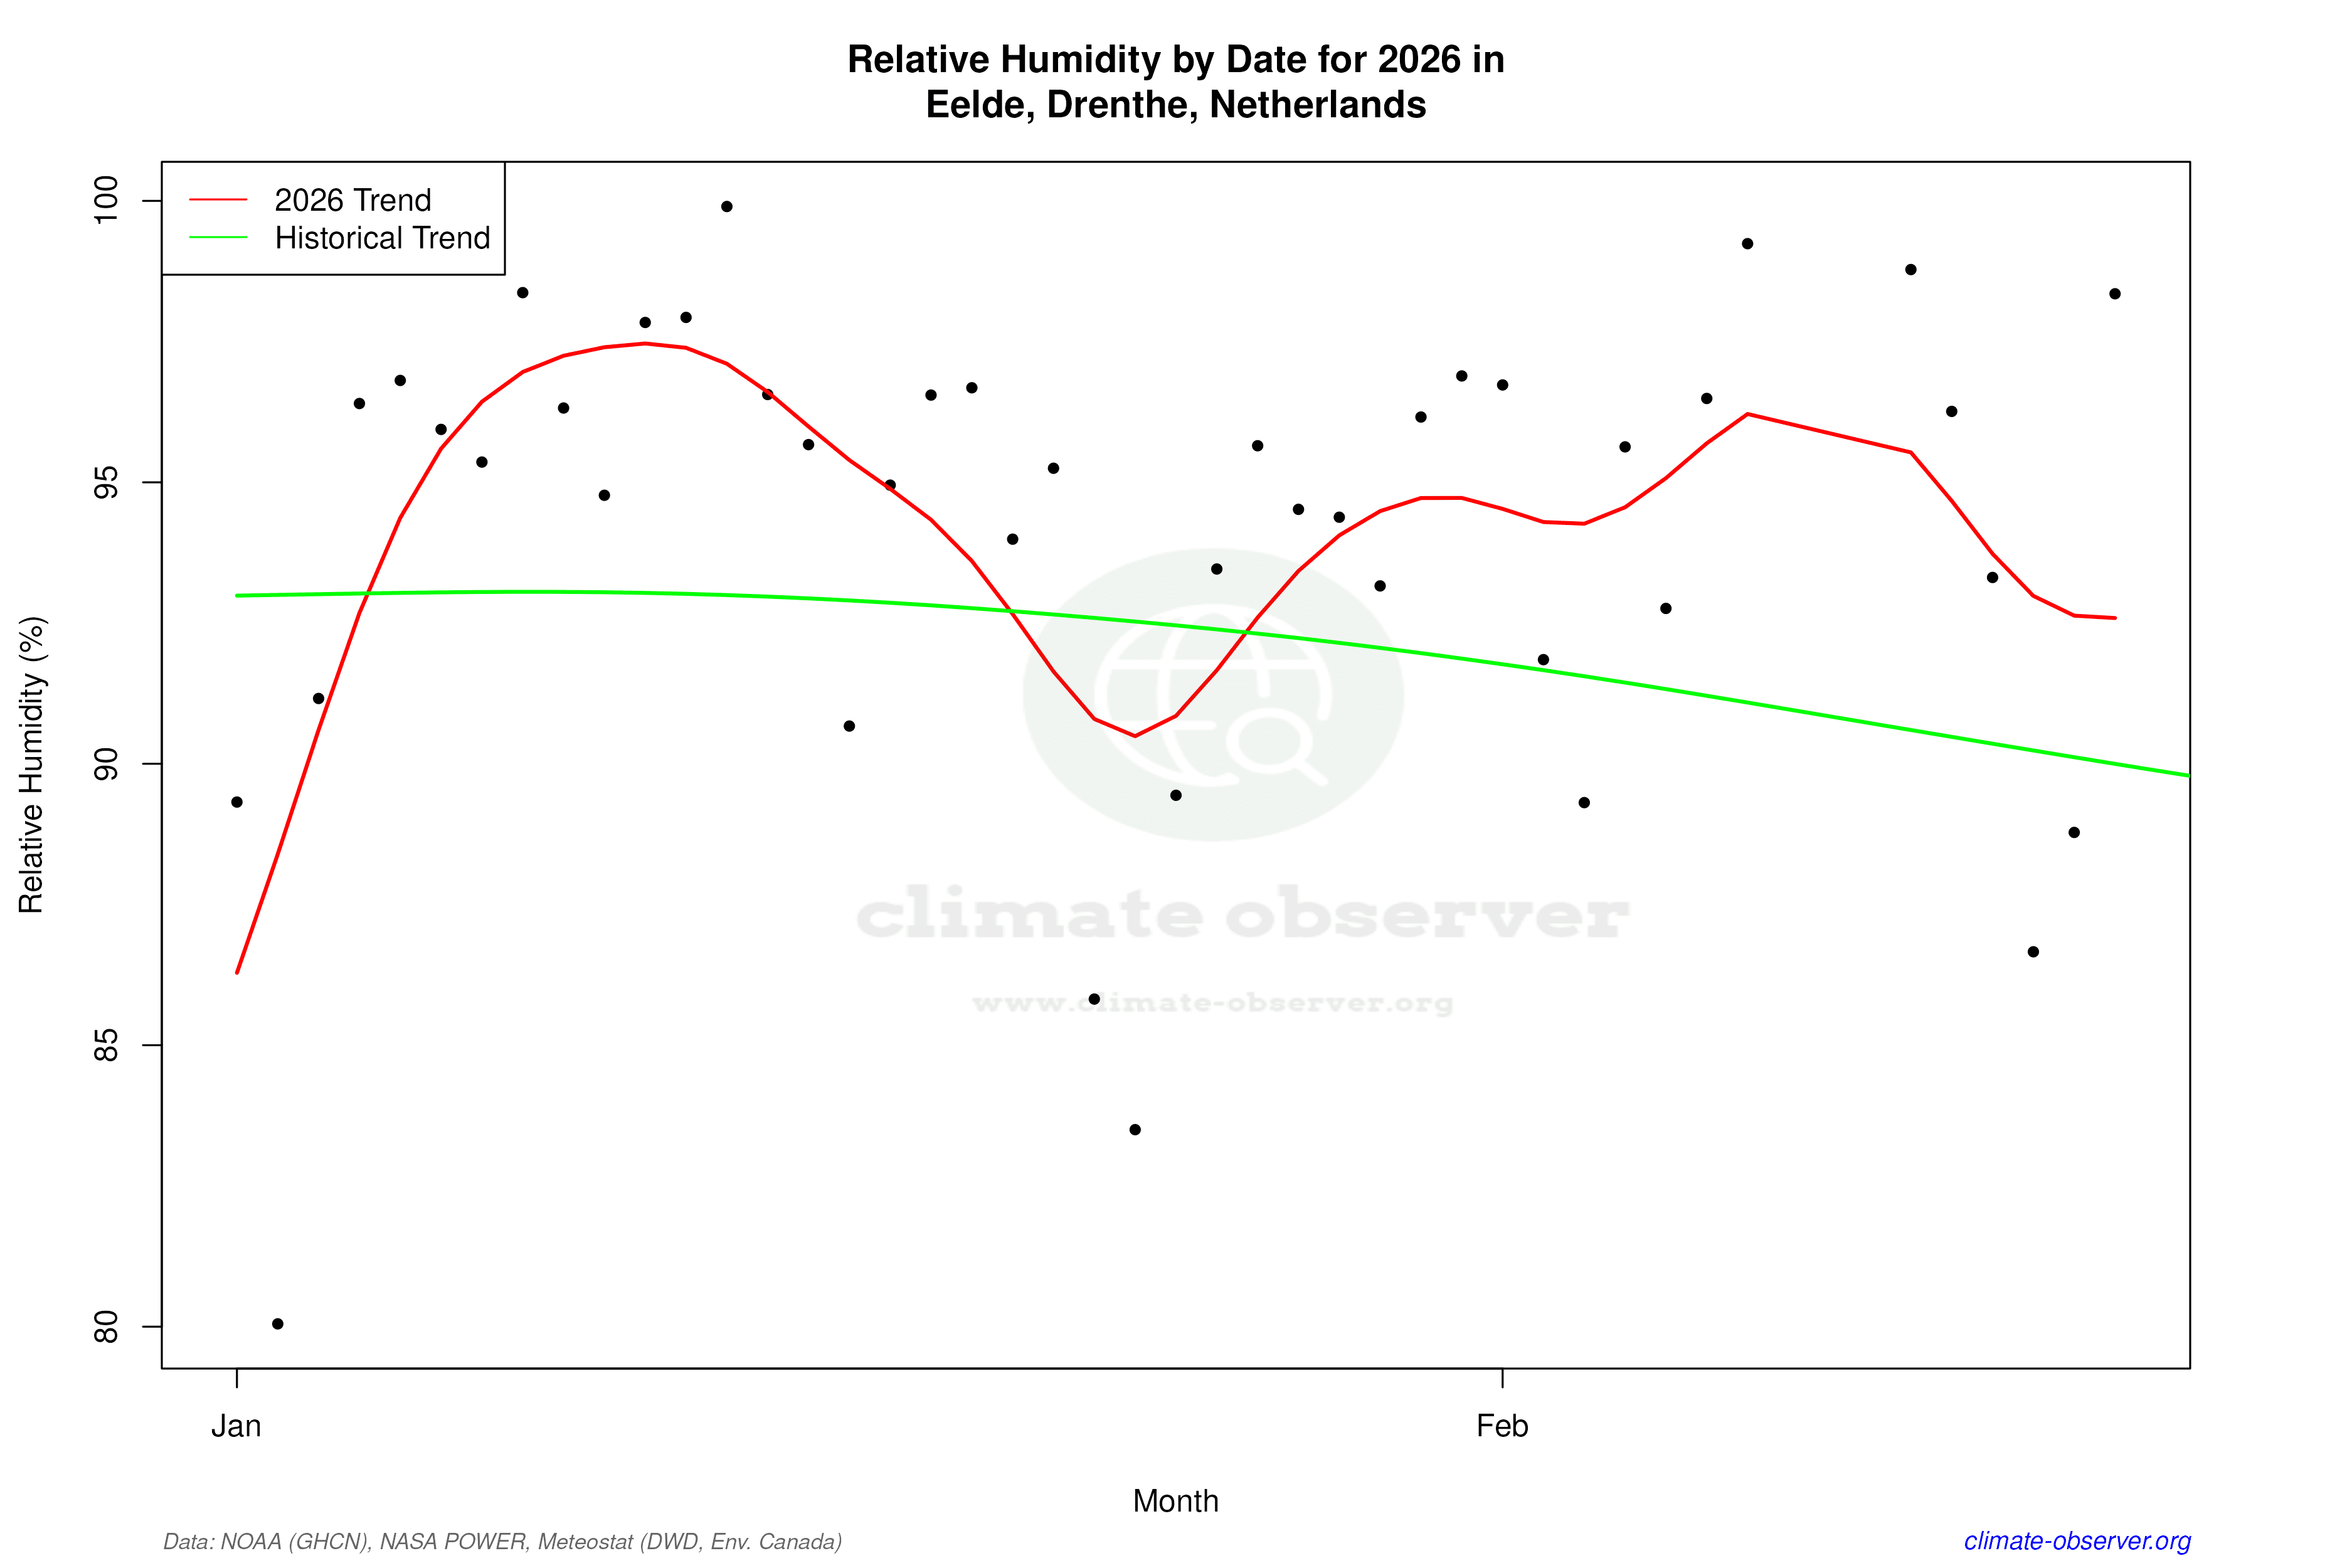

Max Temperature this Year | 1 of 6
Climate 12-Month Moving Averages


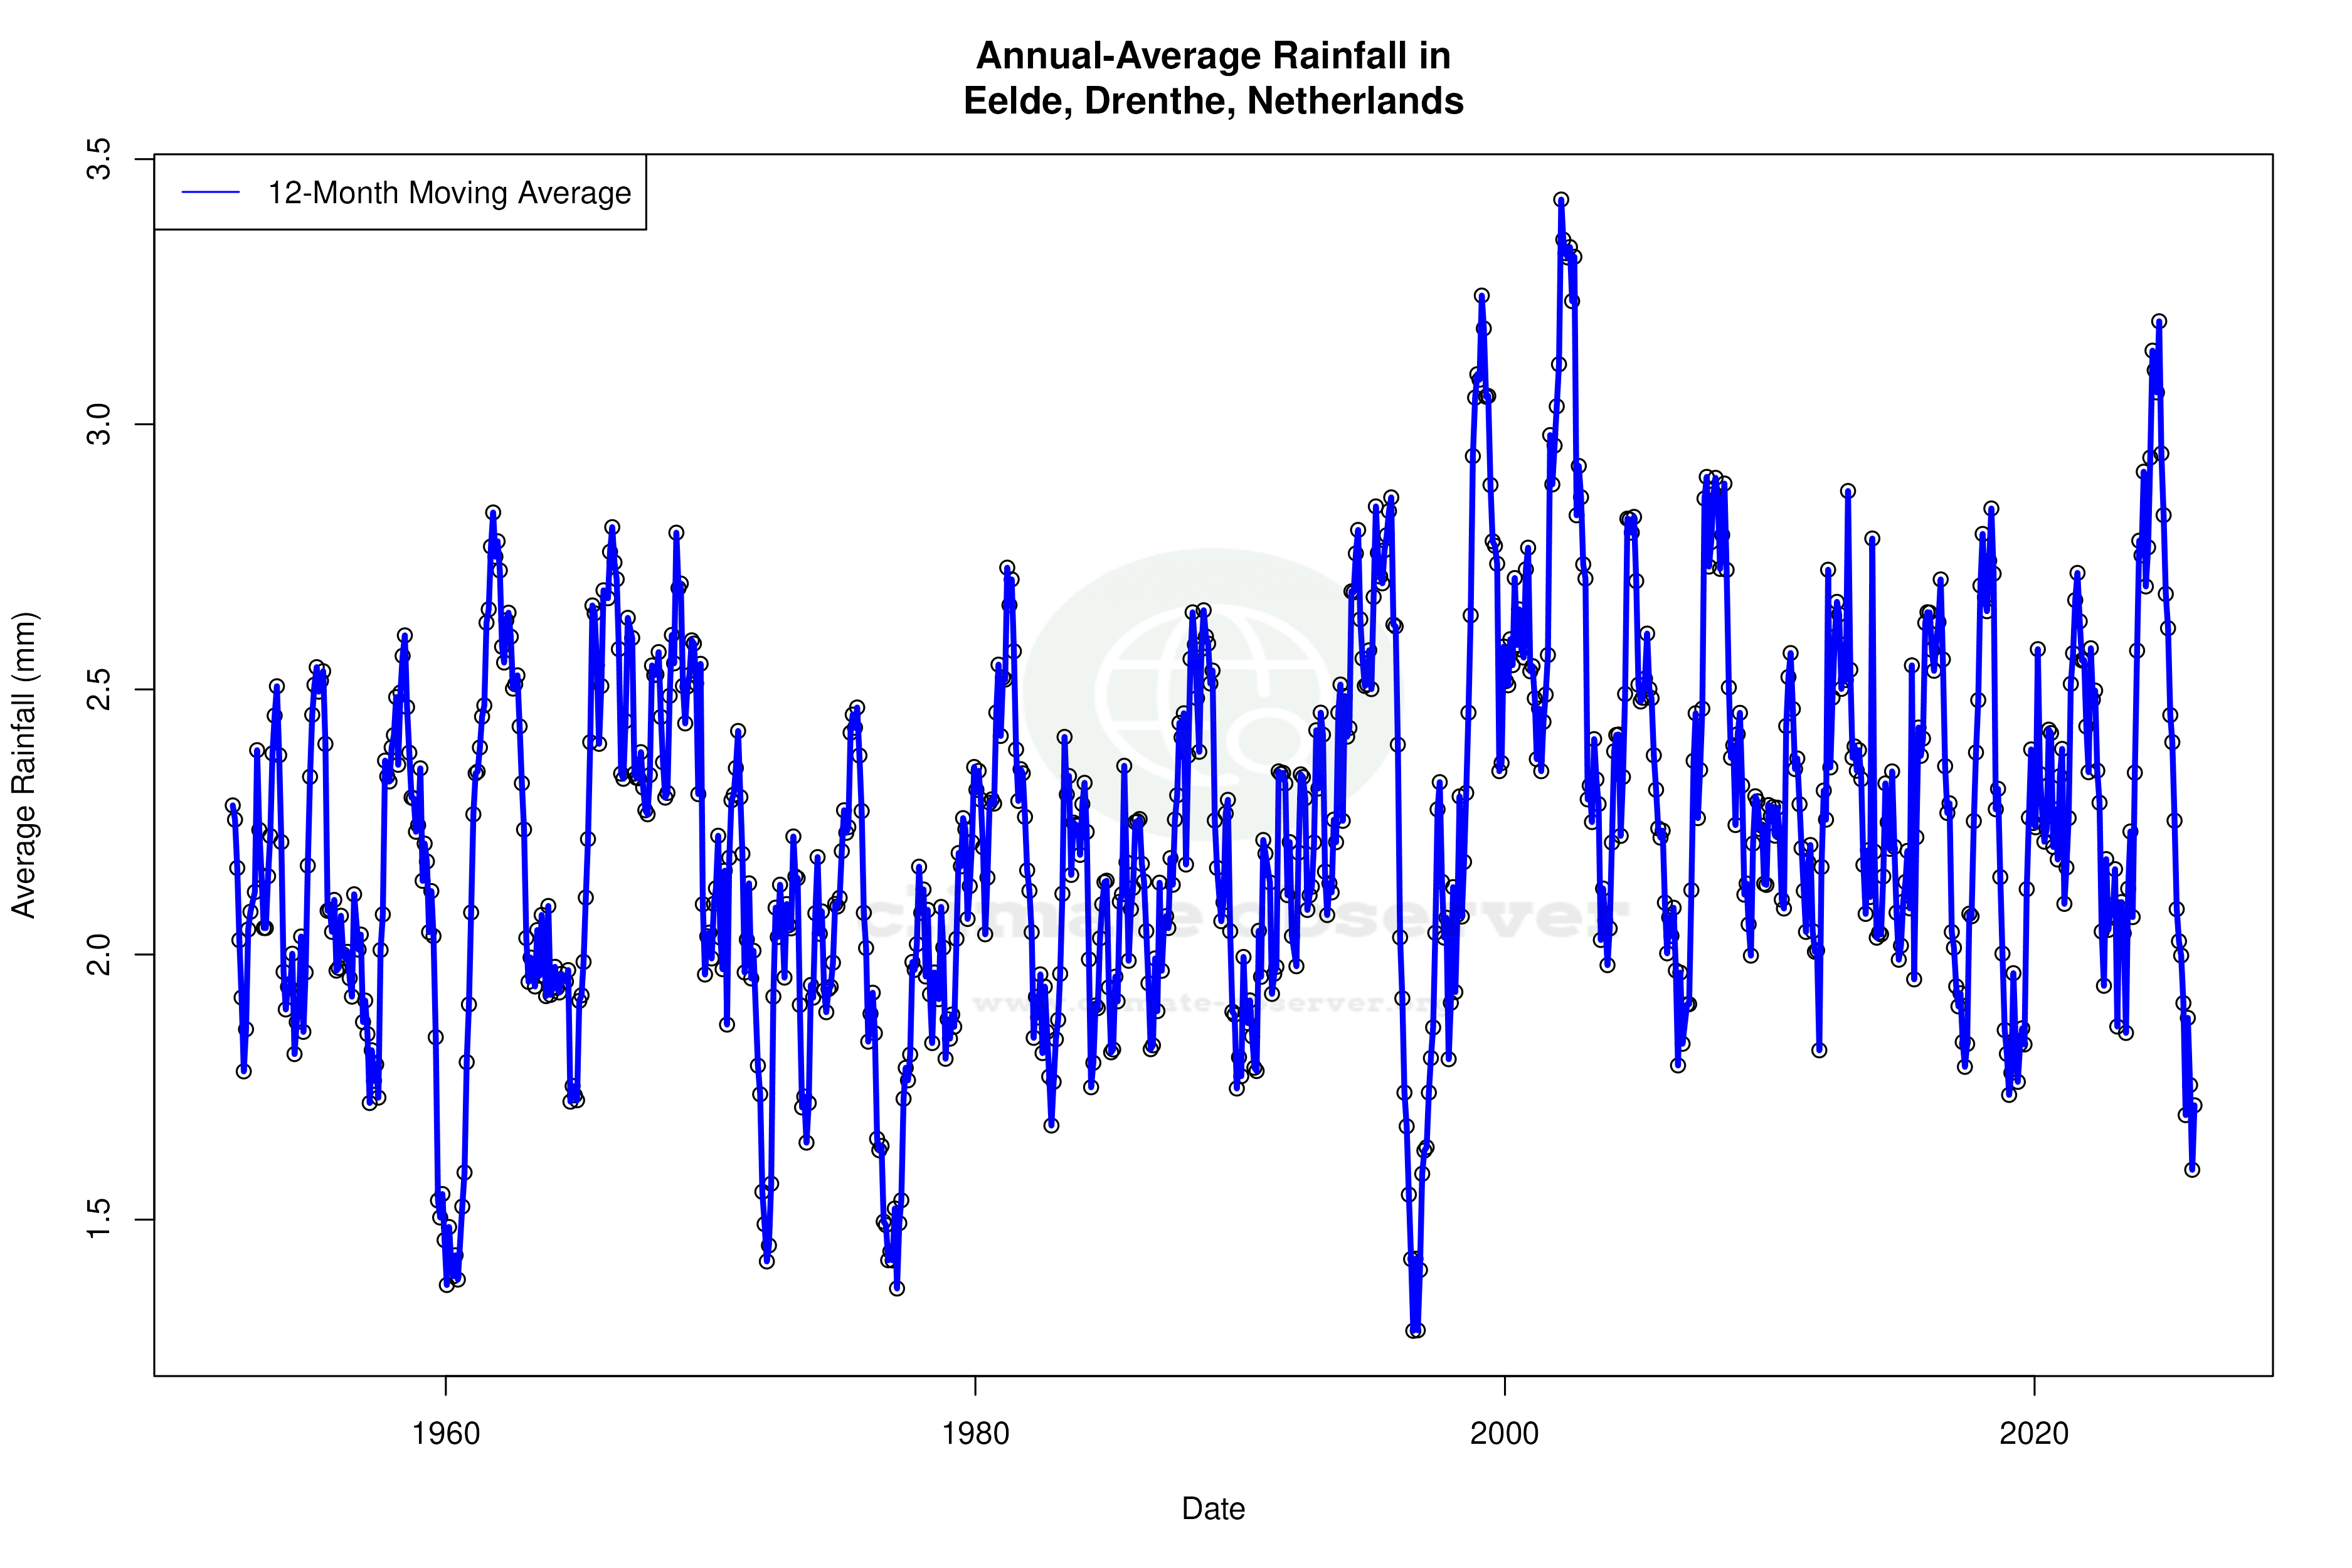


Max Temperature 12-Month MA | 1 of 6
Daily Data Points and Averages Throughout the Year

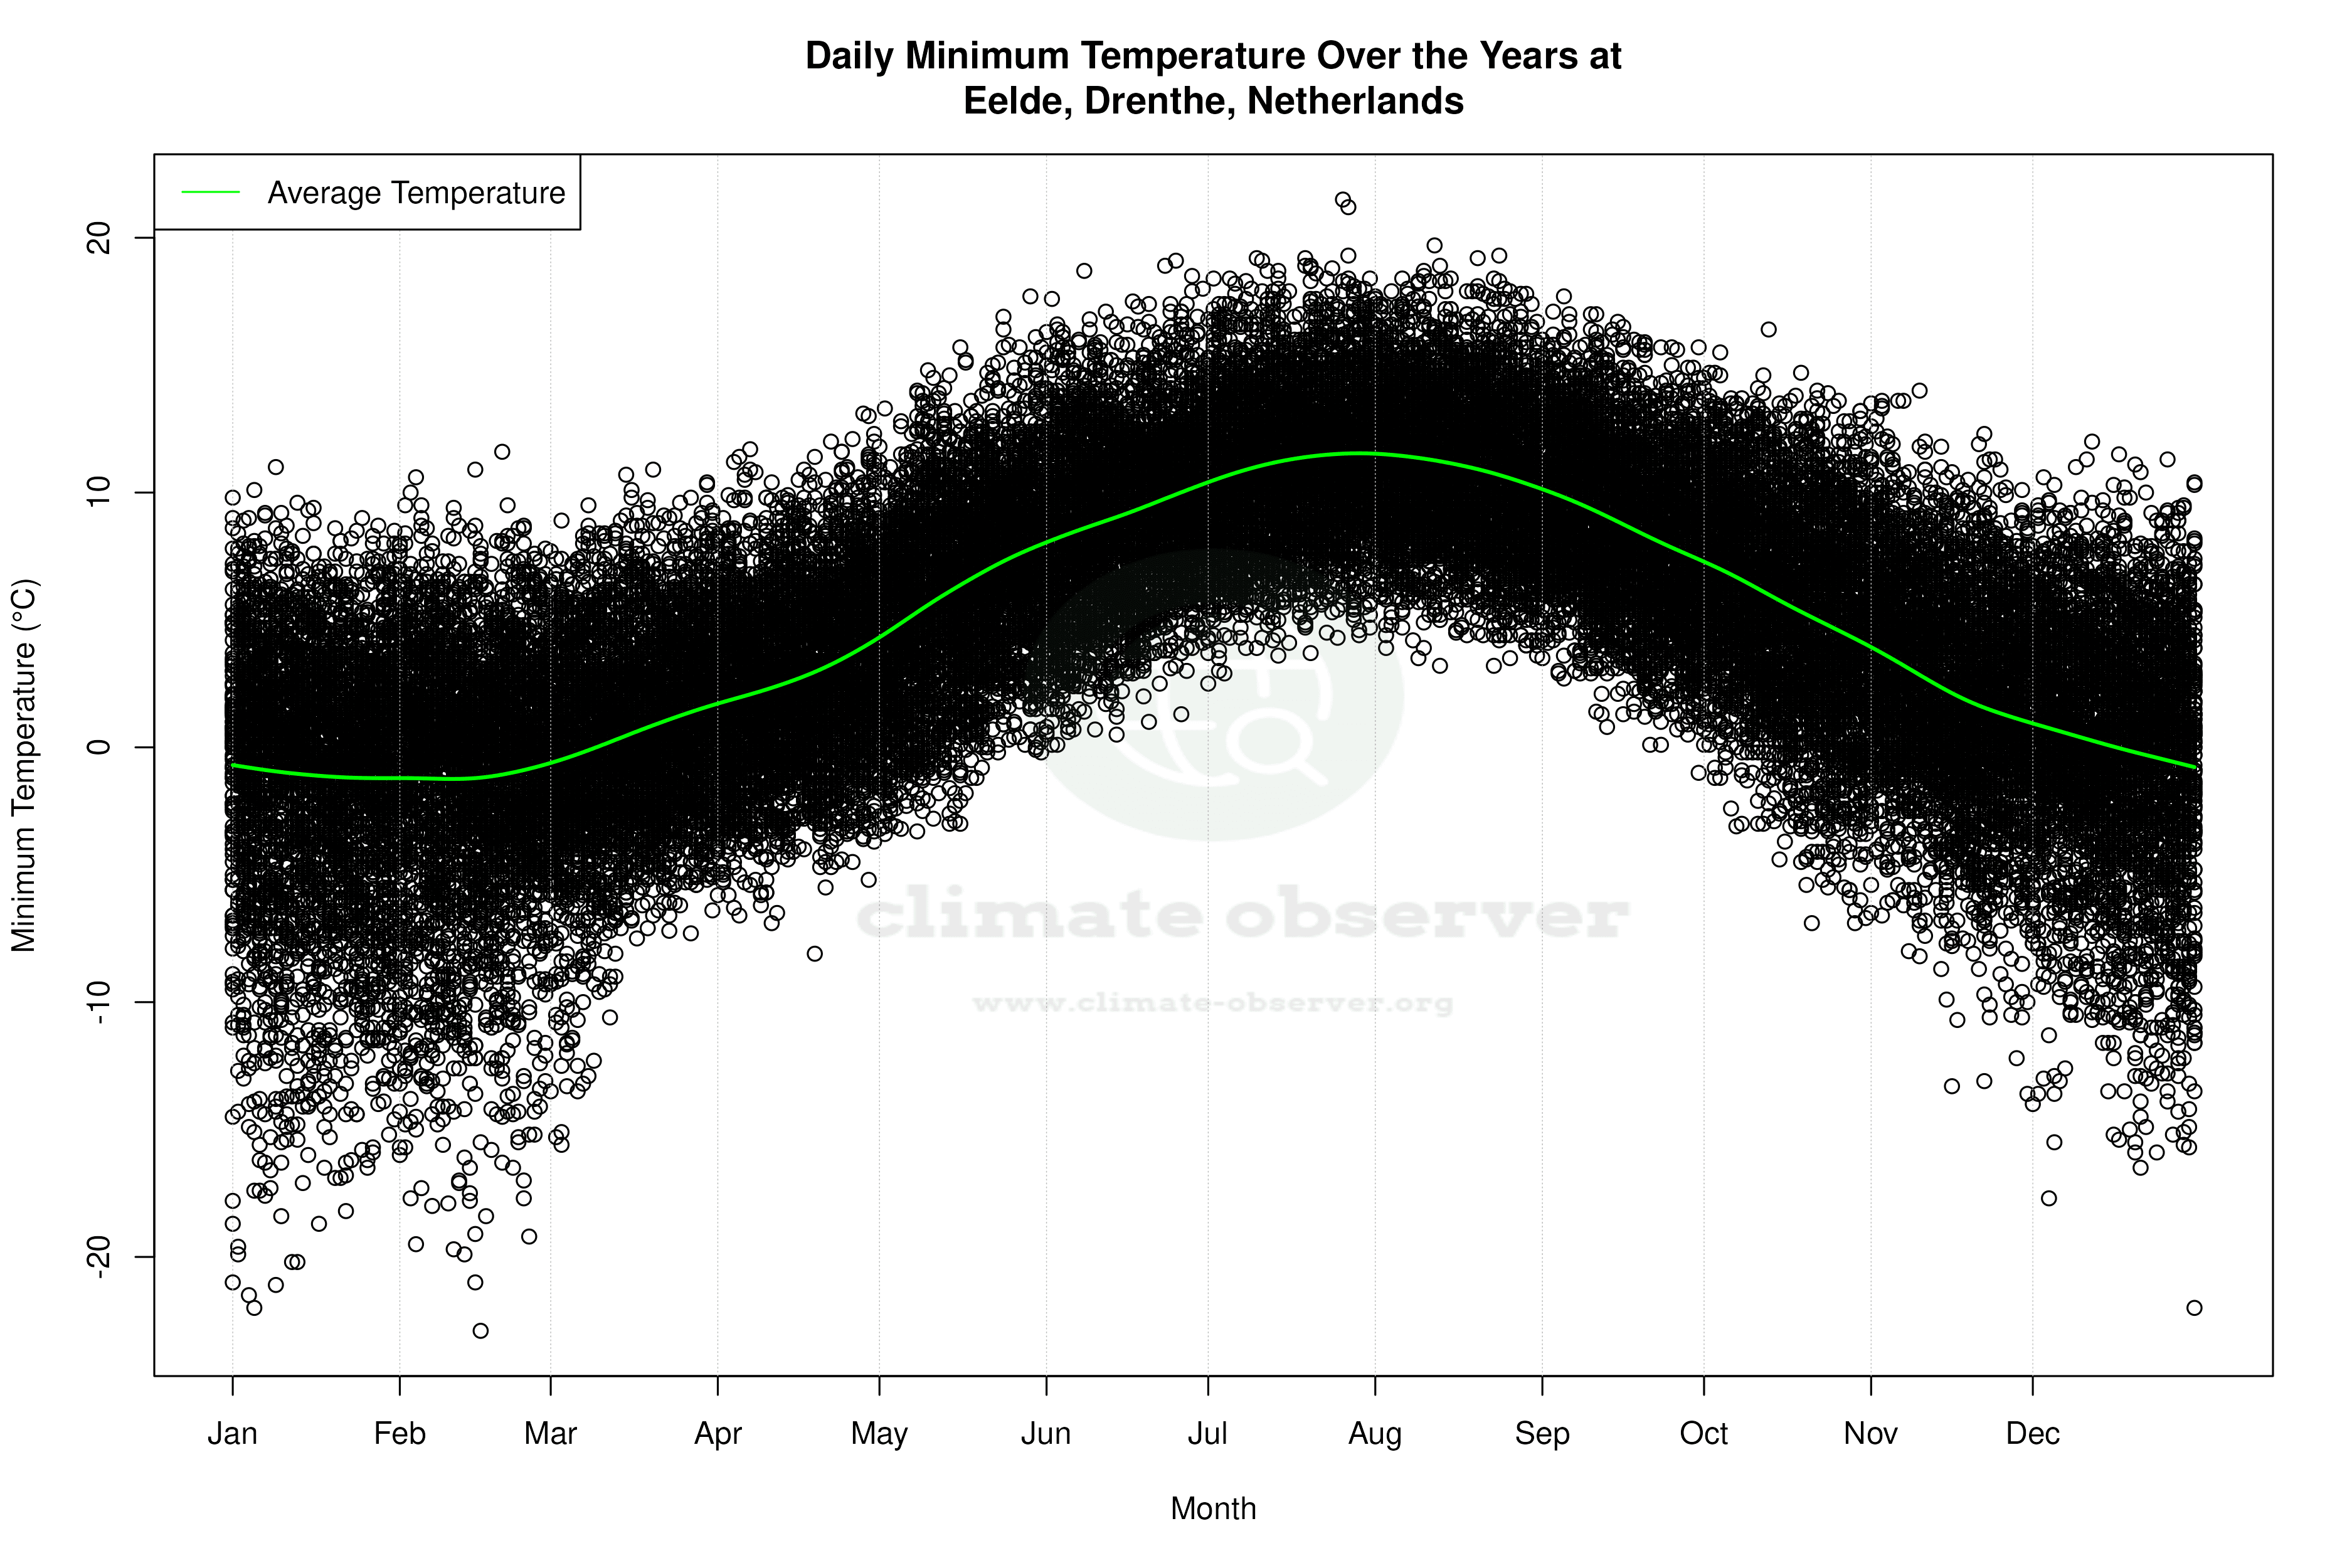

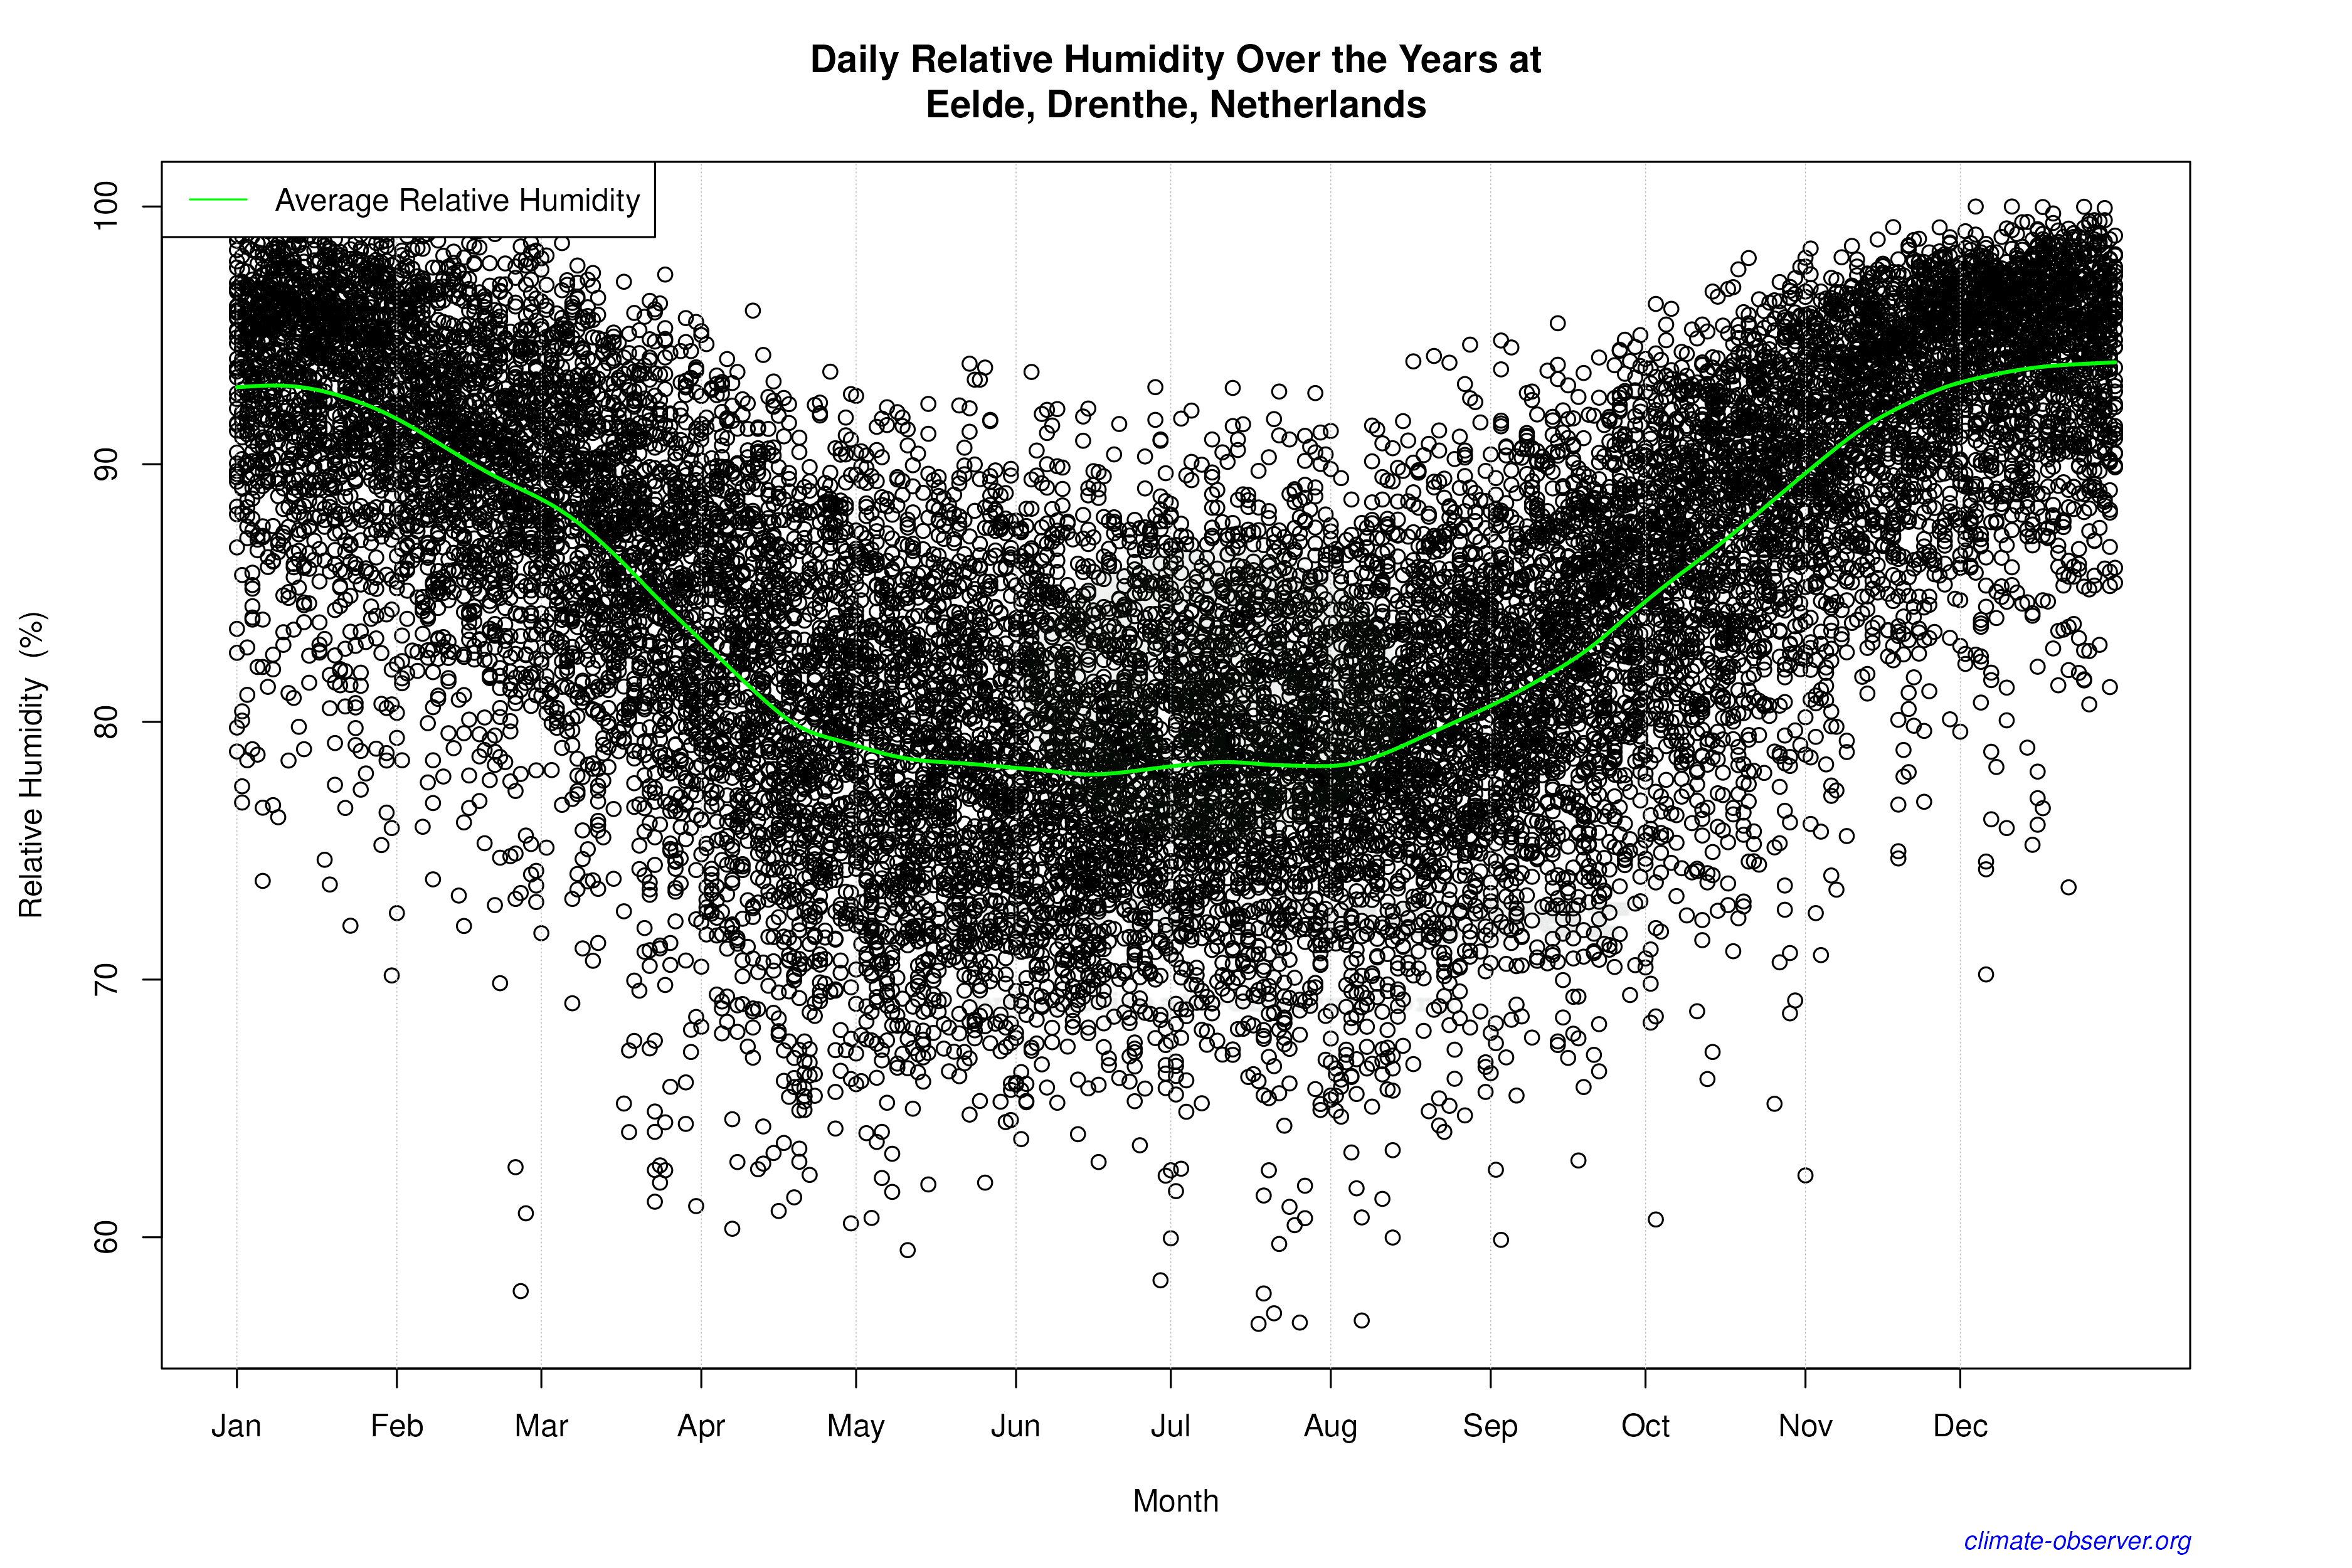

Average Max Temperature Throughout Year | 1 of 5
