Climate for Station: Vaernes, Trøndelag, Norway
Loading live weather...
Climate Analysis & Overview
Vaernes, located in Trøndelag, Norway, is experiencing a warming trend, with a notable rise in high temperatures over the past decade. The region's climate is becoming more temperate, with precipitation events becoming more evenly distributed. These changes align with Norway's climate goals of reducing climate variability and adapting to warmer conditions.
Warming Trends in Vaernes
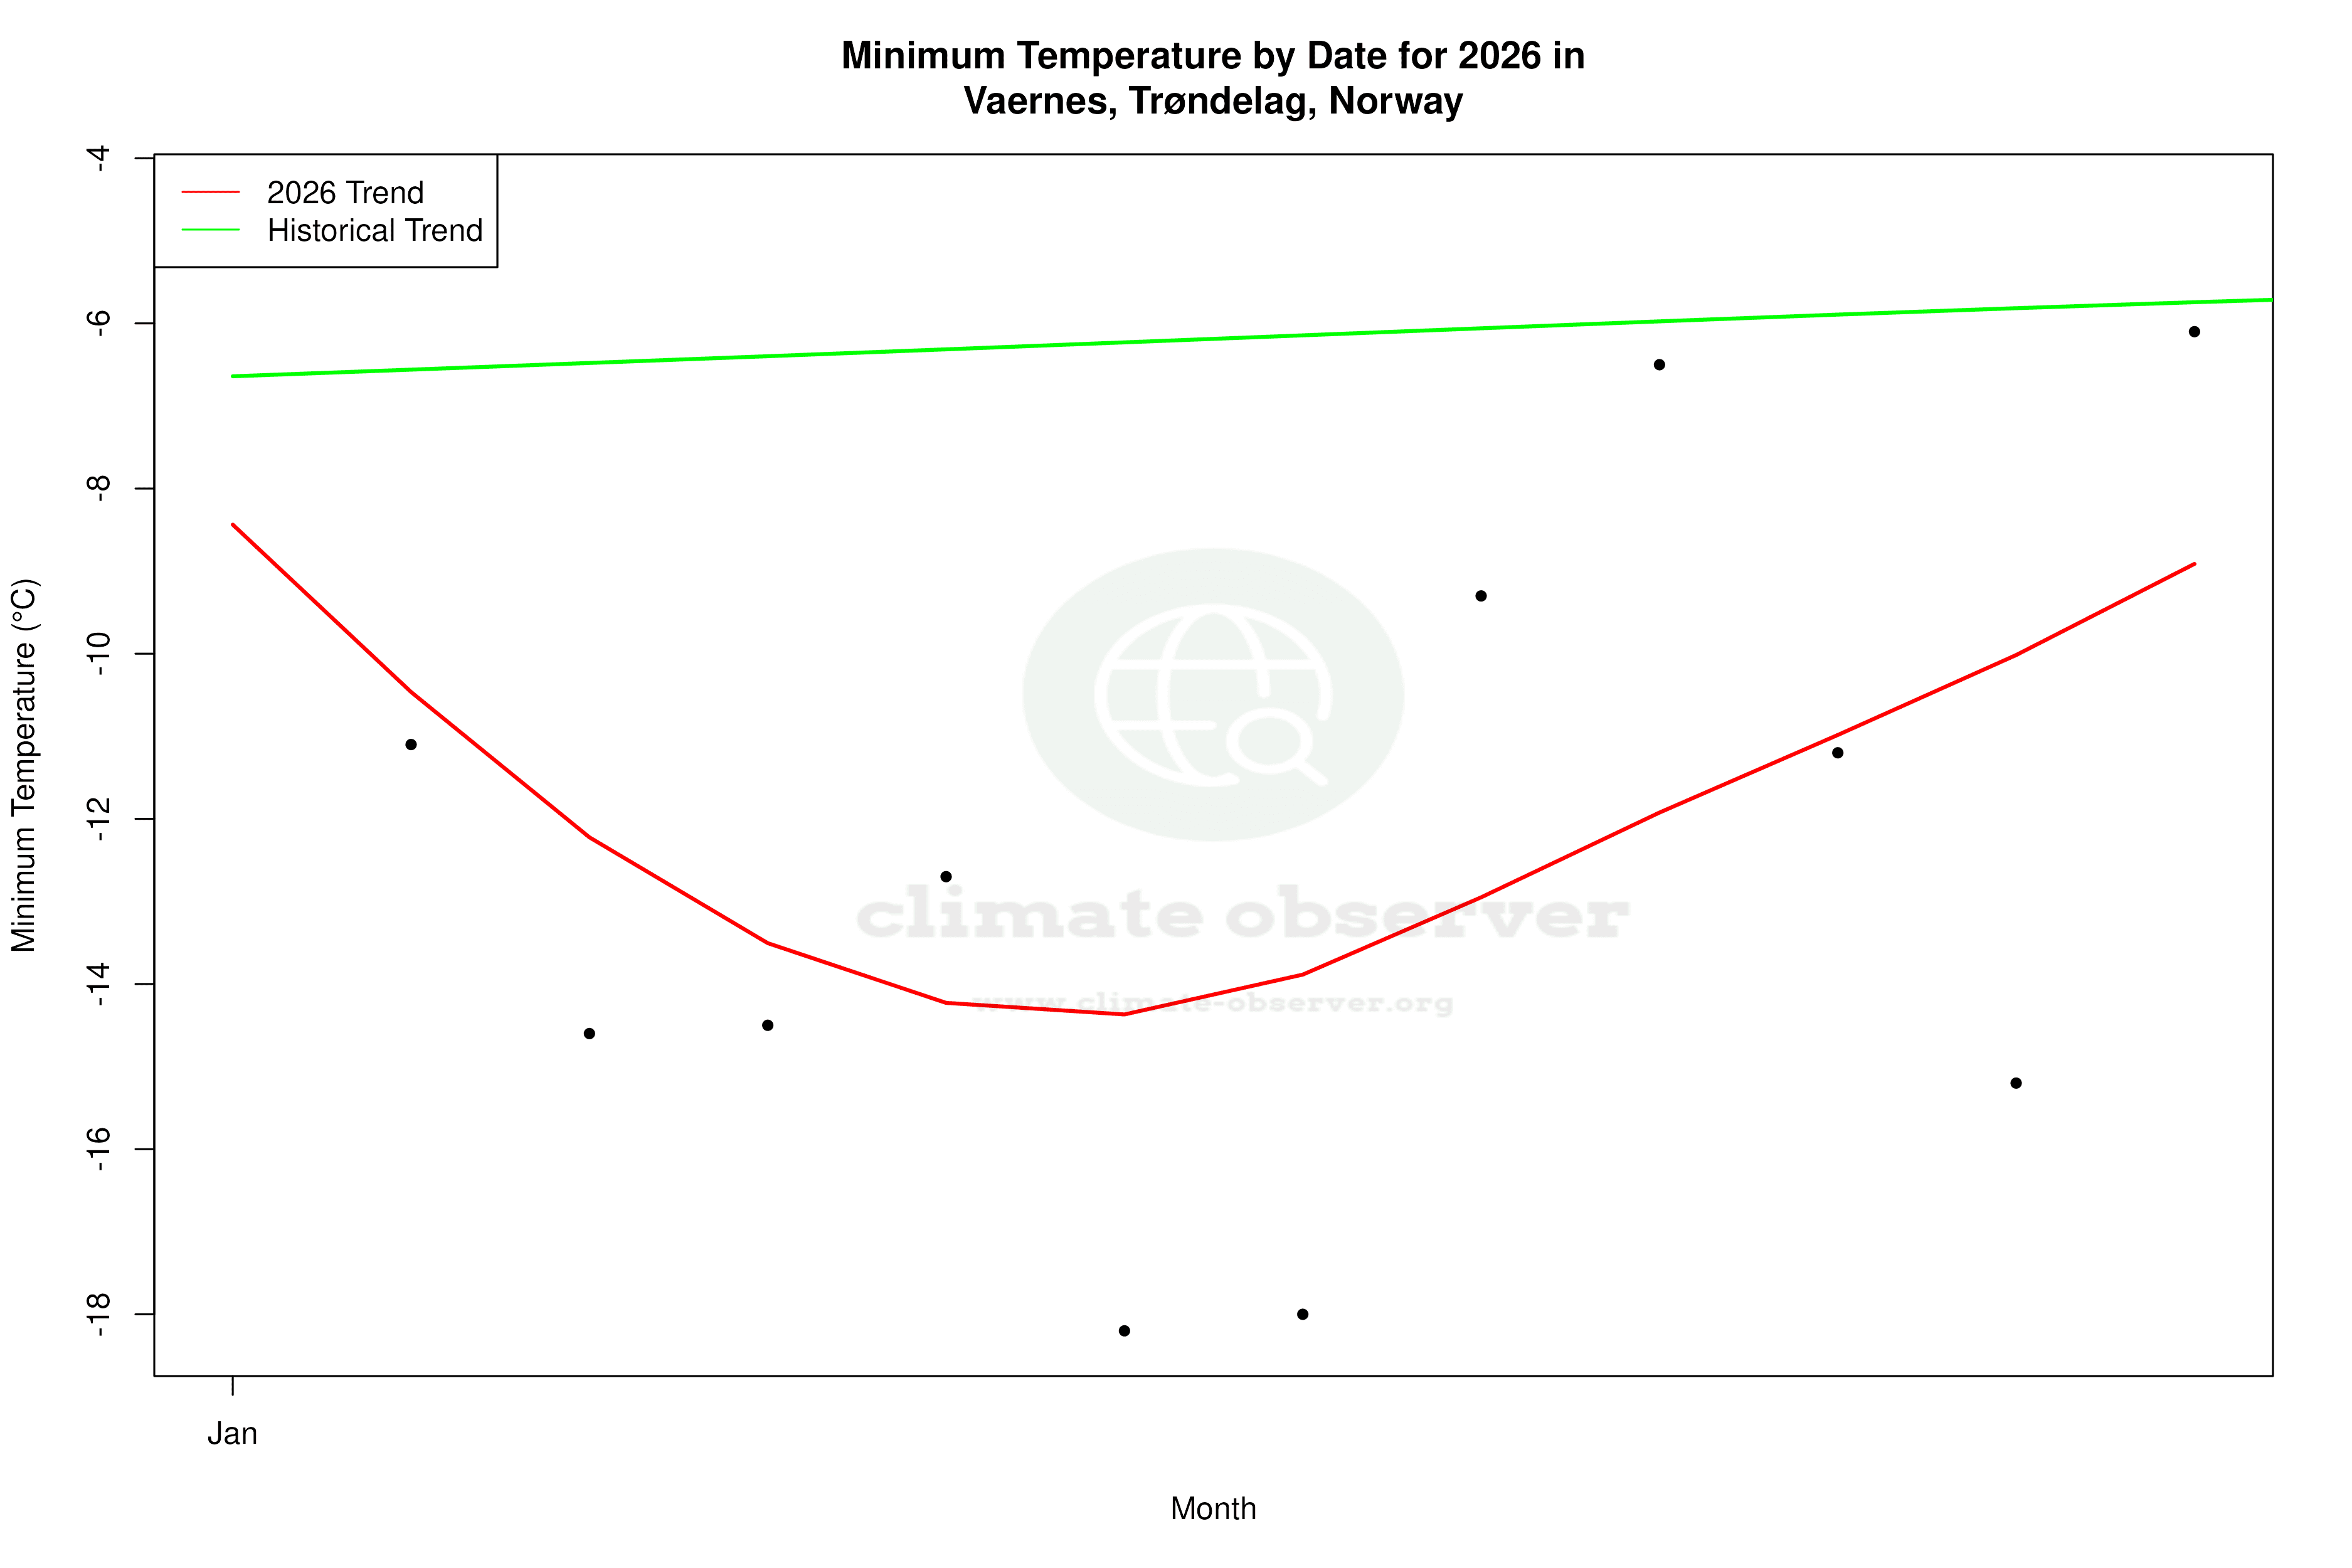
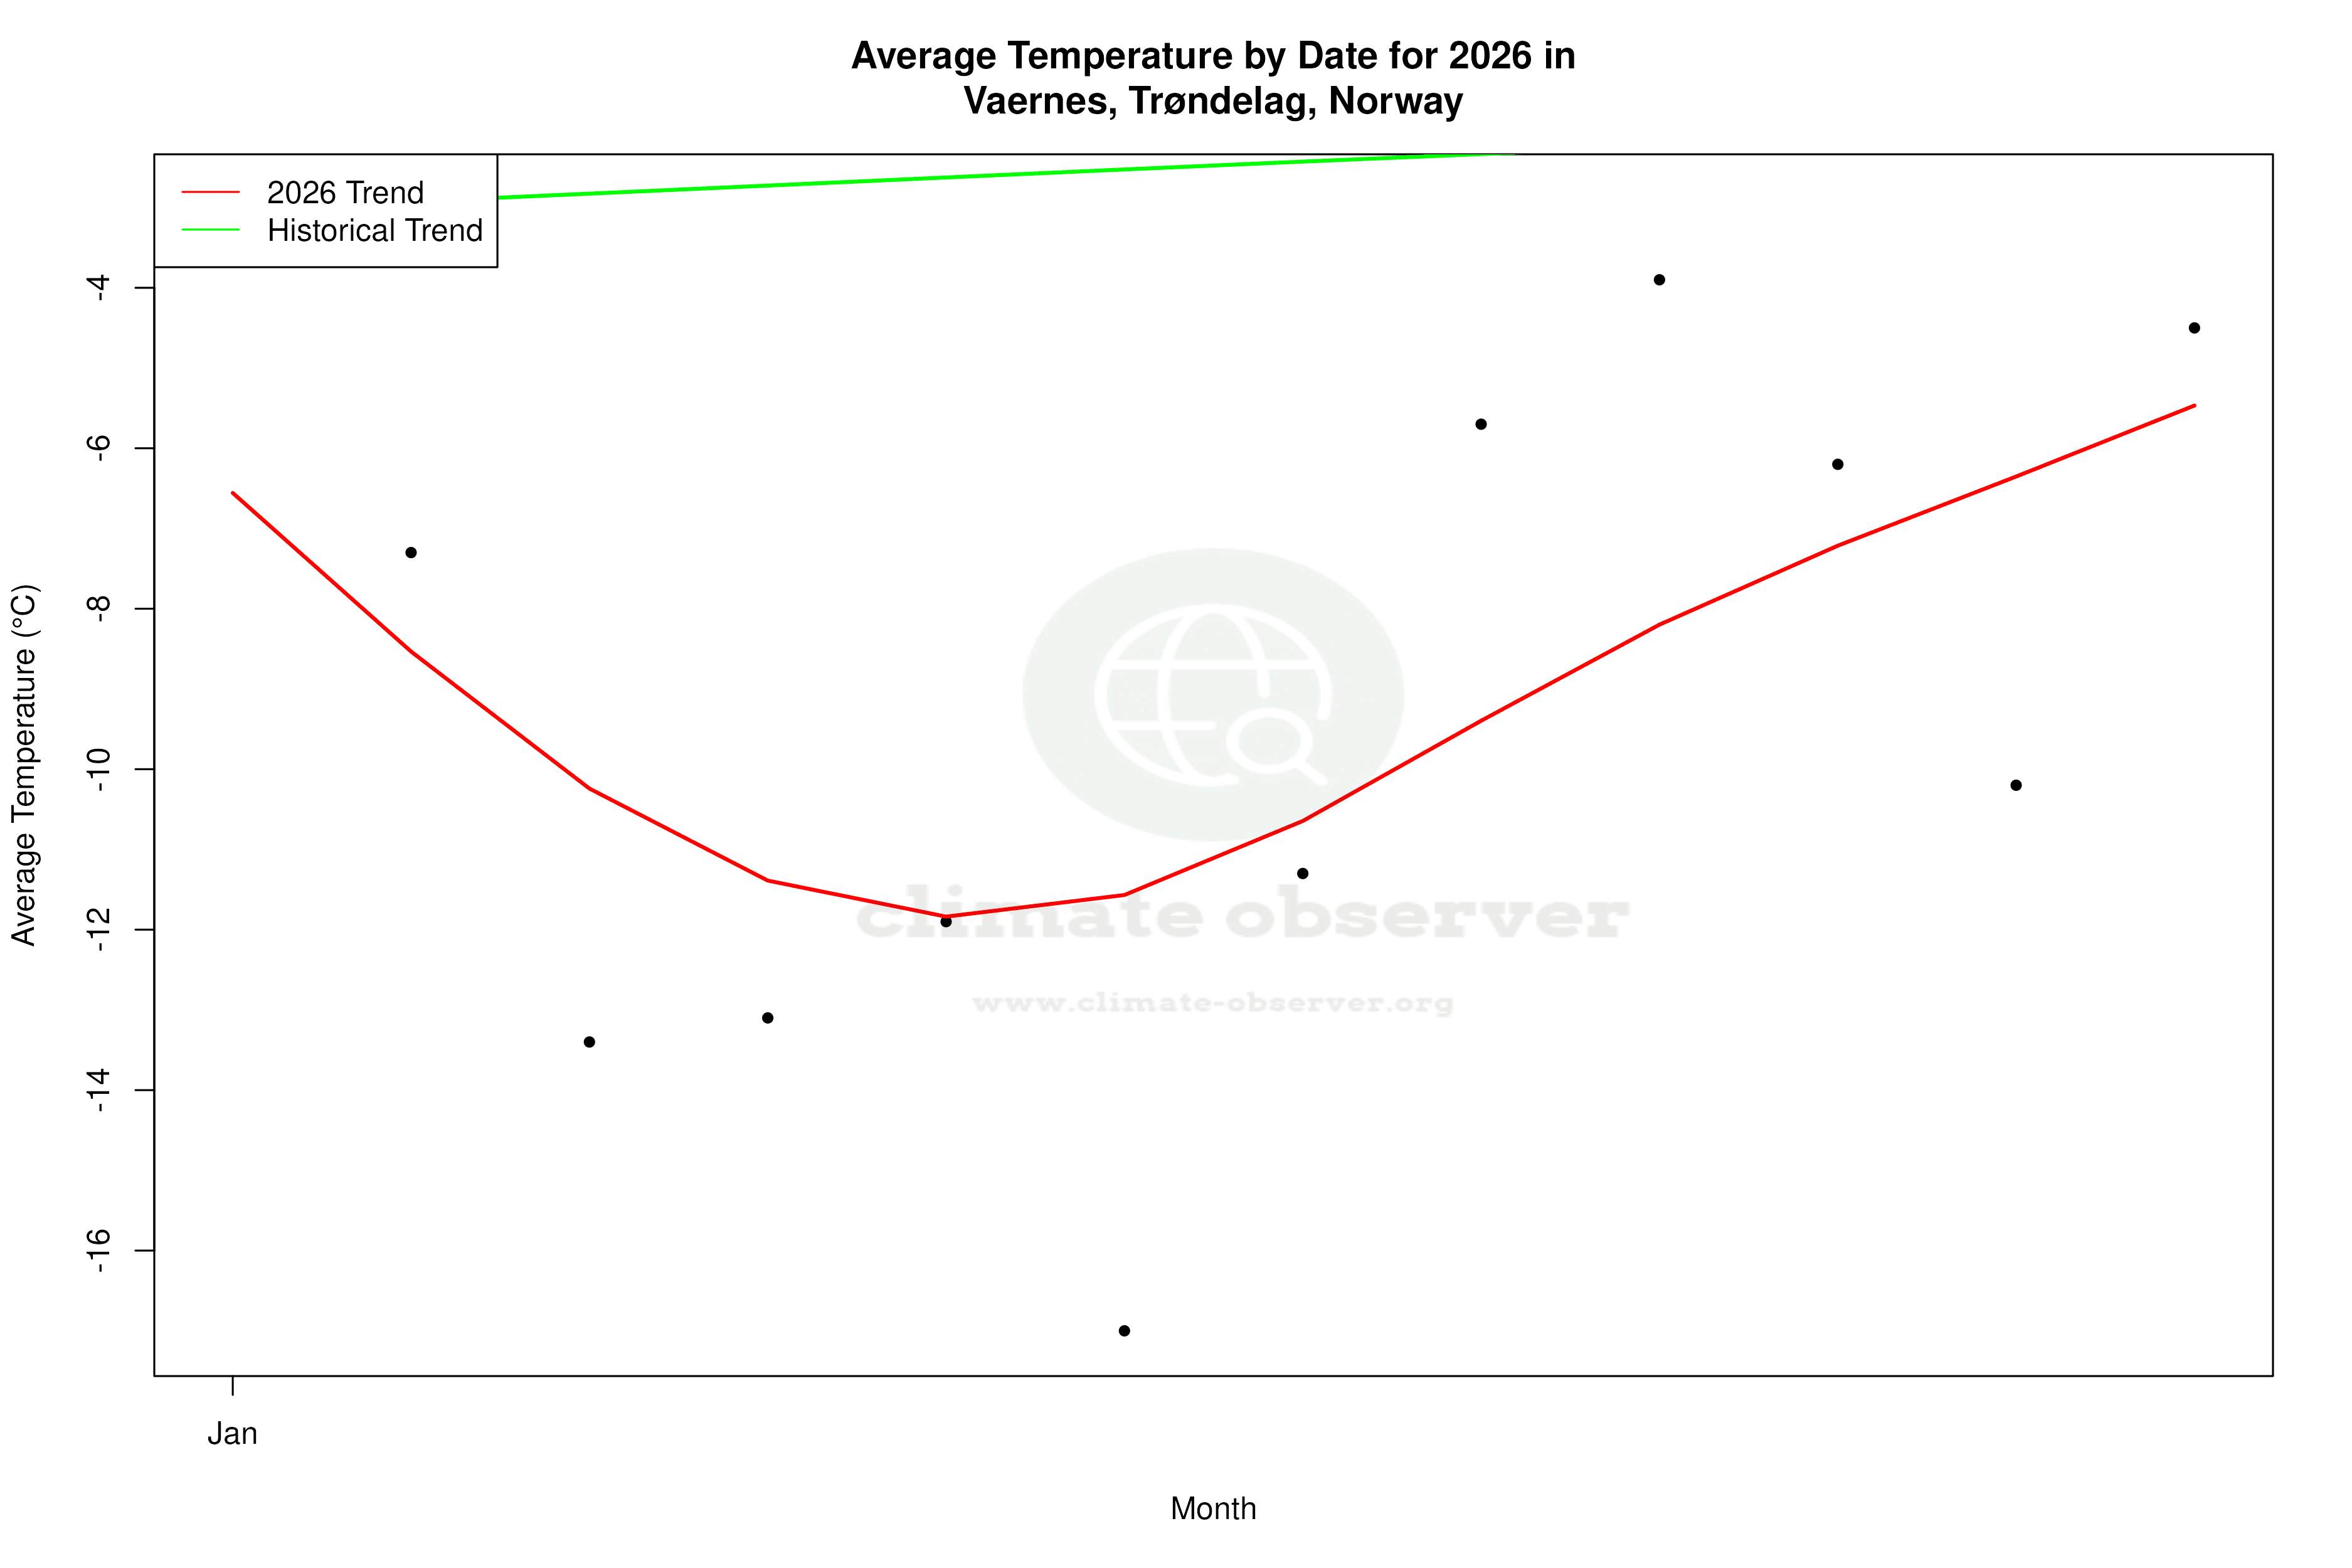
Vaernes, situated in the Trøndelag region of Norway, is classified under the Köppen climate classification as Dfb, indicating a humid continental climate with warm summers and no dry season. Over the past decade, the region has seen a significant warming trend, with high temperatures increasing by 1.08°C (1.94°F). This is a more pronounced change compared to the all-time warming trend of 0.23°C (0.41°F) for highs. The low temperatures have also increased, albeit more modestly, by 0.23°C (0.41°F) over the last ten years and 0.25°C (0.45°F) historically. This warming trend is consistent with broader regional climate goals in Norway, which aim to mitigate the impacts of climate change.
Temperature Extremes and Records
The absolute temperature records in Vaernes highlight the potential extremities of its climate. The highest recorded temperature is 34.5°C (94.1°F), while the lowest is -25.6°C (-14.1°F). These records underscore the variability inherent in a continental climate, influenced by the region's proximity to the Norwegian Sea and the surrounding mountainous terrain, which can lead to rapid weather changes.
Precipitation Patterns and Distribution
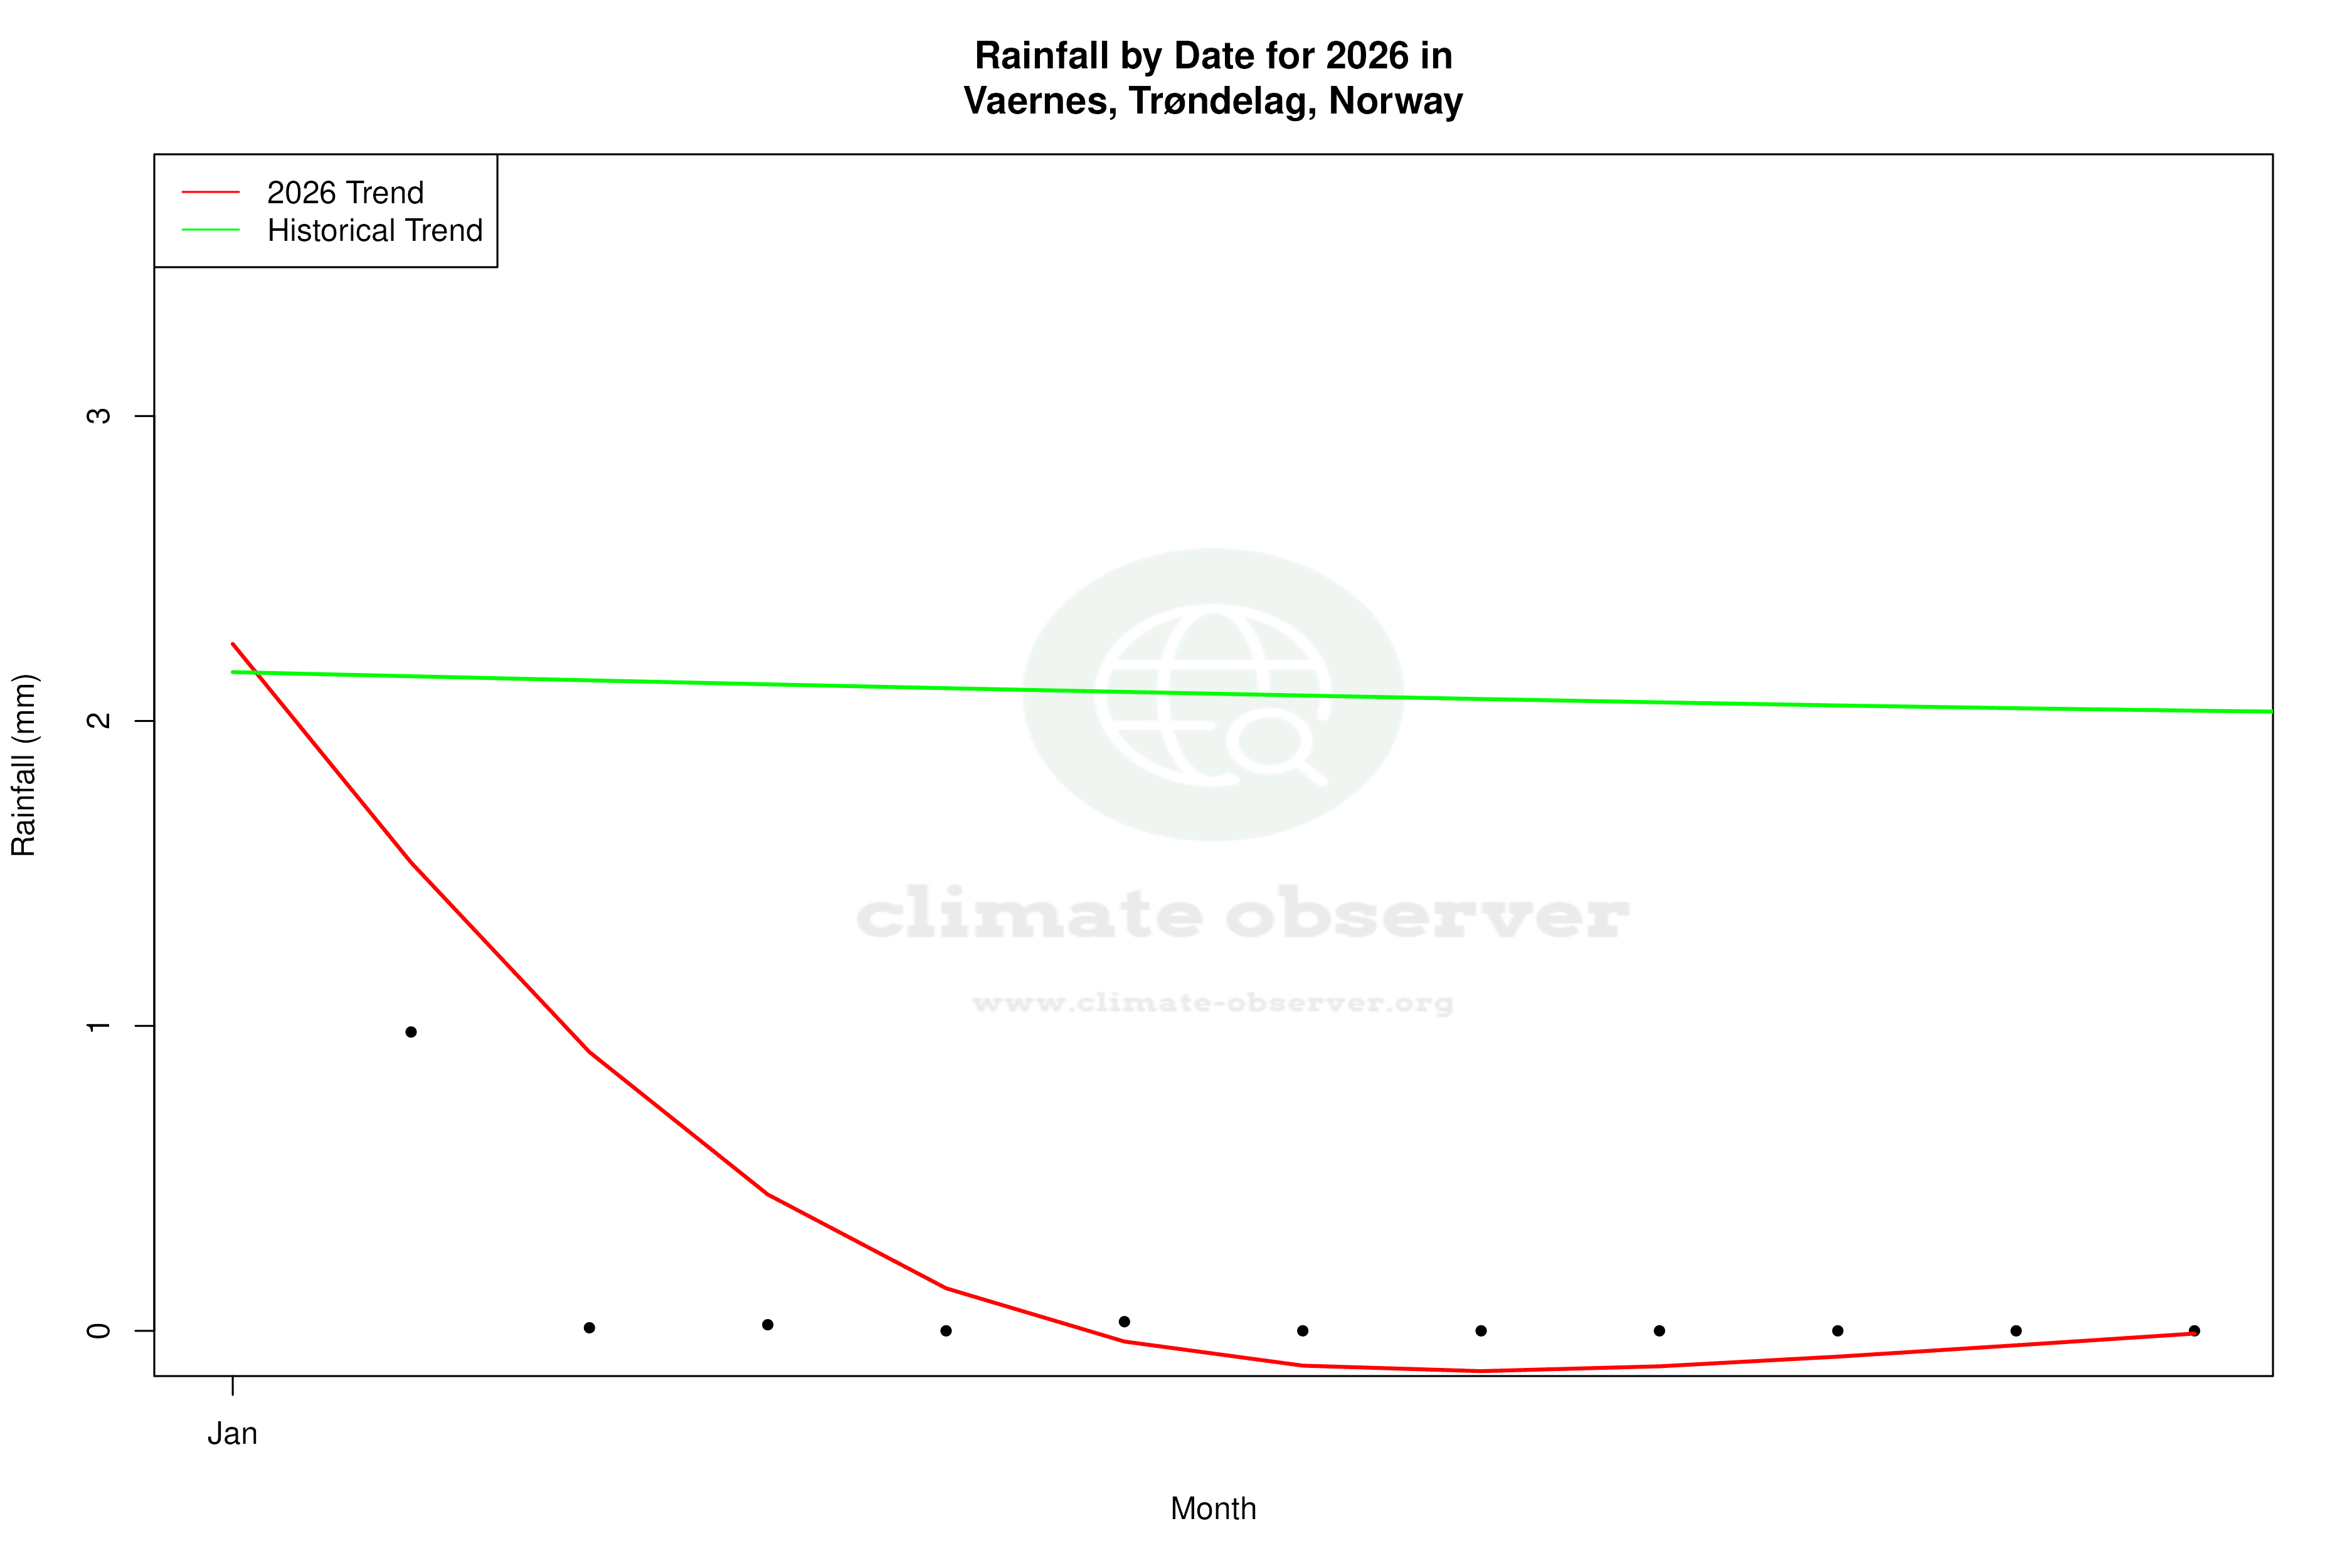
The Precipitation Concentration Index (PCI) for Vaernes has decreased from a baseline of 11.39 to a current value of 10.31. This indicates a more even distribution of precipitation throughout the year, as opposed to being concentrated in fewer, more intense events. A PCI value below 10 is considered very even, suggesting that Vaernes is approaching a more stable precipitation pattern. This change could be beneficial for agriculture and water management in the region, aligning with Norway's efforts to adapt to changing precipitation patterns due to climate change.
Geographical Influences on Climate
The local geography of Vaernes plays a significant role in shaping its climate. The region is bordered by the Trondheim Fjord to the west and the Scandinavian Mountains to the east. These geographical features contribute to the area's climatic conditions by moderating temperatures and influencing precipitation patterns. The fjord acts as a heat reservoir, which can moderate winter temperatures, while the mountains can create orographic lift, enhancing precipitation on the windward side.
Implications for Regional Climate Goals
The observed climatic changes in Vaernes are in line with Norway's broader climate objectives, which focus on reducing greenhouse gas emissions and enhancing climate resilience. The warming trends and more evenly distributed precipitation patterns suggest progress towards these goals. However, continued monitoring and adaptation strategies will be essential to manage the impacts of these changes on local ecosystems and communities.
Station Statistics
10-Year Trend
High: +1.04 °C/decade
Low: +0.26 °C/decade
Rain: +0.82 mm/decade
25-Year Trend
High: +0.40 °C/decade
Low: +0.26 °C/decade
Rain: +0.08 mm/decade
50-Year Trend
High: +0.44 °C/decade
Low: +0.36 °C/decade
Rain: +0.00 mm/decade
All-Time Trend
High: +0.23 °C/decade
Low: +0.25 °C/decade
Rain: +0.04 mm/decade
Percentage Above-Average Days
Last 12 Months: 54.8%
This Year: 27.5%
Precipitation Concentration Index (PCI) ℹ️
Last 12 Months: 10.8
Historical Average: 12.7
Percentile Rank of Last 12 Months ℹ️
High: 98th percentile
Low: 97th percentile
Rain: 96th percentile
Change in Variance ℹ️
High: +9.0%
Low: -2.4%
Intraday: +18.0%
Data Coverage
88.7%
First Year of Data
1960
Station Location
Historical Weather Records
| Max High | Avg High | Min High | Max Avg | Avg Avg | Min Avg | Max Low | Avg Low | Min Low | Max Precipitation | Avg Precipitation | Max Snow | Avg Snow | |
|---|---|---|---|---|---|---|---|---|---|---|---|---|---|
| Record | 34.5 °C | — | -21.0 °C | 27.0 °C | — | -23.2 °C | 22.7 °C | — | -25.6 °C | 77.6 mm | — | — | — |
| January | 13.7 °C | 0.7 °C | -21.0 °C | 7.8 °C | -2.2 °C | -23.2 °C | 6.0 °C | -5.7 °C | -25.6 °C | 46.0 mm | 2.1 mm | — | — |
| February | 13.8 °C | 1.3 °C | -16.9 °C | 9.3 °C | -1.6 °C | -21.4 °C | 6.2 °C | -5.2 °C | -25.5 °C | 39.4 mm | 2.0 mm | — | — |
| March | 15.7 °C | 4.4 °C | -9.5 °C | 10.1 °C | 0.9 °C | -16.4 °C | 8.6 °C | -2.8 °C | -23.0 °C | 49.4 mm | 2.0 mm | — | — |
| April | 23.3 °C | 8.5 °C | -1.2 °C | 16.5 °C | 4.6 °C | -5.6 °C | 12.5 °C | 0.8 °C | -13.9 °C | 45.7 mm | 1.7 mm | — | — |
| May | 30.0 °C | 13.9 °C | 2.8 °C | 24.4 °C | 9.2 °C | -0.7 °C | 18.9 °C | 5.0 °C | -4.7 °C | 33.0 mm | 1.7 mm | — | — |
| June | 34.3 °C | 17.2 °C | 7.2 °C | 25.8 °C | 12.6 °C | 4.5 °C | 22.1 °C | 8.8 °C | -0.2 °C | 51.3 mm | 2.4 mm | — | — |
| July | 34.5 °C | 19.3 °C | 9.3 °C | 27.0 °C | 15.0 °C | 7.4 °C | 22.7 °C | 10.9 °C | 2.3 °C | 51.0 mm | 2.6 mm | — | — |
| August | 31.3 °C | 18.5 °C | 9.4 °C | 26.6 °C | 14.2 °C | 7.1 °C | 21.8 °C | 10.3 °C | -0.3 °C | 59.2 mm | 2.7 mm | — | — |
| September | 27.9 °C | 14.5 °C | 5.5 °C | 21.1 °C | 10.6 °C | 1.7 °C | 18.0 °C | 7.2 °C | -4.9 °C | 77.6 mm | 3.3 mm | — | — |
| October | 22.1 °C | 9.2 °C | -3.0 °C | 17.1 °C | 6.0 °C | -7.1 °C | 14.6 °C | 3.1 °C | -10.8 °C | 48.6 mm | 3.0 mm | — | — |
| November | 16.1 °C | 4.2 °C | -15.7 °C | 14.2 °C | 1.7 °C | -16.3 °C | 11.2 °C | -1.4 °C | -19.0 °C | 36.7 mm | 2.3 mm | — | — |
| December | 13.1 °C | 1.9 °C | -19.5 °C | 11.3 °C | -1.1 °C | -21.3 °C | 7.5 °C | -4.3 °C | -23.5 °C | 41.7 mm | 2.5 mm | — | — |
Data Visualisations
Remove WatermarksCurrent Year Climate Trends vs Historical


Max Temperature this Year | 1 of 6
Climate 12-Month Moving Averages


Max Temperature 12-Month MA | 1 of 6
Daily Data Points and Averages Throughout the Year
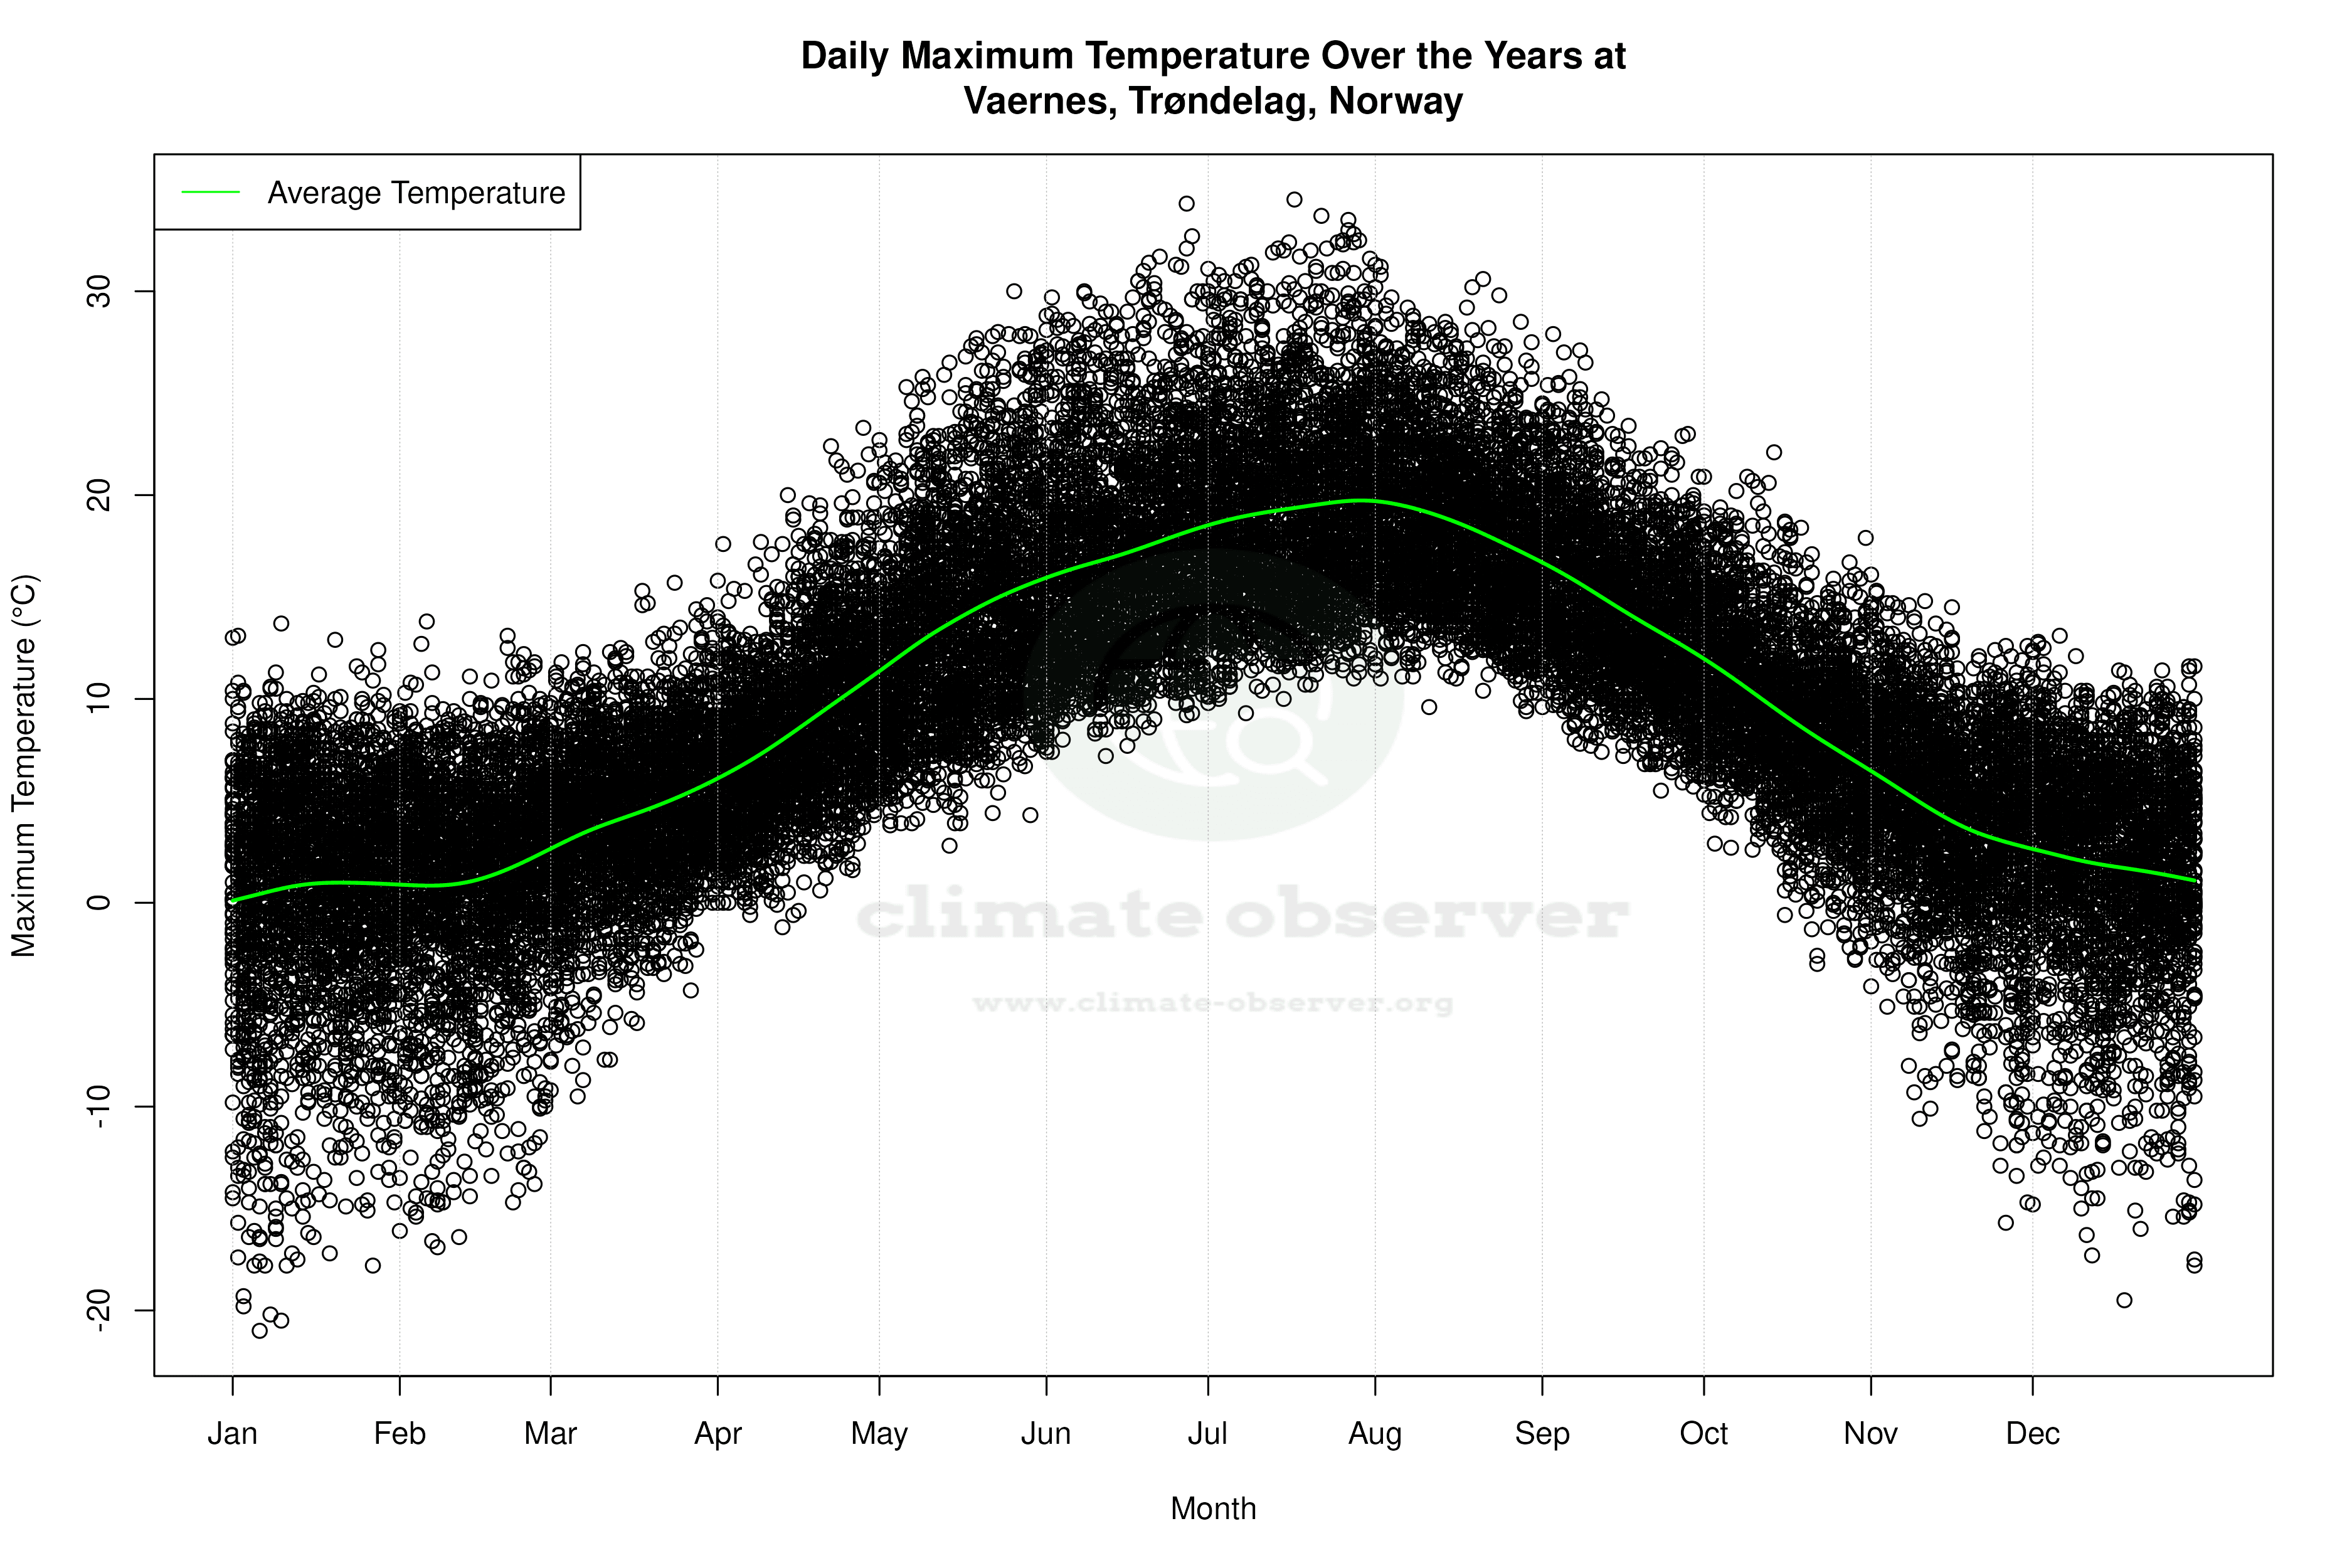


Average Max Temperature Throughout Year | 1 of 5
