Climate for Station: Oslo Blindern, Oslo, Norway
Loading live weather...
Climate Analysis & Overview
Oslo Blindern's climate is experiencing a nuanced warming trend, with a notable increase in high temperatures over the past decade. The precipitation distribution has become more even, suggesting a shift in local weather patterns. These changes align with broader regional climate goals aimed at understanding and mitigating climate impacts.
Oslo's Climatic Context
Oslo Blindern is situated at 59.94°N, 10.72°E, nestled within a temperate climate zone classified as Dfb under the Köppen system, indicating a humid continental climate with warm summers and cold, snowy winters. The city's proximity to the Oslofjord and surrounding hills influences its weather patterns, moderating temperatures and contributing to varied precipitation.
Warming Trends in Temperature
Over the long term, Oslo Blindern has experienced a modest warming trend. The all-time data reveals an increase in high temperatures by 0.23°C (0.41°F) and lows by 0.27°C (0.49°F). This warming is more pronounced in recent years, with the last decade showing a sharper rise in highs by 0.56°C (1.01°F) and lows by 0.26°C (0.47°F). These trends suggest a gradual shift towards warmer conditions, which is consistent with broader regional observations and aligns with Norway's climate goals to monitor and adapt to these changes.
Temperature Extremes
Oslo Blindern has recorded extreme temperatures that illustrate its climatic variability. The highest temperature reached was 34.6°C (94.3°F), while the coldest was -26.0°C (-14.8°F). These extremes underscore the city's capacity for significant thermal oscillations, influenced by both local geographical features and broader atmospheric conditions.
Precipitation Patterns and Distribution
The Precipitation Concentration Index (PCI) at Oslo Blindern has decreased from a baseline of 11.8 to a current value of 10.0. This change indicates a more even distribution of precipitation events, suggesting that rainfall is now spread more consistently throughout the year rather than being concentrated in fewer, intense events. Such a shift could be beneficial for water management and agricultural planning, reducing the risk of flooding and drought.
Regional Climate Implications
These climatic trends at Oslo Blindern are reflective of larger patterns observed across Norway. The country's commitment to understanding climate dynamics is crucial in developing strategies to mitigate adverse impacts. Recent weather events, such as unseasonal storms or heatwaves, highlight the importance of ongoing monitoring and adaptation. The data from Oslo Blindern contributes to a comprehensive understanding of these changes, supporting efforts to achieve sustainable climate resilience.
Station Statistics
10-Year Trend
High: +0.53 °C/decade
Low: +0.27 °C/decade
Rain: +0.25 mm/decade
25-Year Trend
High: +0.51 °C/decade
Low: +0.27 °C/decade
Rain: +0.02 mm/decade
50-Year Trend
High: +0.52 °C/decade
Low: +0.43 °C/decade
Rain: +0.11 mm/decade
All-Time Trend
High: +0.22 °C/decade
Low: +0.27 °C/decade
Rain: +0.06 mm/decade
Percentage Above-Average Days
Last 12 Months: 59.5%
This Year: 85.0%
Precipitation Concentration Index (PCI) ℹ️
Last 12 Months: 10.2
Historical Average: 12.8
Percentile Rank of Last 12 Months ℹ️
High: 98th percentile
Low: 96th percentile
Rain: 54th percentile
Change in Variance ℹ️
High: -4.7%
Low: -13.5%
Intraday: +7.4%
Data Coverage
87.6%
First Year of Data
1950
Station Location
Historical Weather Records
| Max High | Avg High | Min High | Max Avg | Avg Avg | Min Avg | Max Low | Avg Low | Min Low | Max Precipitation | Avg Precipitation | Max Snow | Avg Snow | |
|---|---|---|---|---|---|---|---|---|---|---|---|---|---|
| Record | 34.6 °C | — | -20.5 °C | 25.7 °C | — | -32.4 °C | 21.7 °C | — | -26.0 °C | 59.8 mm | — | — | — |
| January | 12.5 °C | -1.3 °C | -20.5 °C | 7.4 °C | -4.0 °C | -32.4 °C | 5.7 °C | -6.3 °C | -26.0 °C | 35.5 mm | 1.7 mm | — | — |
| February | 13.8 °C | -0.1 °C | -16.1 °C | 7.1 °C | -3.2 °C | -23.6 °C | 5.4 °C | -6.1 °C | -24.9 °C | 28.0 mm | 1.4 mm | — | — |
| March | 21.5 °C | 4.4 °C | -9.9 °C | 13.4 °C | 0.2 °C | -19.2 °C | 7.8 °C | -3.0 °C | -21.3 °C | 32.0 mm | 1.2 mm | — | — |
| April | 25.4 °C | 10.0 °C | -2.6 °C | 18.7 °C | 5.1 °C | -5.7 °C | 13.6 °C | 1.3 °C | -9.8 °C | 34.5 mm | 1.4 mm | — | — |
| May | 31.1 °C | 16.3 °C | 2.9 °C | 24.6 °C | 10.9 °C | 0.4 °C | 17.8 °C | 6.4 °C | -3.4 °C | 43.3 mm | 1.7 mm | — | — |
| June | 33.7 °C | 20.4 °C | 9.3 °C | 25.4 °C | 14.8 °C | 5.7 °C | 19.7 °C | 10.6 °C | 1.4 °C | 42.6 mm | 2.4 mm | — | — |
| July | 34.6 °C | 22.2 °C | 11.9 °C | 25.7 °C | 16.9 °C | 9.7 °C | 21.7 °C | 12.8 °C | 3.7 °C | 59.8 mm | 2.8 mm | — | — |
| August | 34.2 °C | 20.8 °C | 10.3 °C | 24.5 °C | 15.6 °C | 7.6 °C | 20.2 °C | 11.9 °C | 3.7 °C | 57.2 mm | 3.1 mm | — | — |
| September | 27.2 °C | 15.8 °C | 4.4 °C | 21.2 °C | 11.3 °C | 1.2 °C | 17.3 °C | 8.1 °C | -3.3 °C | 58.7 mm | 2.8 mm | — | — |
| October | 21.0 °C | 9.5 °C | -2.2 °C | 15.2 °C | 6.0 °C | -10.2 °C | 13.1 °C | 3.7 °C | -8.0 °C | 47.6 mm | 2.7 mm | — | — |
| November | 16.1 °C | 3.7 °C | -10.4 °C | 12.6 °C | 1.0 °C | -16.3 °C | 11.0 °C | -0.8 °C | -16.0 °C | 46.1 mm | 2.5 mm | — | — |
| December | 12.6 °C | 0.2 °C | -16.4 °C | 8.7 °C | -2.8 °C | -21.7 °C | 7.8 °C | -4.6 °C | -20.8 °C | 29.0 mm | 1.8 mm | — | — |
Data Visualisations
Remove WatermarksCurrent Year Climate Trends vs Historical


Max Temperature this Year | 1 of 6
Climate 12-Month Moving Averages


Max Temperature 12-Month MA | 1 of 6
Daily Data Points and Averages Throughout the Year

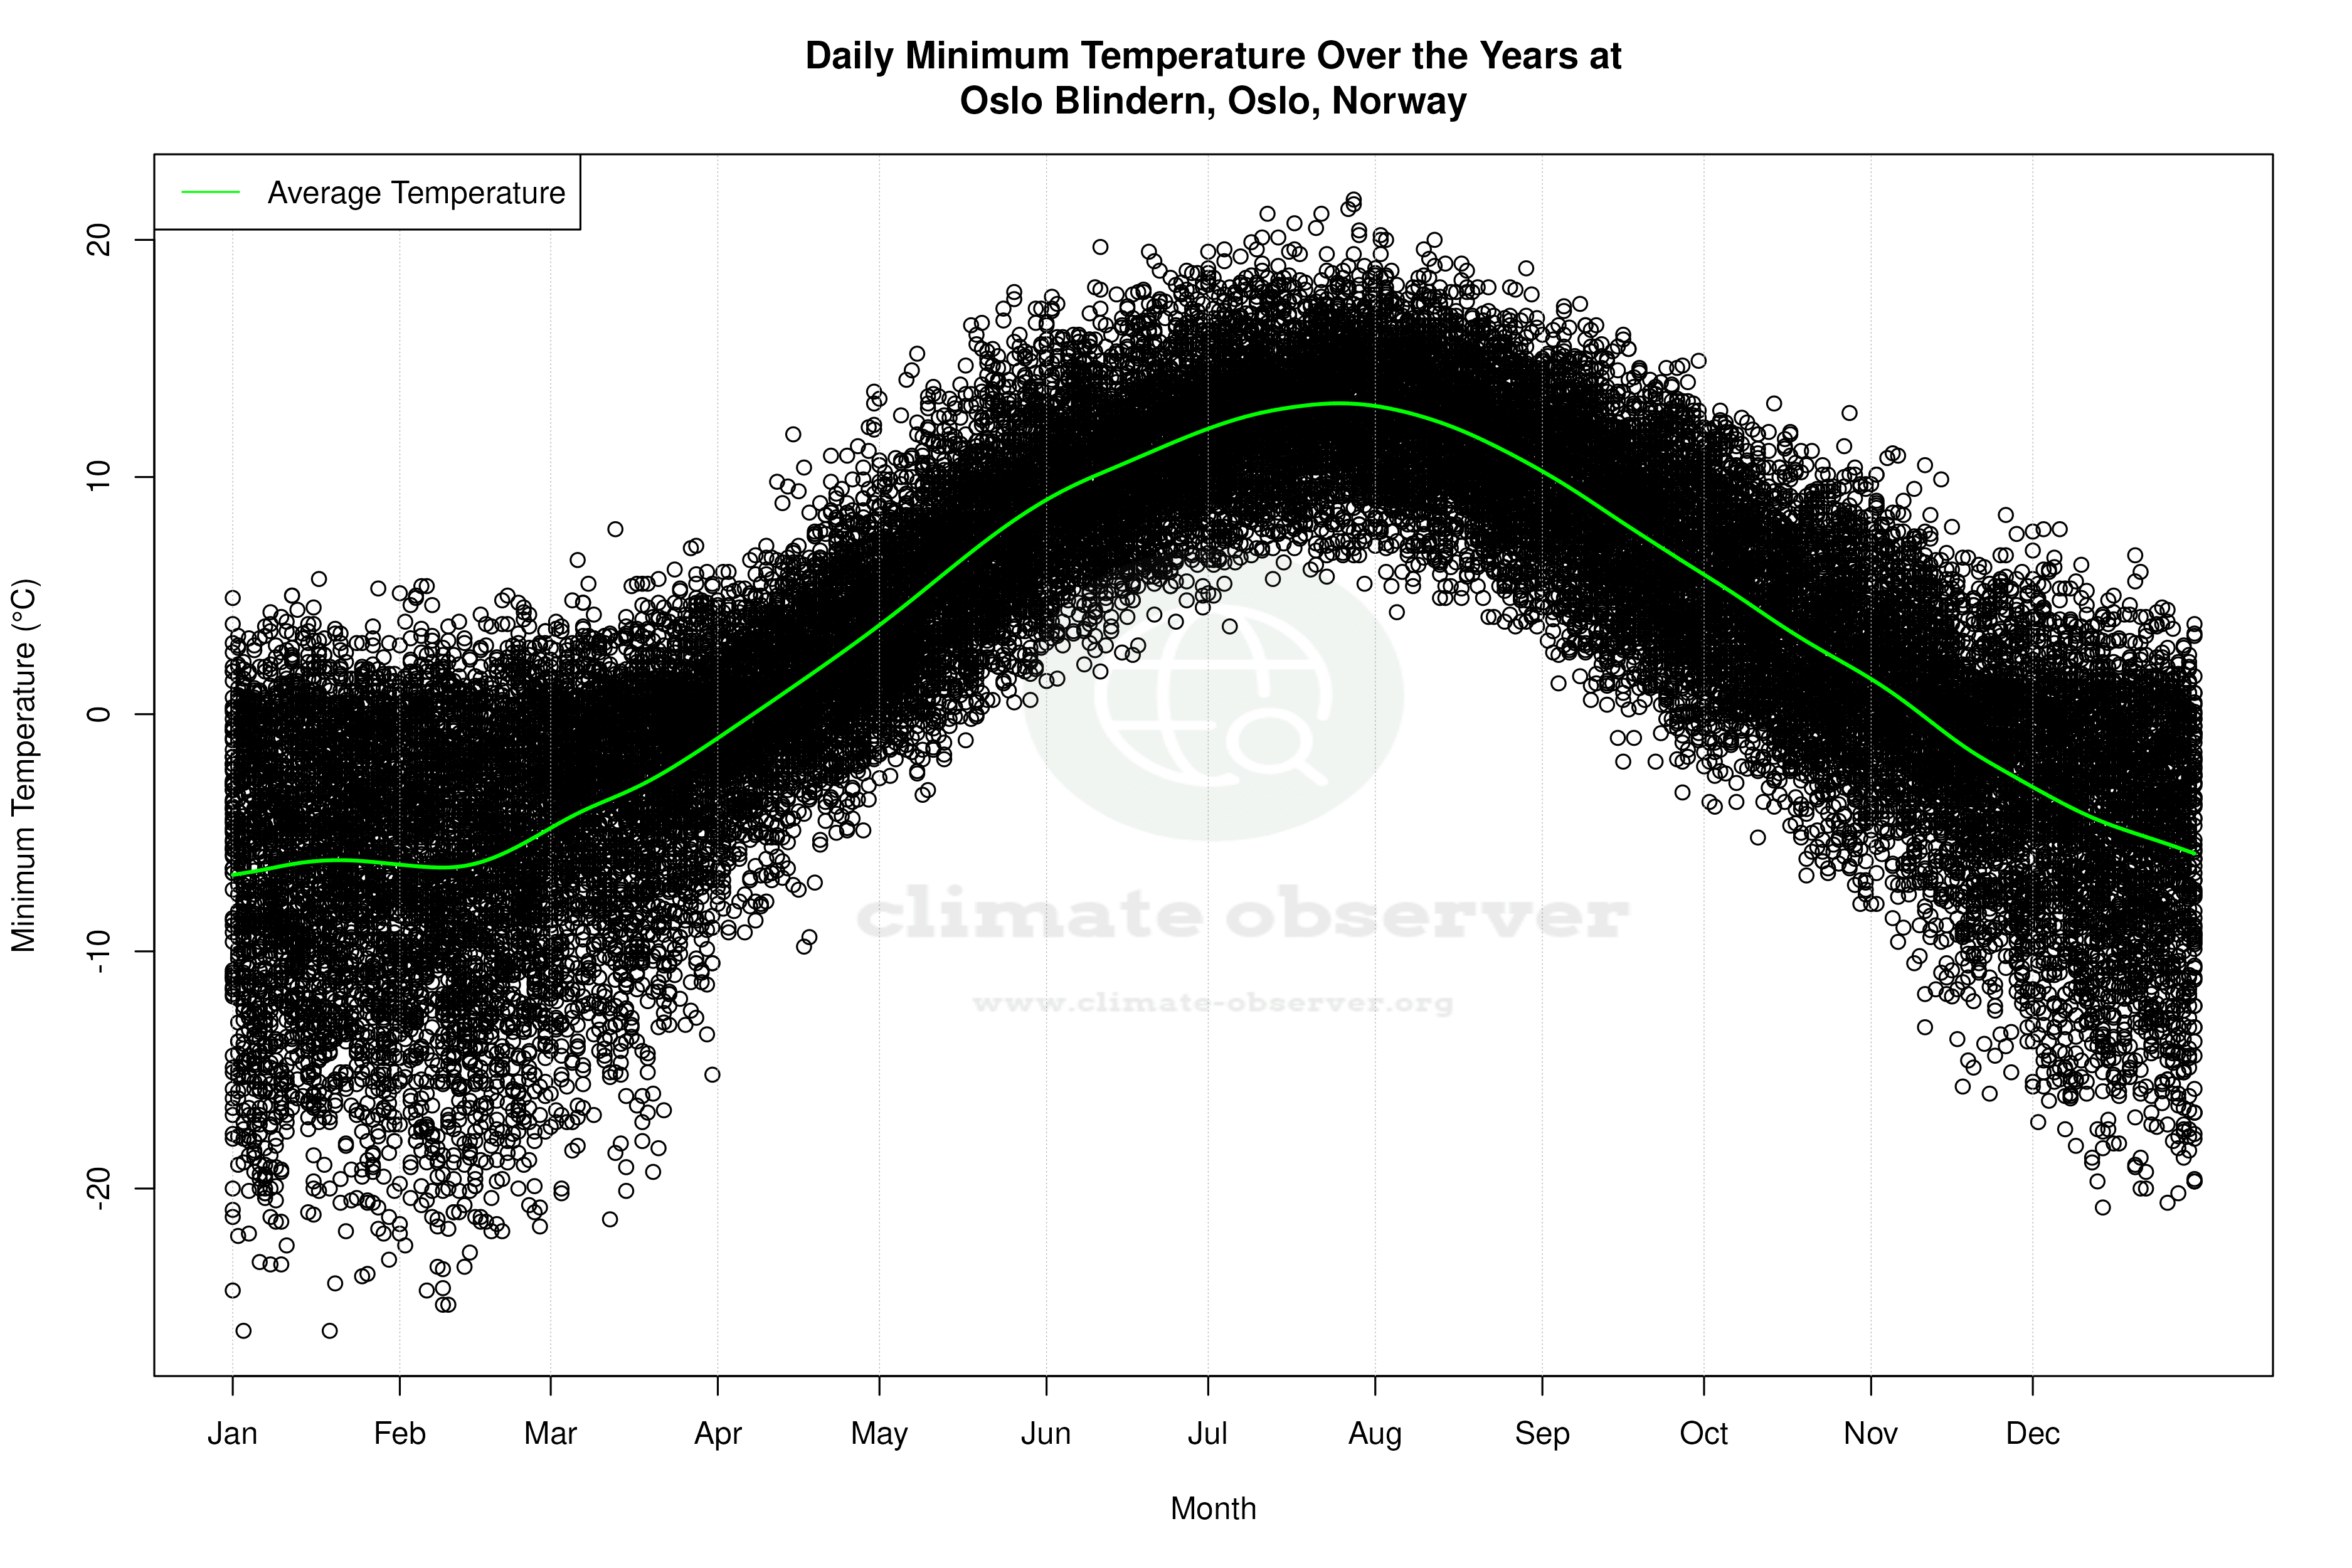


Average Max Temperature Throughout Year | 1 of 5
