Climate for Station: Raoul Isl/Kermadec, Kermadec Islands, New Zealand
Loading live weather...
Climate Analysis & Overview
Raoul Island, part of the Kermadec Islands, is experiencing nuanced climatic shifts, with a notable divergence between short-term and long-term temperature trends. While the all-time data indicates a slight warming in highs and lows, recent years have seen a cooling trend in low temperatures. Precipitation patterns have become more evenly distributed, suggesting a shift towards a more balanced rainfall regime.
Köppen Classification and Geographic Influence
Raoul Island falls under the Köppen climate classification of Cfa, which denotes a humid subtropical climate. This classification is characterised by warm, humid summers and mild winters. The island's remote location in the South Pacific, combined with its volcanic topography, influences its weather patterns. The surrounding ocean moderates temperatures, while the island's elevation can lead to orographic rainfall, where moist air ascends the volcanic slopes, cooling and condensing to form precipitation.
Temperature Trends: A Dual Narrative
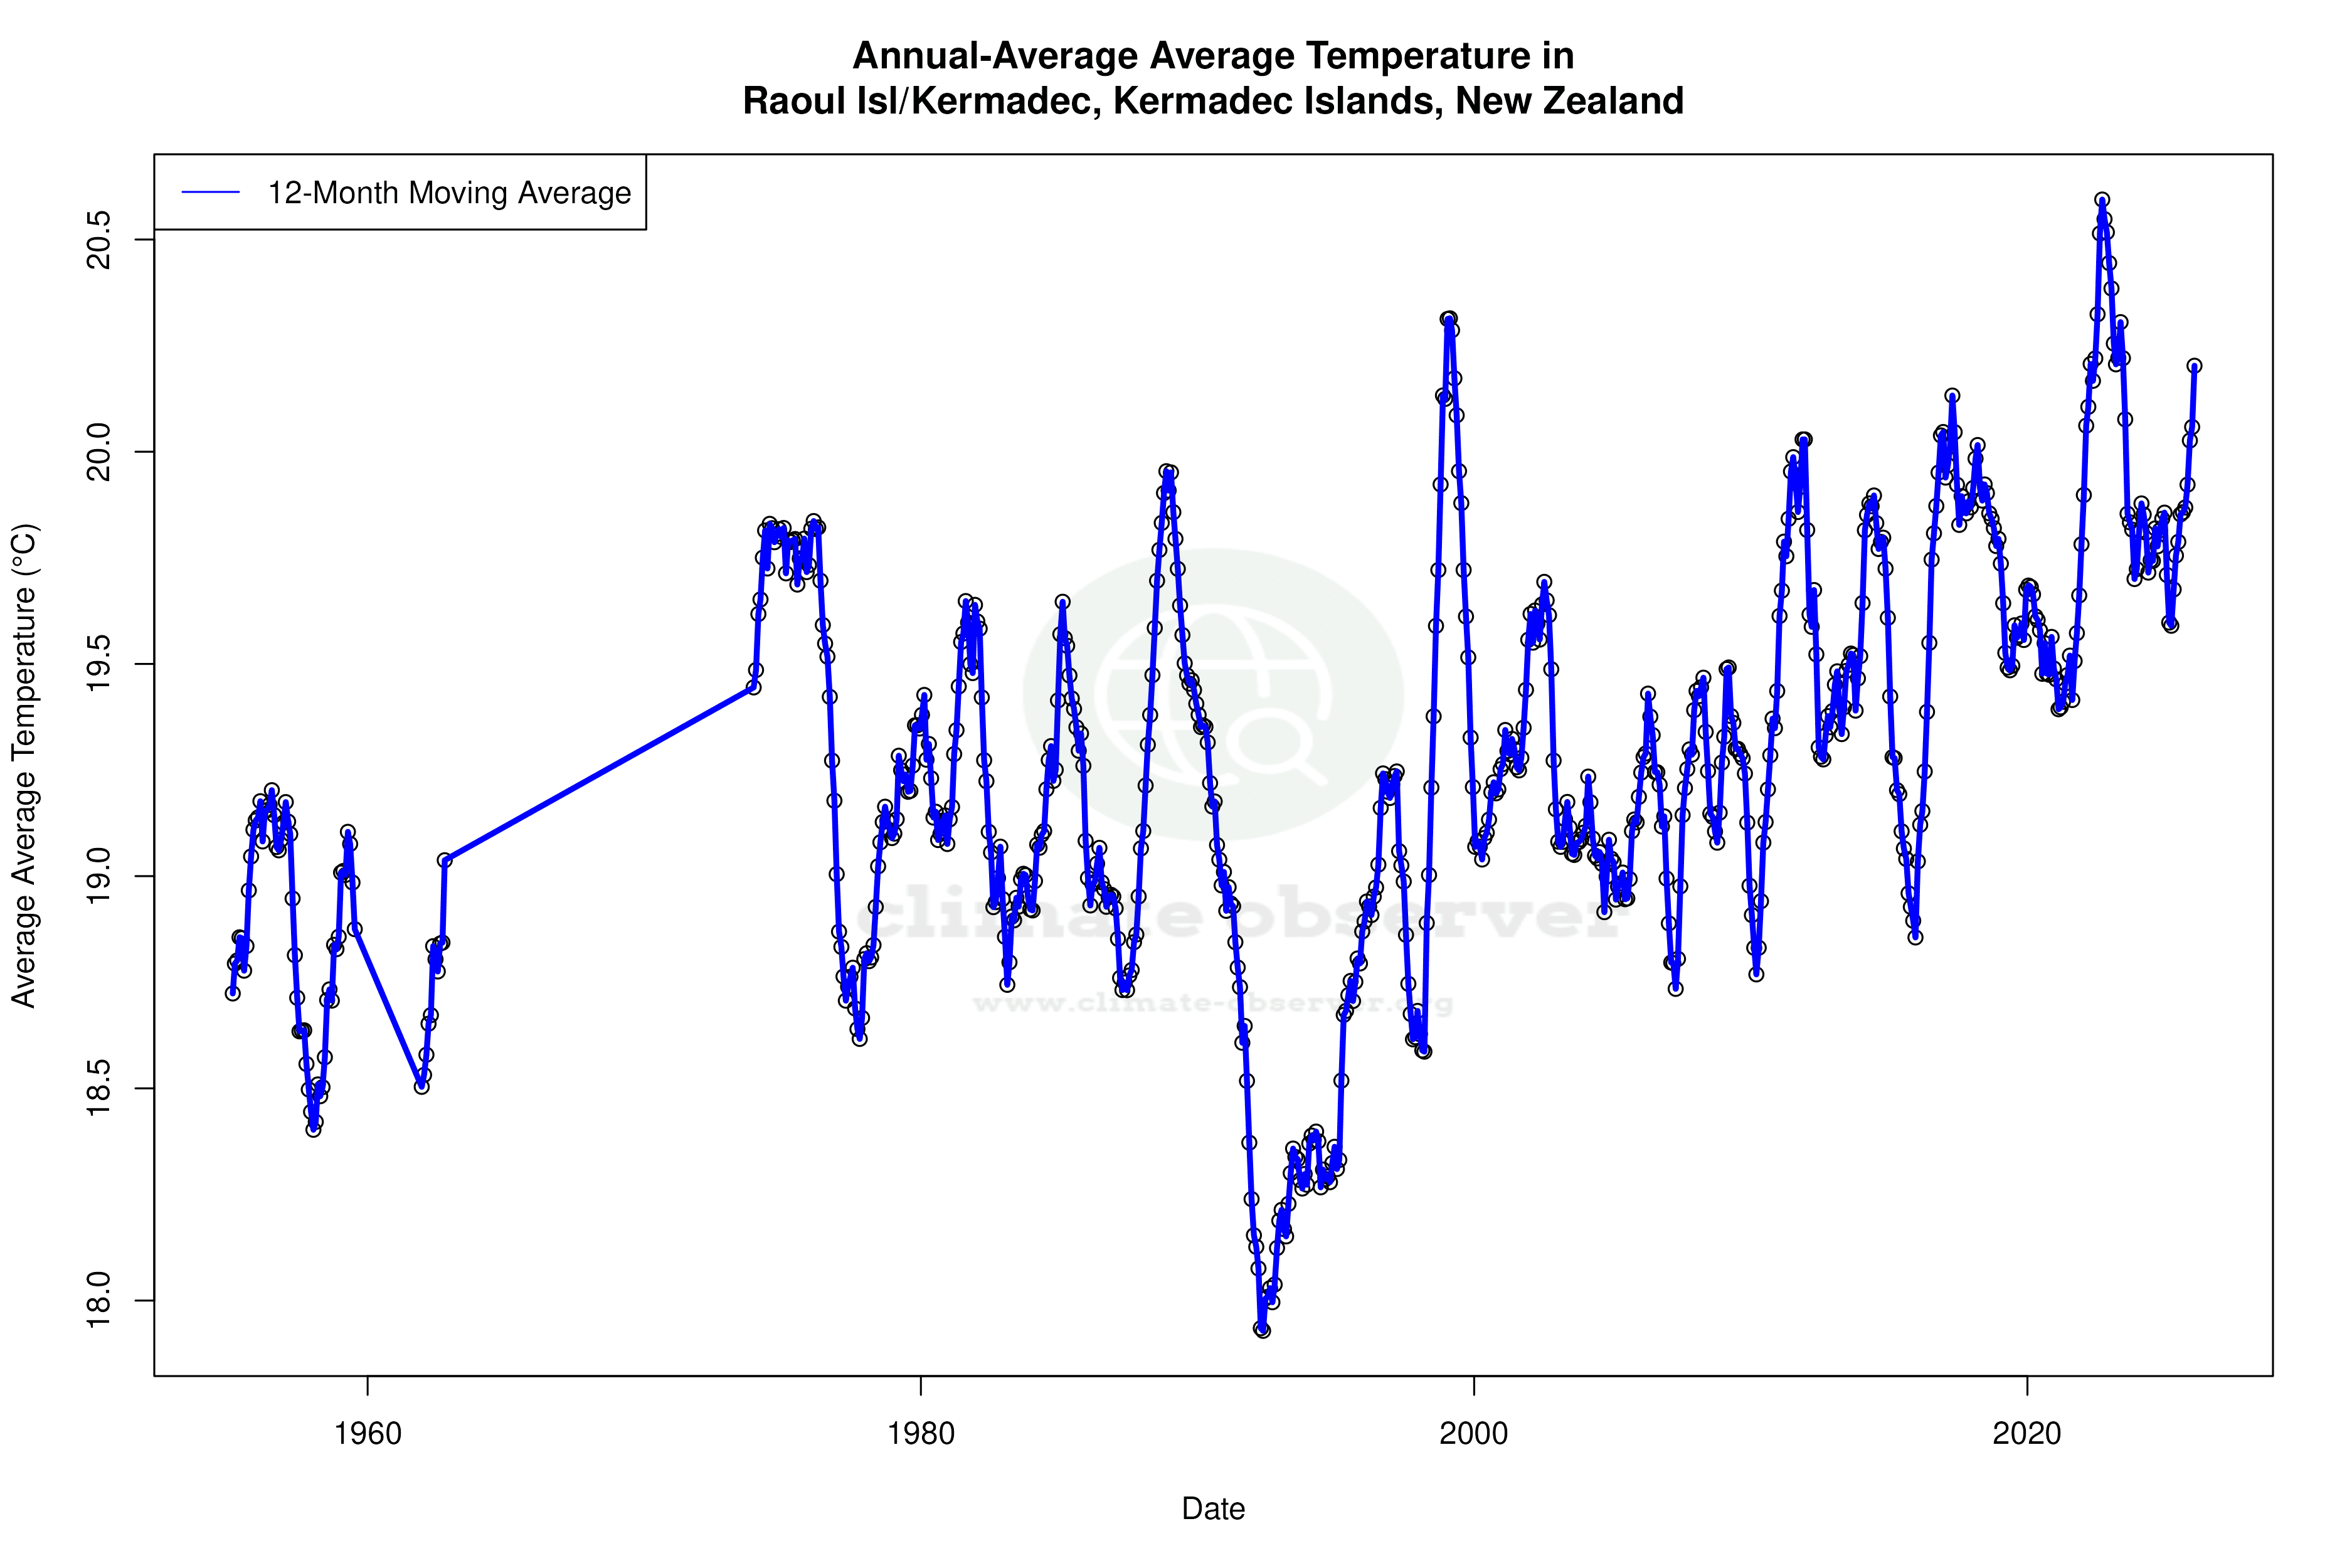
The temperature trends on Raoul Island present a complex picture. Over the past decade, there has been a 0.13°C (0.23°F) rise in high temperatures, contrasting sharply with a 0.74°C (1.33°F) fall in low temperatures. This recent cooling of lows is intriguing, especially when juxtaposed with the all-time trends, where highs have increased by 0.08°C (0.14°F) and lows by 0.25°C (0.45°F). This suggests that while the island has experienced a long-term warming trend, recent years have seen a divergence, particularly in nighttime temperatures.
Precipitation Patterns: Towards Even Distribution
The Precipitation Concentration Index (PCI) provides insight into rainfall distribution. Raoul Island's PCI has decreased from a baseline of 11.55 to a current value of 9.54, indicating a shift towards more evenly distributed precipitation throughout the year. This change can lead to a more stable water supply, reducing the risk of both droughts and floods. The PCI is a measure of how rainfall is spread over time, with lower values indicating more uniform distribution.
Temperature Extremes: Record Observations
Raoul Island has recorded a maximum temperature of 31.0°C (87.8°F) and a minimum of 7.4°C (45.3°F). These extremes highlight the island's capacity for both warmth and chill, influenced by its maritime climate. The moderation of temperatures is typical of island climates, where the surrounding ocean acts as a thermal buffer.
Regional Climate Context
New Zealand's commitment to climate resilience and sustainability provides a backdrop to these observations. Recent weather events, such as cyclones and prolonged dry spells, underscore the importance of understanding local climatic nuances. Raoul Island's data contributes to the broader narrative of New Zealand's climate dynamics, offering insights into the challenges and opportunities for adaptation in a changing world.
Station Statistics
10-Year Trend
High: -0.06 °C/decade
Low: -0.26 °C/decade
Rain: +0.99 mm/decade
25-Year Trend
High: +0.42 °C/decade
Low: -0.04 °C/decade
Rain: +0.08 mm/decade
50-Year Trend
High: +0.13 °C/decade
Low: +0.48 °C/decade
Rain: +0.01 mm/decade
All-Time Trend
High: +0.08 °C/decade
Low: +0.26 °C/decade
Rain: +0.01 mm/decade
Percentage Above-Average Days
Last 12 Months: 45.8%
This Year: 37.4%
Precipitation Concentration Index (PCI) ℹ️
Last 12 Months: 10.4
Historical Average: 11.1
Percentile Rank of Last 12 Months ℹ️
High: 79th percentile
Low: 91st percentile
Rain: 76th percentile
Change in Variance ℹ️
High: +6.1%
Low: +5.2%
Intraday: +53.9%
Data Coverage
81.2%
First Year of Data
1940
Station Location
Historical Weather Records
| Max High | Avg High | Min High | Max Avg | Avg Avg | Min Avg | Max Low | Avg Low | Min Low | Max Precipitation | Avg Precipitation | Max Snow | Avg Snow | |
|---|---|---|---|---|---|---|---|---|---|---|---|---|---|
| Record | 31.0 °C | — | 14.5 °C | 27.1 °C | — | 10.2 °C | 25.9 °C | — | 7.4 °C | 160.0 mm | — | — | — |
| January | 31.0 °C | 24.6 °C | 20.1 °C | 26.2 °C | 22.2 °C | 17.9 °C | 25.2 °C | 19.8 °C | 13.6 °C | 157.3 mm | 2.6 mm | — | — |
| February | 30.7 °C | 25.1 °C | 20.3 °C | 27.1 °C | 22.8 °C | 18.1 °C | 25.5 °C | 20.6 °C | 14.3 °C | 134.9 mm | 4.0 mm | — | — |
| March | 29.5 °C | 24.6 °C | 19.0 °C | 27.0 °C | 22.1 °C | 17.0 °C | 25.9 °C | 20.0 °C | 13.4 °C | 114.8 mm | 4.1 mm | — | — |
| April | 28.4 °C | 23.3 °C | 18.4 °C | 25.1 °C | 20.7 °C | 16.0 °C | 24.5 °C | 18.5 °C | 8.0 °C | 97.3 mm | 3.5 mm | — | — |
| May | 25.7 °C | 21.5 °C | 16.9 °C | 22.8 °C | 19.0 °C | 13.9 °C | 22.5 °C | 16.8 °C | 10.4 °C | 89.9 mm | 3.5 mm | — | — |
| June | 24.2 °C | 20.0 °C | 14.6 °C | 22.2 °C | 17.5 °C | 12.7 °C | 21.8 °C | 15.4 °C | 9.0 °C | 103.1 mm | 4.1 mm | — | — |
| July | 23.5 °C | 18.9 °C | 14.7 °C | 21.1 °C | 16.4 °C | 11.8 °C | 20.7 °C | 14.2 °C | 8.1 °C | 160.0 mm | 4.2 mm | — | — |
| August | 23.7 °C | 18.8 °C | 14.5 °C | 20.8 °C | 16.1 °C | 10.2 °C | 20.0 °C | 13.9 °C | 7.4 °C | 110.0 mm | 3.8 mm | — | — |
| September | 24.1 °C | 19.3 °C | 15.1 °C | 20.5 °C | 16.6 °C | 11.8 °C | 20.0 °C | 14.3 °C | 8.5 °C | 110.0 mm | 3.0 mm | — | — |
| October | 27.1 °C | 20.3 °C | 16.4 °C | 21.2 °C | 17.7 °C | 13.5 °C | 20.6 °C | 15.3 °C | 9.3 °C | 50.0 mm | 2.1 mm | — | — |
| November | 26.7 °C | 21.7 °C | 16.6 °C | 23.5 °C | 19.1 °C | 14.5 °C | 22.4 °C | 16.7 °C | 10.4 °C | 103.1 mm | 3.1 mm | — | — |
| December | 29.1 °C | 23.3 °C | 18.3 °C | 25.8 °C | 20.9 °C | 15.0 °C | 24.5 °C | 18.5 °C | 12.5 °C | 99.3 mm | 2.9 mm | — | — |
Data Visualisations
Remove WatermarksCurrent Year Climate Trends vs Historical


Max Temperature this Year | 1 of 6
Climate 12-Month Moving Averages
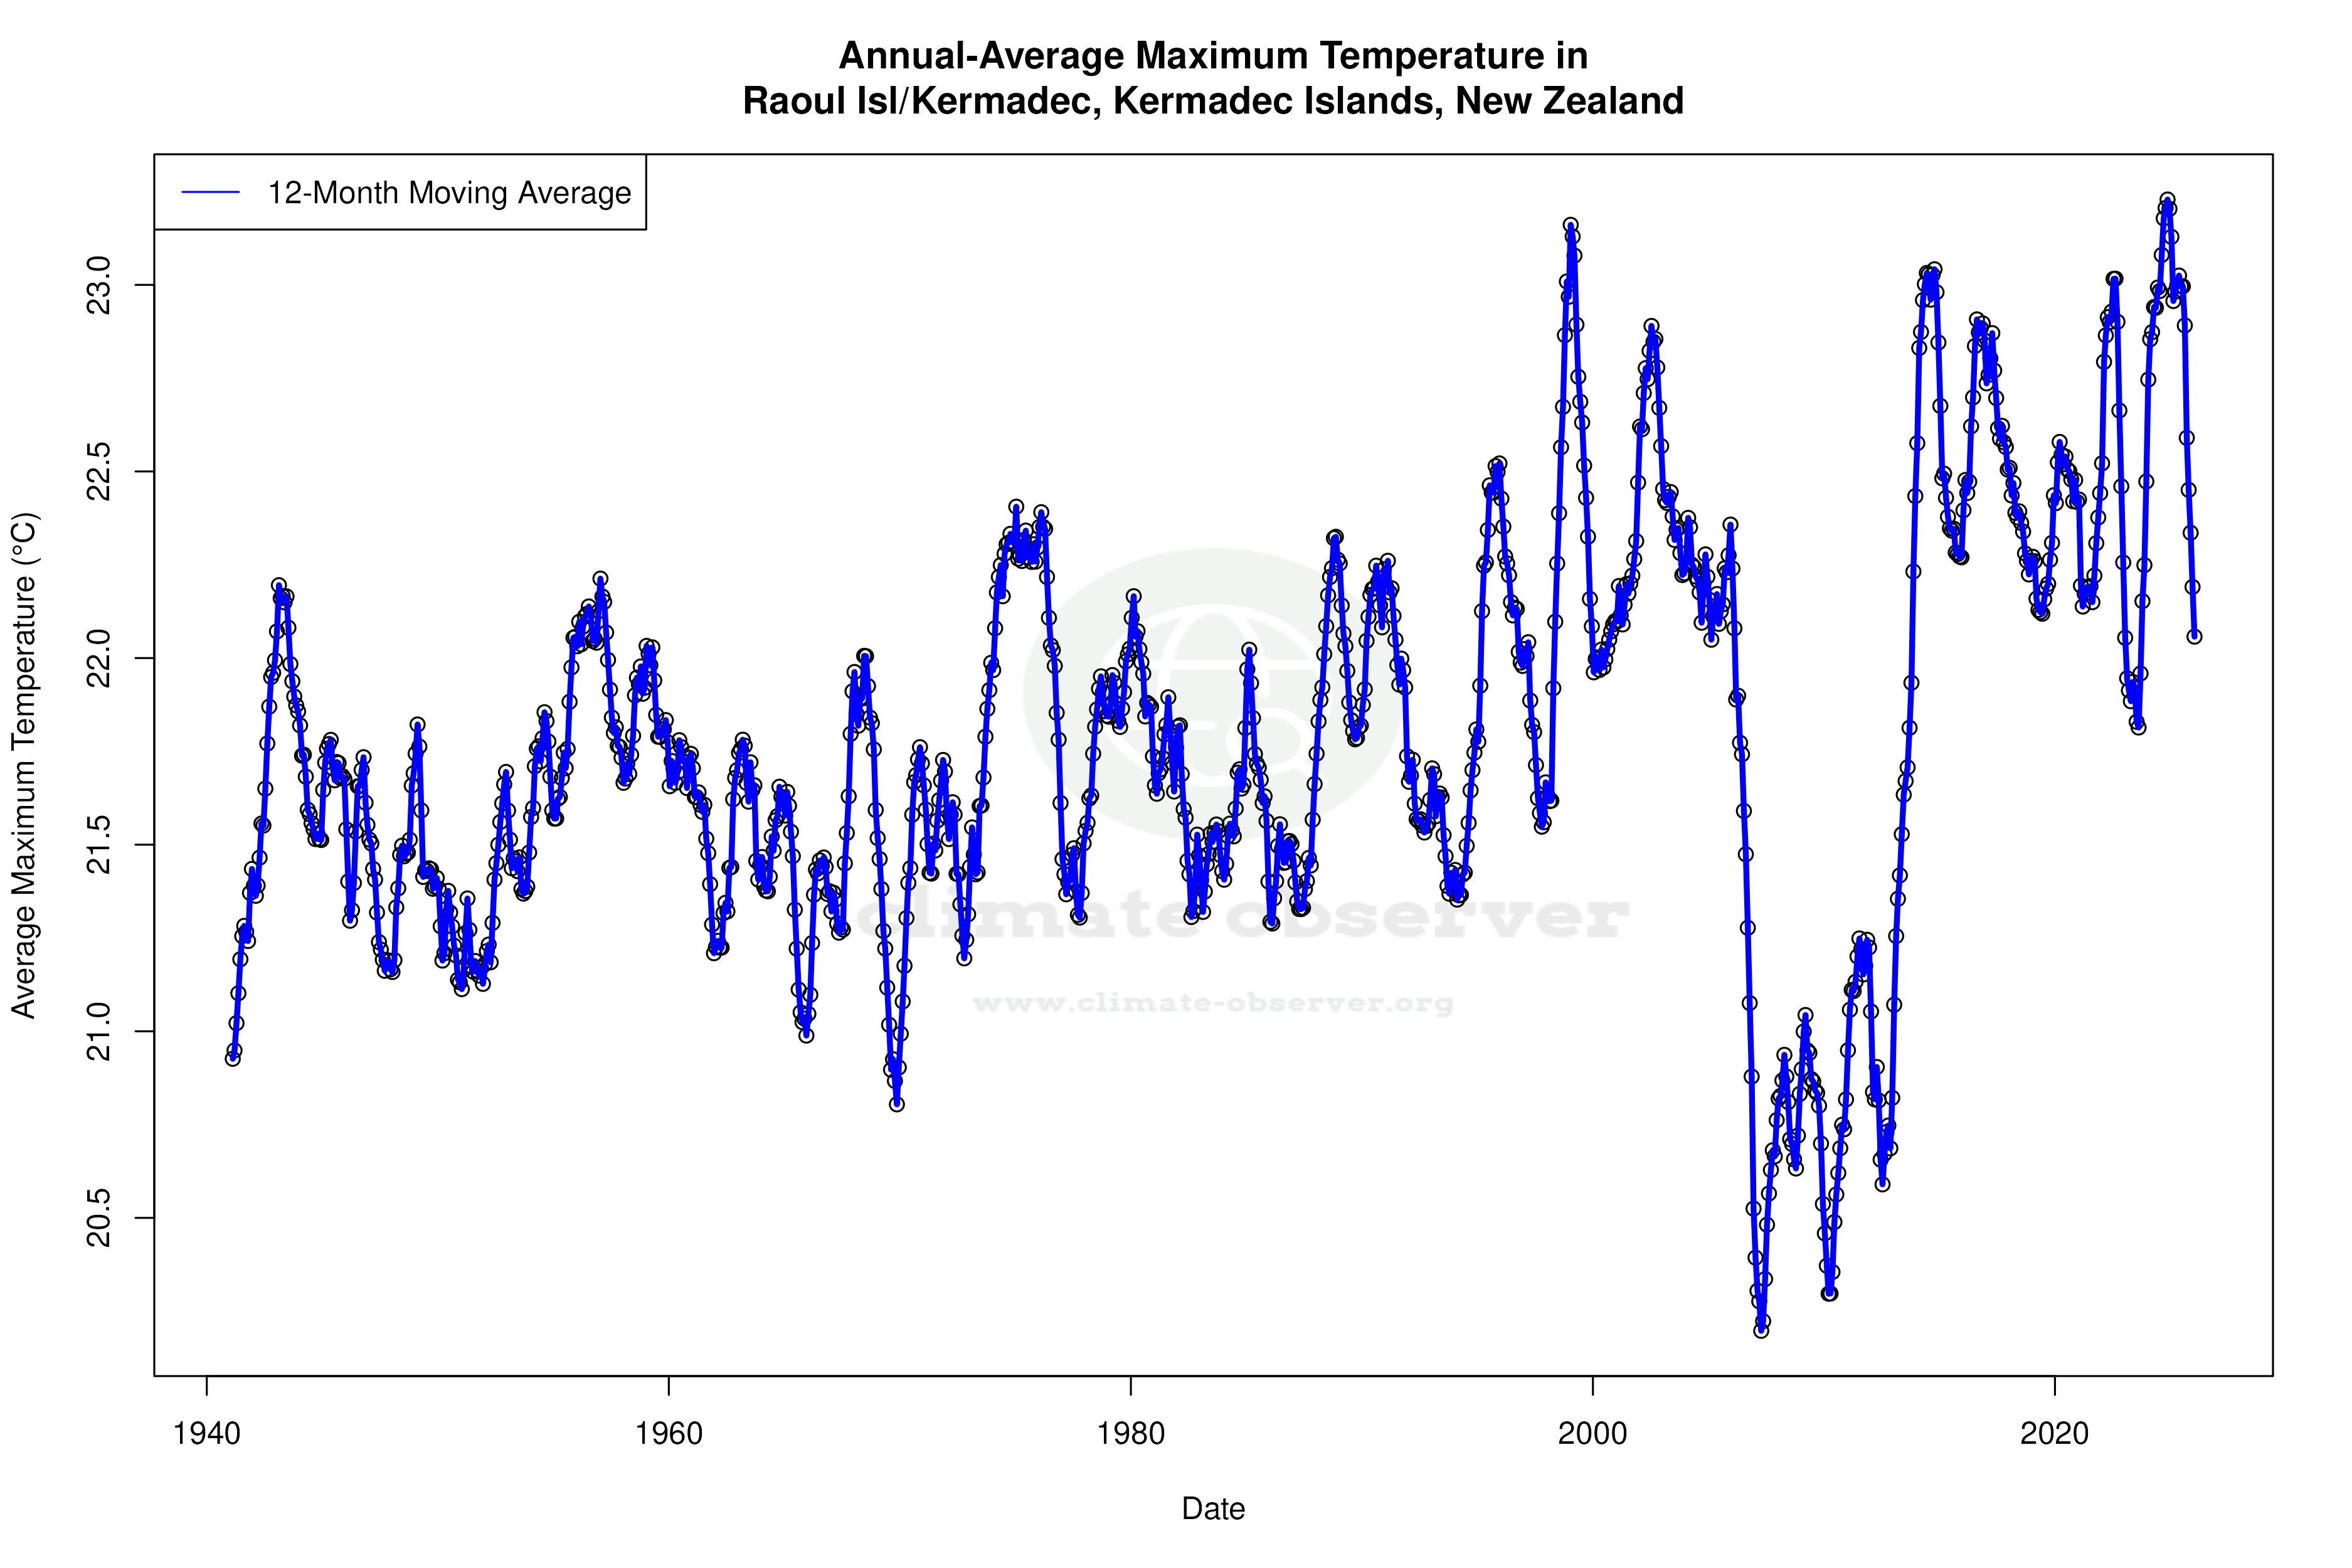


Max Temperature 12-Month MA | 1 of 6
Daily Data Points and Averages Throughout the Year


Average Max Temperature Throughout Year | 1 of 5