Climate for Station: Iquitos, Peru
Loading live weather...
Climate Analysis & Overview
Iquitos, nestled in the heart of the Amazon, is experiencing a unique climate narrative. While long-term trends indicate a slight warming, recent data shows a cooling trend in maximum temperatures. The region's precipitation pattern has become more evenly distributed, reflecting a shift in local climate dynamics.
Equatorial Climate Dynamics
Iquitos, located at -3.783, -73.3, is characterised by a tropical rainforest climate (Af) under the Köppen classification. This region, surrounded by the vast Amazon River and dense jungle, typically experiences high humidity and consistent rainfall throughout the year. The geographical setting contributes to stable temperatures, yet recent data reveals intriguing shifts. Over the past decade, maximum temperatures have decreased by 1.43°C (2.57°F), suggesting a short-term cooling trend. However, the all-time trend shows a slight warming of 0.12°C (0.22°F), indicating a complex interplay between short-term variability and long-term climate change.
Temperature Trends: A Tale of Two Intervals
The temperature trends in Iquitos present a dichotomy. While the 10-year trend for highs shows a cooling of 1.43°C (2.57°F), the all-time trend reflects a modest warming of 0.12°C (0.22°F). Conversely, minimum temperatures have shown a negligible increase of 0.01°C (0.02°F) over the past decade, aligning with the all-time warming trend of 0.15°C (0.27°F). These patterns suggest a stabilisation in nighttime temperatures, while daytime highs exhibit more variability. Such trends are vital for understanding local climate impacts, particularly in a region where temperature stability is crucial for biodiversity.
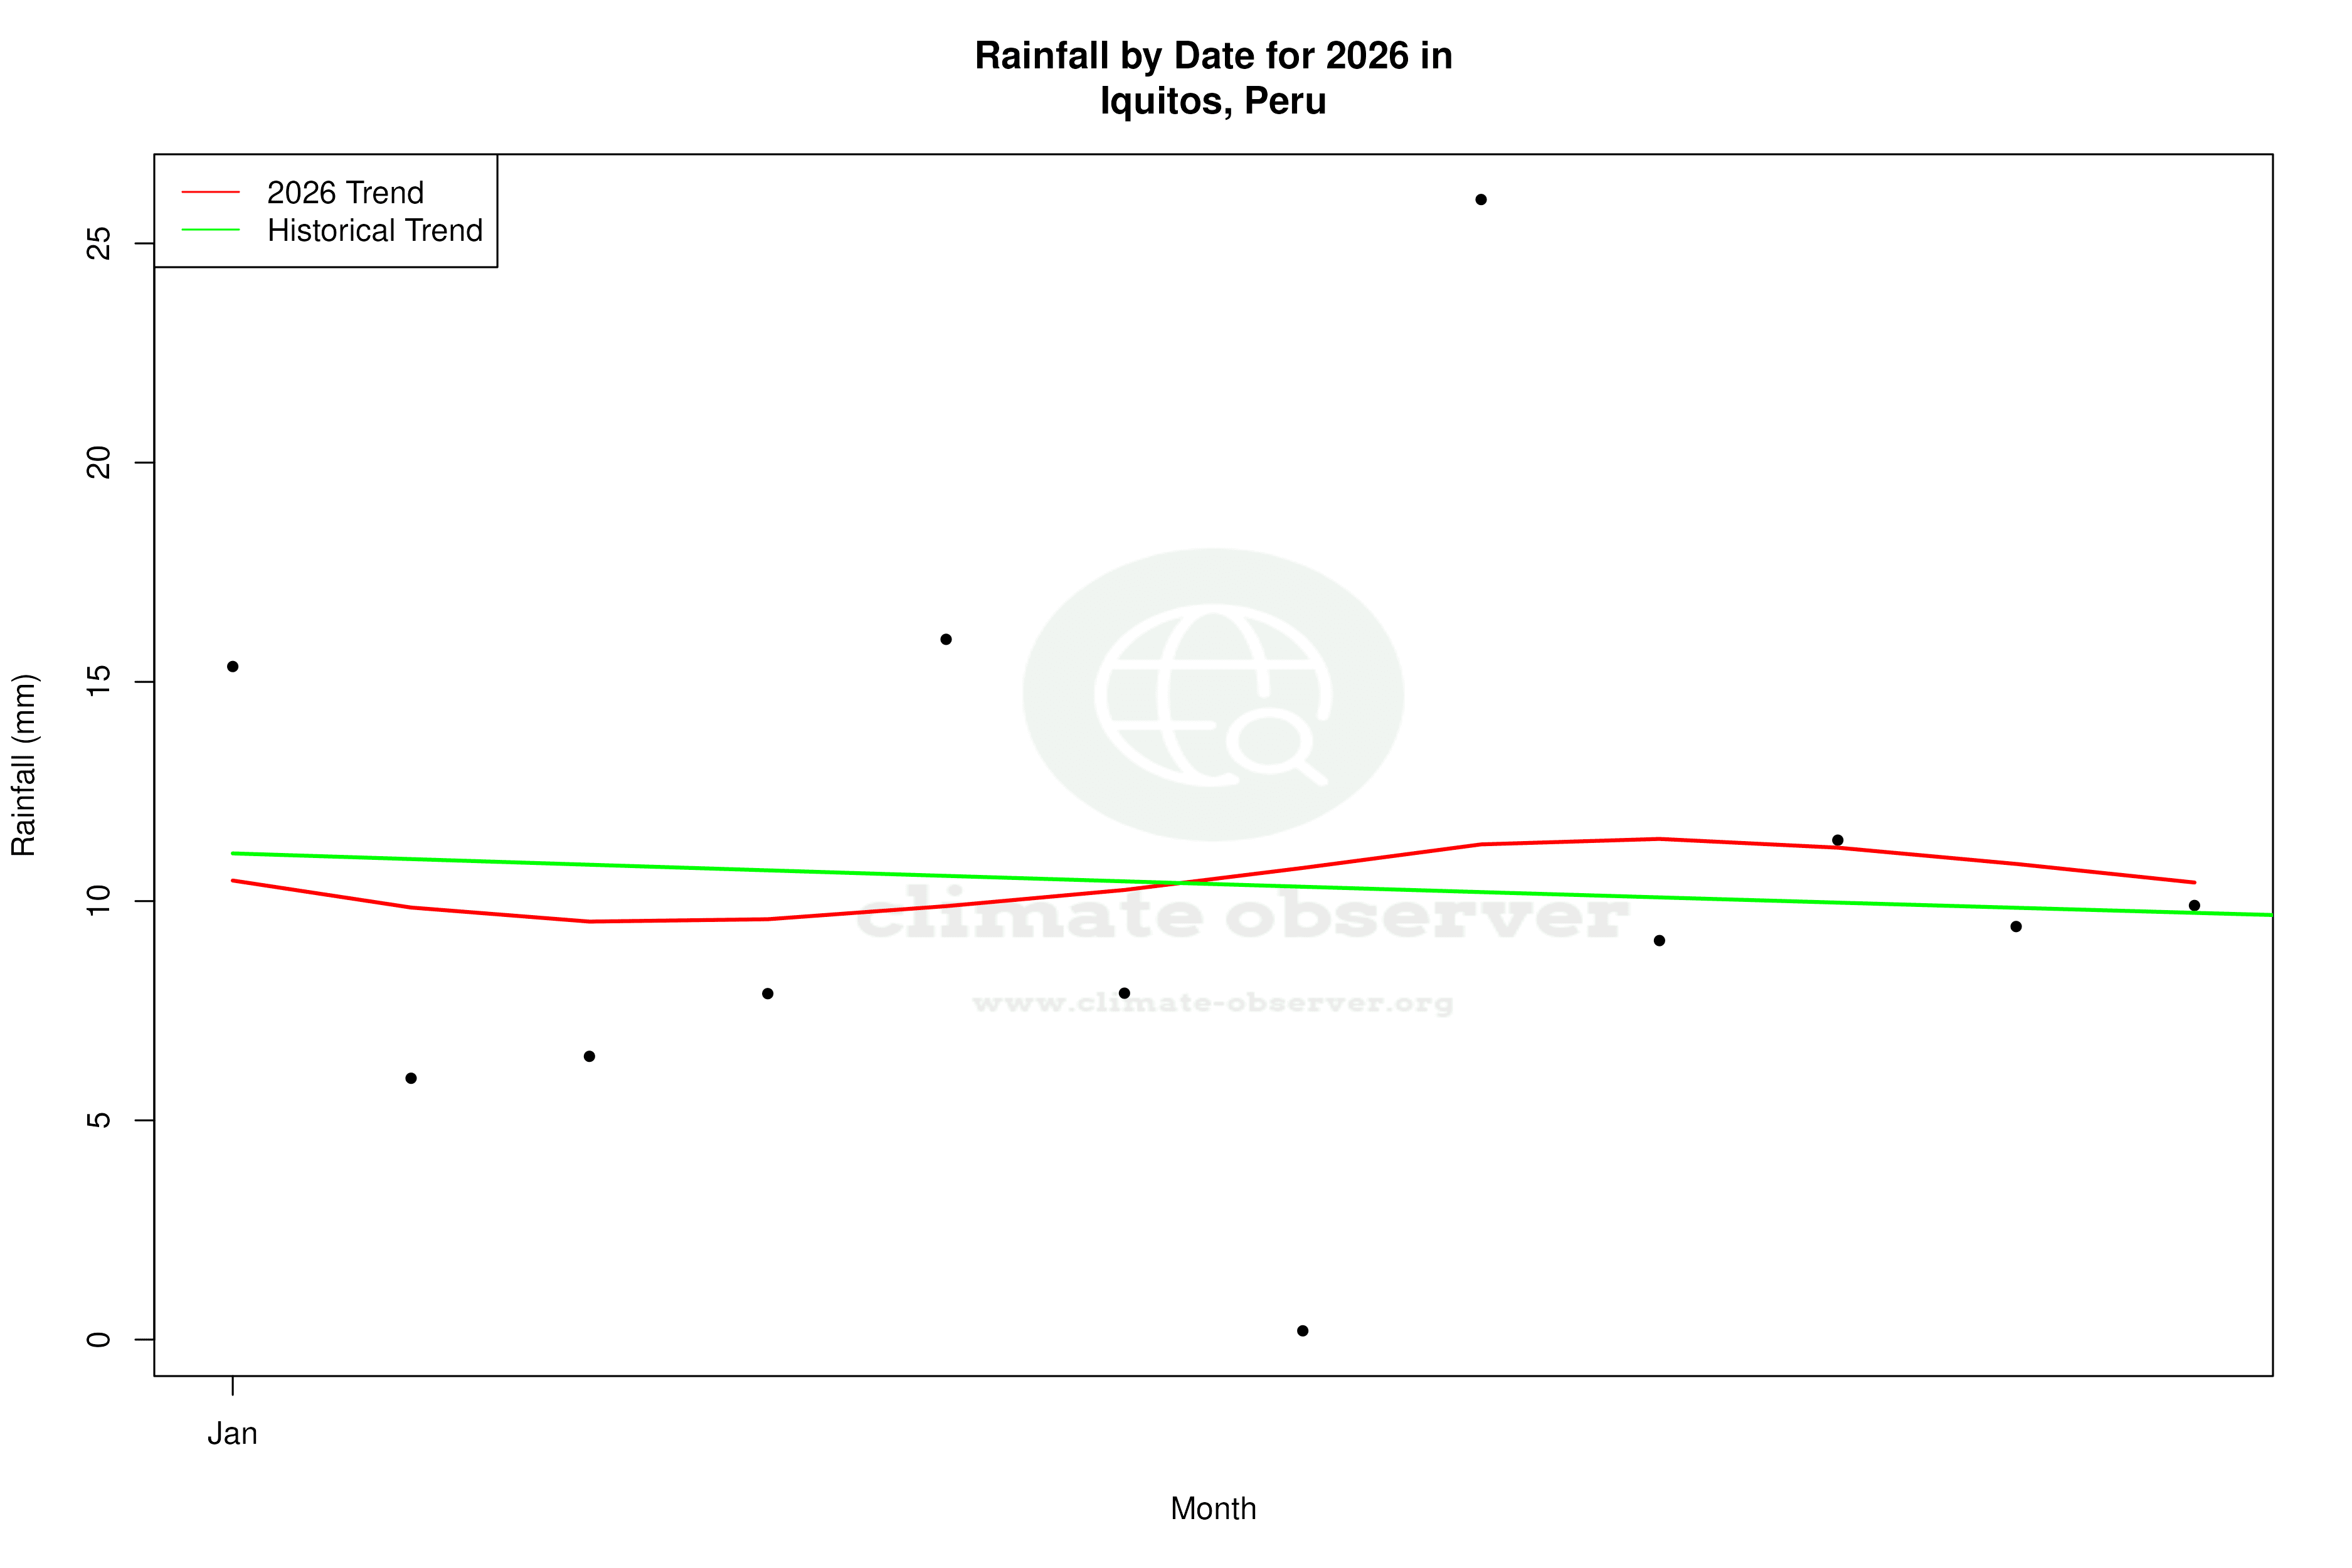
Precipitation Patterns: A More Even Distribution
The Precipitation Concentration Index (PCI) for Iquitos has shifted from a baseline of 10.92 to a current value of 8.89. This decrease indicates that rainfall is now more evenly distributed throughout the year. A lower PCI suggests fewer intense rainfall events, which can be beneficial for reducing flood risks and supporting the region's rich biodiversity. This change aligns with Peru's regional climate goals to manage water resources more effectively and adapt to changing precipitation patterns.
Record Extremes: A Climate of Contrasts
Iquitos has recorded extreme temperatures with a maximum of 42.2°C (108.0°F) and a minimum of 15.5°C (59.9°F). These records highlight the potential for significant temperature fluctuations, despite the overall stable climate typical of equatorial regions. Such extremes can pose challenges for local ecosystems and communities, necessitating adaptive strategies to mitigate potential impacts.
Regional Climate Context
Peru is actively engaged in addressing climate change, with a focus on sustainable development and conservation of its vast natural resources. Recent weather events, such as increased rainfall variability and temperature extremes, underscore the importance of ongoing climate monitoring and adaptation efforts. Iquitos, as a key location within the Amazon, plays a pivotal role in these national and regional climate strategies.
Station Statistics
10-Year Trend
High: -1.44 °C/decade
Low: +0.03 °C/decade
Rain: -0.55 mm/decade
25-Year Trend
High: -0.29 °C/decade
Low: +0.31 °C/decade
Rain: -1.19 mm/decade
50-Year Trend
High: +0.11 °C/decade
Low: +0.15 °C/decade
Rain: +0.09 mm/decade
All-Time Trend
High: +0.11 °C/decade
Low: +0.15 °C/decade
Rain: +0.09 mm/decade
Percentage Above-Average Days
Last 12 Months: 31.2%
This Year: 5.0%
Precipitation Concentration Index (PCI) ℹ️
Last 12 Months: 8.8
Historical Average: 11.2
Percentile Rank of Last 12 Months ℹ️
High: 13th percentile
Low: 91st percentile
Rain: 44th percentile
Change in Variance ℹ️
High: -12.4%
Low: -7.1%
Intraday: -1.4%
Data Coverage
96.7%
First Year of Data
1973
Station Location
Historical Weather Records
| Max High | Avg High | Min High | Max Avg | Avg Avg | Min Avg | Max Low | Avg Low | Min Low | Max Precipitation | Avg Precipitation | Max Snow | Avg Snow | |
|---|---|---|---|---|---|---|---|---|---|---|---|---|---|
| Record | 41.1 °C | — | 22.0 °C | 32.2 °C | — | 18.2 °C | 25.8 °C | — | 13.7 °C | 400.1 mm | — | — | — |
| January | 38.5 °C | 31.9 °C | 24.2 °C | 32.2 °C | 26.1 °C | 22.7 °C | 25.8 °C | 22.5 °C | 18.2 °C | 257.0 mm | 9.4 mm | — | — |
| February | 37.0 °C | 31.8 °C | 25.0 °C | 30.3 °C | 26.1 °C | 22.5 °C | 25.8 °C | 22.5 °C | 18.0 °C | 400.1 mm | 9.4 mm | — | — |
| March | 38.0 °C | 31.6 °C | 24.8 °C | 30.5 °C | 26.1 °C | 22.6 °C | 25.3 °C | 22.6 °C | 18.0 °C | 326.9 mm | 10.4 mm | — | — |
| April | 36.2 °C | 31.6 °C | 25.0 °C | 31.3 °C | 26.0 °C | 21.3 °C | 25.4 °C | 22.5 °C | 17.8 °C | 220.0 mm | 11.0 mm | — | — |
| May | 39.0 °C | 31.2 °C | 23.0 °C | 30.8 °C | 25.8 °C | 21.1 °C | 25.0 °C | 22.3 °C | 17.5 °C | 158.0 mm | 8.2 mm | — | — |
| June | 35.2 °C | 30.8 °C | 22.9 °C | 30.4 °C | 25.4 °C | 19.6 °C | 24.6 °C | 21.7 °C | 15.5 °C | 208.4 mm | 6.9 mm | — | — |
| July | 37.8 °C | 31.0 °C | 22.0 °C | 29.3 °C | 25.1 °C | 18.2 °C | 24.2 °C | 21.2 °C | 13.7 °C | 370.1 mm | 5.8 mm | — | — |
| August | 41.1 °C | 32.0 °C | 22.7 °C | 31.8 °C | 25.7 °C | 19.1 °C | 24.3 °C | 21.4 °C | 15.0 °C | 278.9 mm | 6.3 mm | — | — |
| September | 38.4 °C | 32.8 °C | 25.0 °C | 31.3 °C | 26.1 °C | 19.3 °C | 24.9 °C | 21.8 °C | 16.0 °C | 125.0 mm | 6.3 mm | — | — |
| October | 37.8 °C | 32.6 °C | 24.6 °C | 31.8 °C | 26.3 °C | 22.1 °C | 24.9 °C | 22.2 °C | 17.0 °C | 180.1 mm | 7.8 mm | — | — |
| November | 37.4 °C | 32.3 °C | 25.0 °C | 31.2 °C | 26.2 °C | 20.5 °C | 25.0 °C | 22.5 °C | 17.0 °C | 270.0 mm | 9.3 mm | — | — |
| December | 36.5 °C | 31.9 °C | 24.0 °C | 29.6 °C | 26.1 °C | 23.0 °C | 25.0 °C | 22.5 °C | 18.3 °C | 300.0 mm | 9.1 mm | — | — |
Data Visualisations
Remove WatermarksCurrent Year Climate Trends vs Historical


Max Temperature this Year | 1 of 6
Climate 12-Month Moving Averages


Max Temperature 12-Month MA | 1 of 6
Daily Data Points and Averages Throughout the Year


Average Max Temperature Throughout Year | 1 of 5
