Climate for Station: Capitan Montes, Piura, Peru
Loading live weather...
Climate Analysis & Overview
The climate profile of Capitan Montes reveals a cooling trend over the past decade, with significant reductions in both high and low temperatures. The Precipitation Concentration Index (PCI) indicates a slight increase in the concentration of rainfall events, suggesting changes in precipitation patterns.
Local Climate Dynamics
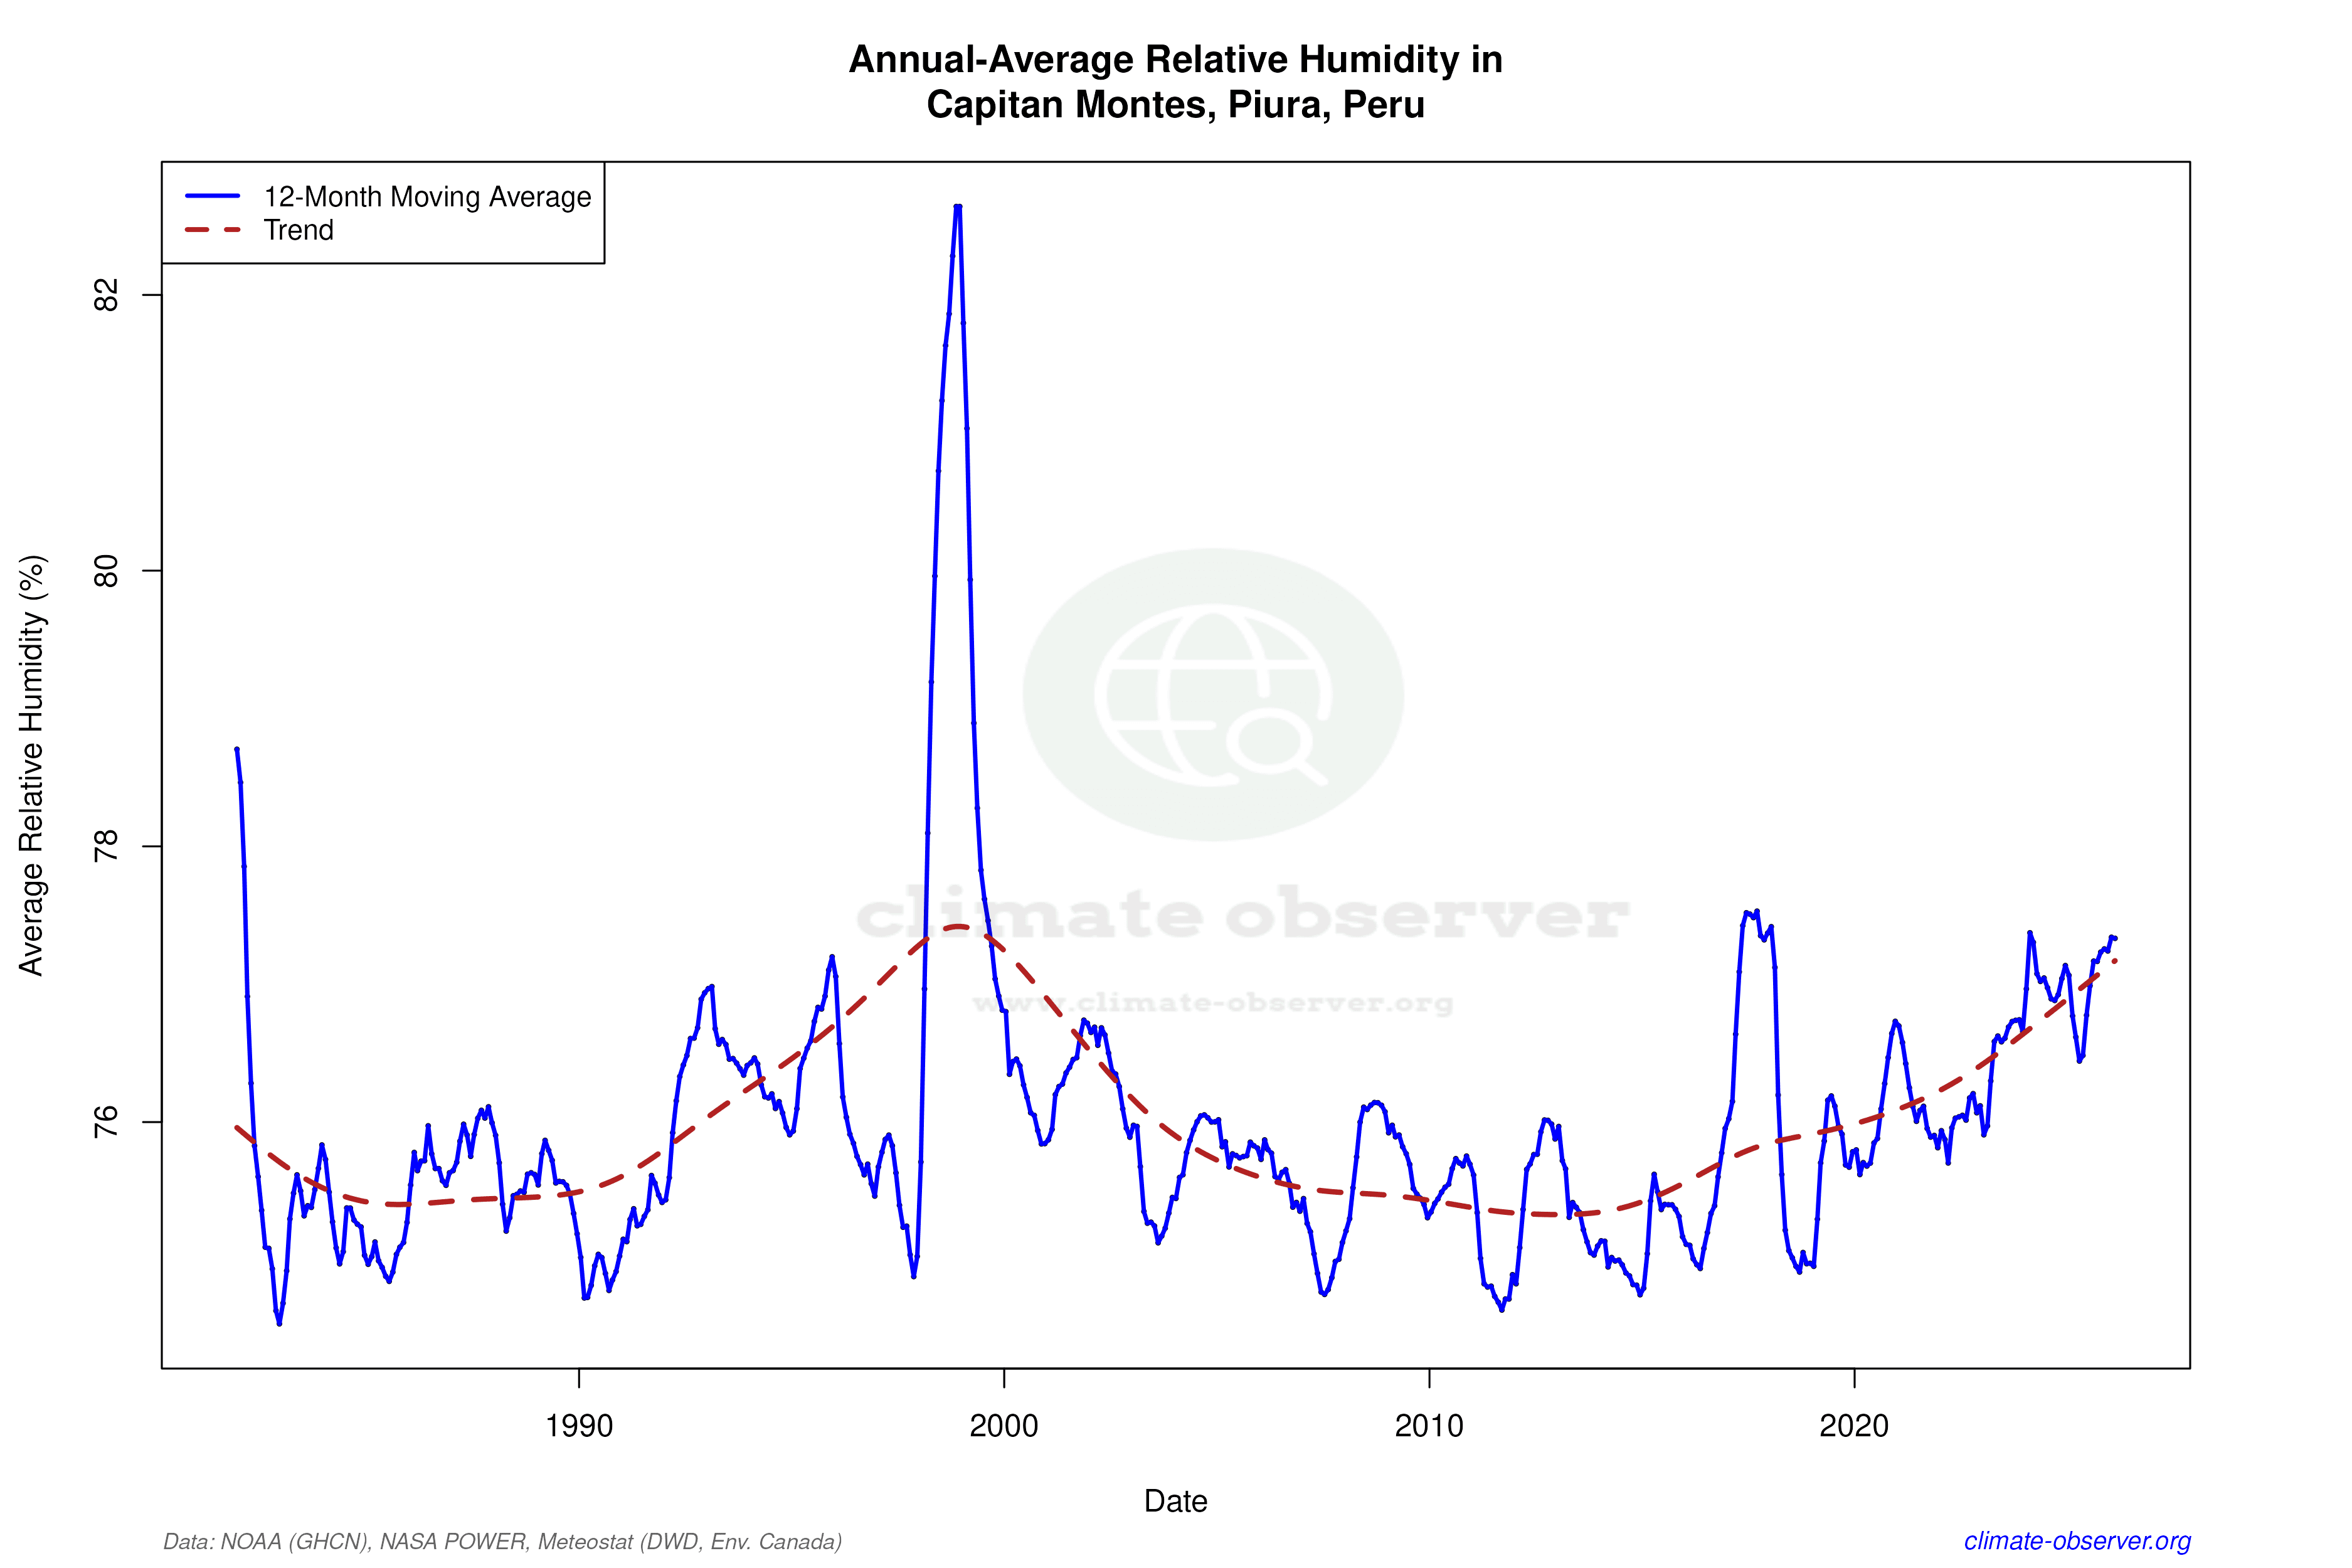
Capitan Montes, located at -4.577, -81.254, is situated in the Piura region of northern Peru, near the Pacific coastline. This area is characterised by a BWh climate under the Köppen classification, which denotes a hot desert climate. The proximity to the ocean influences its weather patterns, often moderating extreme temperatures but also contributing to humidity levels that can affect local climate dynamics.
Decadal Cooling Trends
Over the past ten years, Capitan Montes has experienced a noticeable cooling trend. High temperatures have decreased by 1.01°C (1.82°F), while low temperatures have fallen even more sharply by 2.20°C (3.96°F). This cooling trend is significant within the context of global climate patterns, which often show warming. The reasons behind this localised cooling could be attributed to regional atmospheric changes or oceanic influences, which merit further investigation.
Long-term Thermal Stability
When examining all-time trends, the data shows a minimal cooling of high temperatures by 0.00°C (0.00°F) and a more discernible decrease in low temperatures by 0.03°C (0.05°F). This long-term stability, especially in high temperatures, contrasts with the more pronounced recent decade trends, indicating that while short-term fluctuations are evident, the overall thermal profile remains relatively stable over the longer term.
Precipitation Patterns and PCI Analysis
The Precipitation Concentration Index (PCI) for Capitan Montes has shown a slight increase from a baseline of 31.3 to a current value of 33.0. This suggests that rainfall events are becoming more concentrated, occurring in fewer, more intense episodes. A PCI above 20 indicates a high concentration, and the current value supports this, pointing to potential challenges in water management and agriculture due to less frequent but more intense rainfall events.
Temperature Extremes and Records
The station has recorded an absolute maximum temperature of 38.2°C (100.8°F) and a minimum of 7.5°C (45.5°F). These extremes highlight the range of temperatures that can occur in this desert climate, influenced by both the coastal proximity and the broader climatic patterns of the region. Understanding these extremes is crucial for planning and adaptation strategies, particularly in light of Peru's regional climate goals, which aim to enhance resilience to such variability.
Station Statistics
10-Year Trend
High: -1.01 °C/decade
Low: -2.20 °C/decade
Rain: -0.07 mm/decade
25-Year Trend
High: -0.10 °C/decade
Low: -0.47 °C/decade
Rain: +0.07 mm/decade
50-Year Trend
High: -0.01 °C/decade
Low: -0.04 °C/decade
Rain: +0.01 mm/decade
All-Time Trend
High: -0.00 °C/decade
Low: -0.03 °C/decade
Rain: +0.02 mm/decade
Percentage Above-Average Days
Last 12 Months: 32.9%
This Year: 15.8%
Precipitation Concentration Index (PCI) ℹ️
Last 12 Months: 21.5
Historical Average: 38.5
Percentile Rank of Last 12 Months ℹ️
High: 9th percentile
Low: 24th percentile
Rain: 63rd percentile
Change in Variance ℹ️
High: -5.3%
Low: +8.9%
Intraday: +37.4%
Data Coverage
64.4%
First Year of Data
1942
Station Location
Historical Weather Records
| Max High | Avg High | Min High | Max Avg | Avg Avg | Min Avg | Max Low | Avg Low | Min Low | Max Precipitation | Avg Precipitation | Max Snow | Avg Snow | |
|---|---|---|---|---|---|---|---|---|---|---|---|---|---|
| Record | 37.0 °C | — | 21.0 °C | 33.6 °C | — | 15.2 °C | 26.1 °C | — | 7.5 °C | 257.0 mm | — | — | — |
| January | 37.0 °C | 30.0 °C | 25.6 °C | 30.9 °C | 25.5 °C | 20.3 °C | 25.7 °C | 21.1 °C | 13.5 °C | 47.1 mm | 0.4 mm | — | — |
| February | 37.0 °C | 31.0 °C | 26.3 °C | 32.6 °C | 26.7 °C | 22.3 °C | 26.0 °C | 22.5 °C | 17.1 °C | 70.3 mm | 1.3 mm | — | — |
| March | 35.6 °C | 31.2 °C | 26.1 °C | 33.6 °C | 26.7 °C | 22.2 °C | 26.1 °C | 22.6 °C | 16.6 °C | 257.0 mm | 1.5 mm | — | — |
| April | 35.0 °C | 30.7 °C | 24.9 °C | 32.7 °C | 25.9 °C | 21.0 °C | 25.6 °C | 21.4 °C | 14.0 °C | 30.0 mm | 0.6 mm | — | — |
| May | 33.2 °C | 28.9 °C | 23.9 °C | 32.1 °C | 24.0 °C | 19.1 °C | 25.8 °C | 19.9 °C | 12.5 °C | 8.5 mm | 0.1 mm | — | — |
| June | 33.0 °C | 27.2 °C | 22.0 °C | 29.9 °C | 22.3 °C | 18.0 °C | 25.3 °C | 18.5 °C | 11.0 °C | 3.0 mm | 0.0 mm | — | — |
| July | 35.0 °C | 26.2 °C | 21.0 °C | 28.4 °C | 21.2 °C | 16.9 °C | 24.0 °C | 17.5 °C | 10.7 °C | 13.9 mm | 0.0 mm | — | — |
| August | 34.0 °C | 25.8 °C | 21.0 °C | 26.9 °C | 20.7 °C | 16.7 °C | 22.0 °C | 16.8 °C | 7.5 °C | 8.8 mm | 0.0 mm | — | — |
| September | 33.0 °C | 25.9 °C | 21.4 °C | 27.2 °C | 20.7 °C | 16.9 °C | 22.0 °C | 16.8 °C | 12.0 °C | 3.0 mm | 0.0 mm | — | — |
| October | 31.0 °C | 26.1 °C | 21.6 °C | 27.9 °C | 21.1 °C | 16.1 °C | 21.9 °C | 17.2 °C | 11.0 °C | 9.9 mm | 0.0 mm | — | — |
| November | 32.7 °C | 26.8 °C | 22.0 °C | 28.2 °C | 22.0 °C | 15.2 °C | 23.5 °C | 17.9 °C | 11.8 °C | 9.9 mm | 0.0 mm | — | — |
| December | 34.0 °C | 28.4 °C | 22.2 °C | 29.7 °C | 23.6 °C | 18.6 °C | 25.0 °C | 19.4 °C | 12.0 °C | 20.6 mm | 0.1 mm | — | — |
Data Visualisations
Remove WatermarksCurrent Year Climate Trends vs Historical


Max Temperature this Year | 1 of 6
Climate 12-Month Moving Averages


Max Temperature 12-Month MA | 1 of 6
Daily Data Points and Averages Throughout the Year


Average Max Temperature Throughout Year | 1 of 5
