Climate for Station: Jinnah Intl, Sindh, Pakistan
Loading live weather...
Climate Analysis & Overview
Jinnah International Airport in Karachi shows a complex climate profile characterised by a 1.11°C (2.00°F) rise in high temperatures over the past decade, contrasting with a slower all-time warming of 0.14°C (0.25°F). Meanwhile, precipitation is becoming more evenly distributed, reflecting a significant change in local weather patterns.
Desert Climate Dynamics
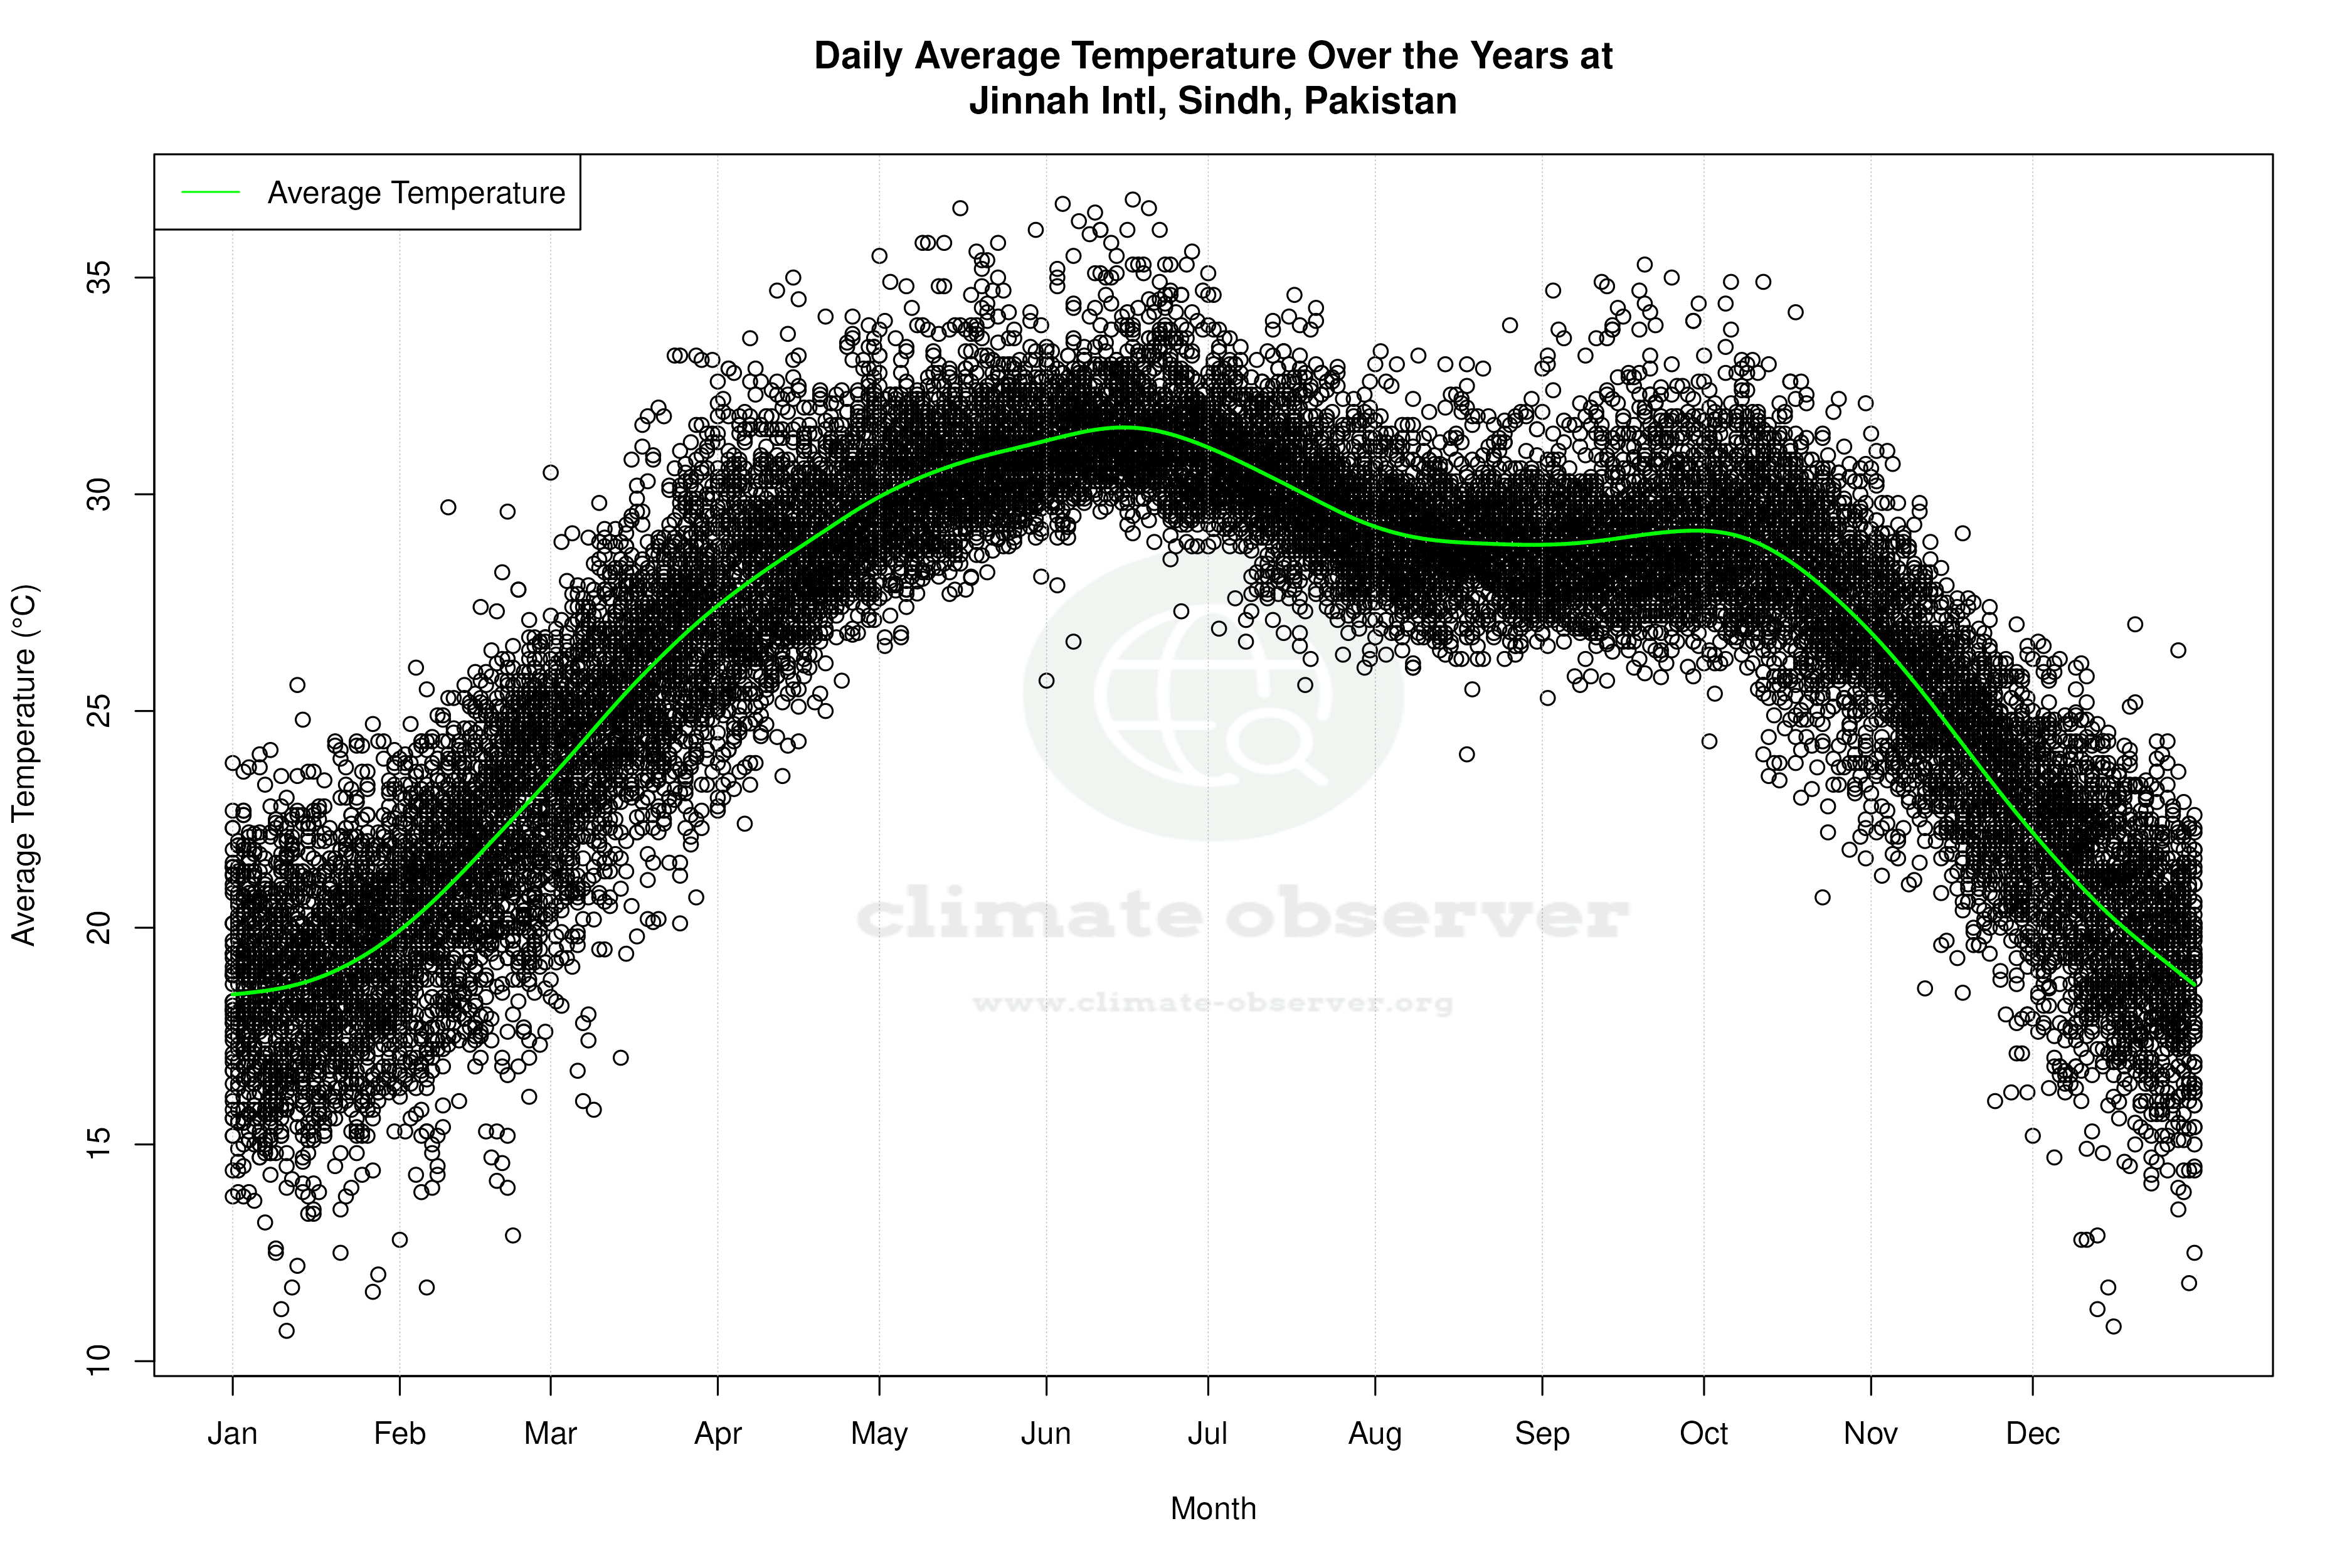
Jinnah International Airport, located in Karachi, Pakistan, lies within a hot desert climate zone according to the Köppen classification. The city's proximity to the Arabian Sea moderates its temperatures slightly, but the region still experiences extreme heat. Over the last decade, the airport has recorded a notable increase in high temperatures, with a 1.11°C (2.00°F) rise. This short-term trend suggests a more rapid warming compared to the all-time trend, which shows a more modest increase of 0.14°C (0.25°F). This disparity highlights the potential influence of recent global warming trends on the region.
Night-time Temperature Stability
Night-time temperatures at Jinnah International have shown remarkable stability over the last decade, with a minimal increase of 0.02°C (0.04°F). This contrasts with the all-time trend, where lows have risen by 0.33°C (0.59°F). The slower rise in night-time temperatures may indicate that while daytime heat is increasing, the cooling effect of the sea breeze at night remains relatively constant.
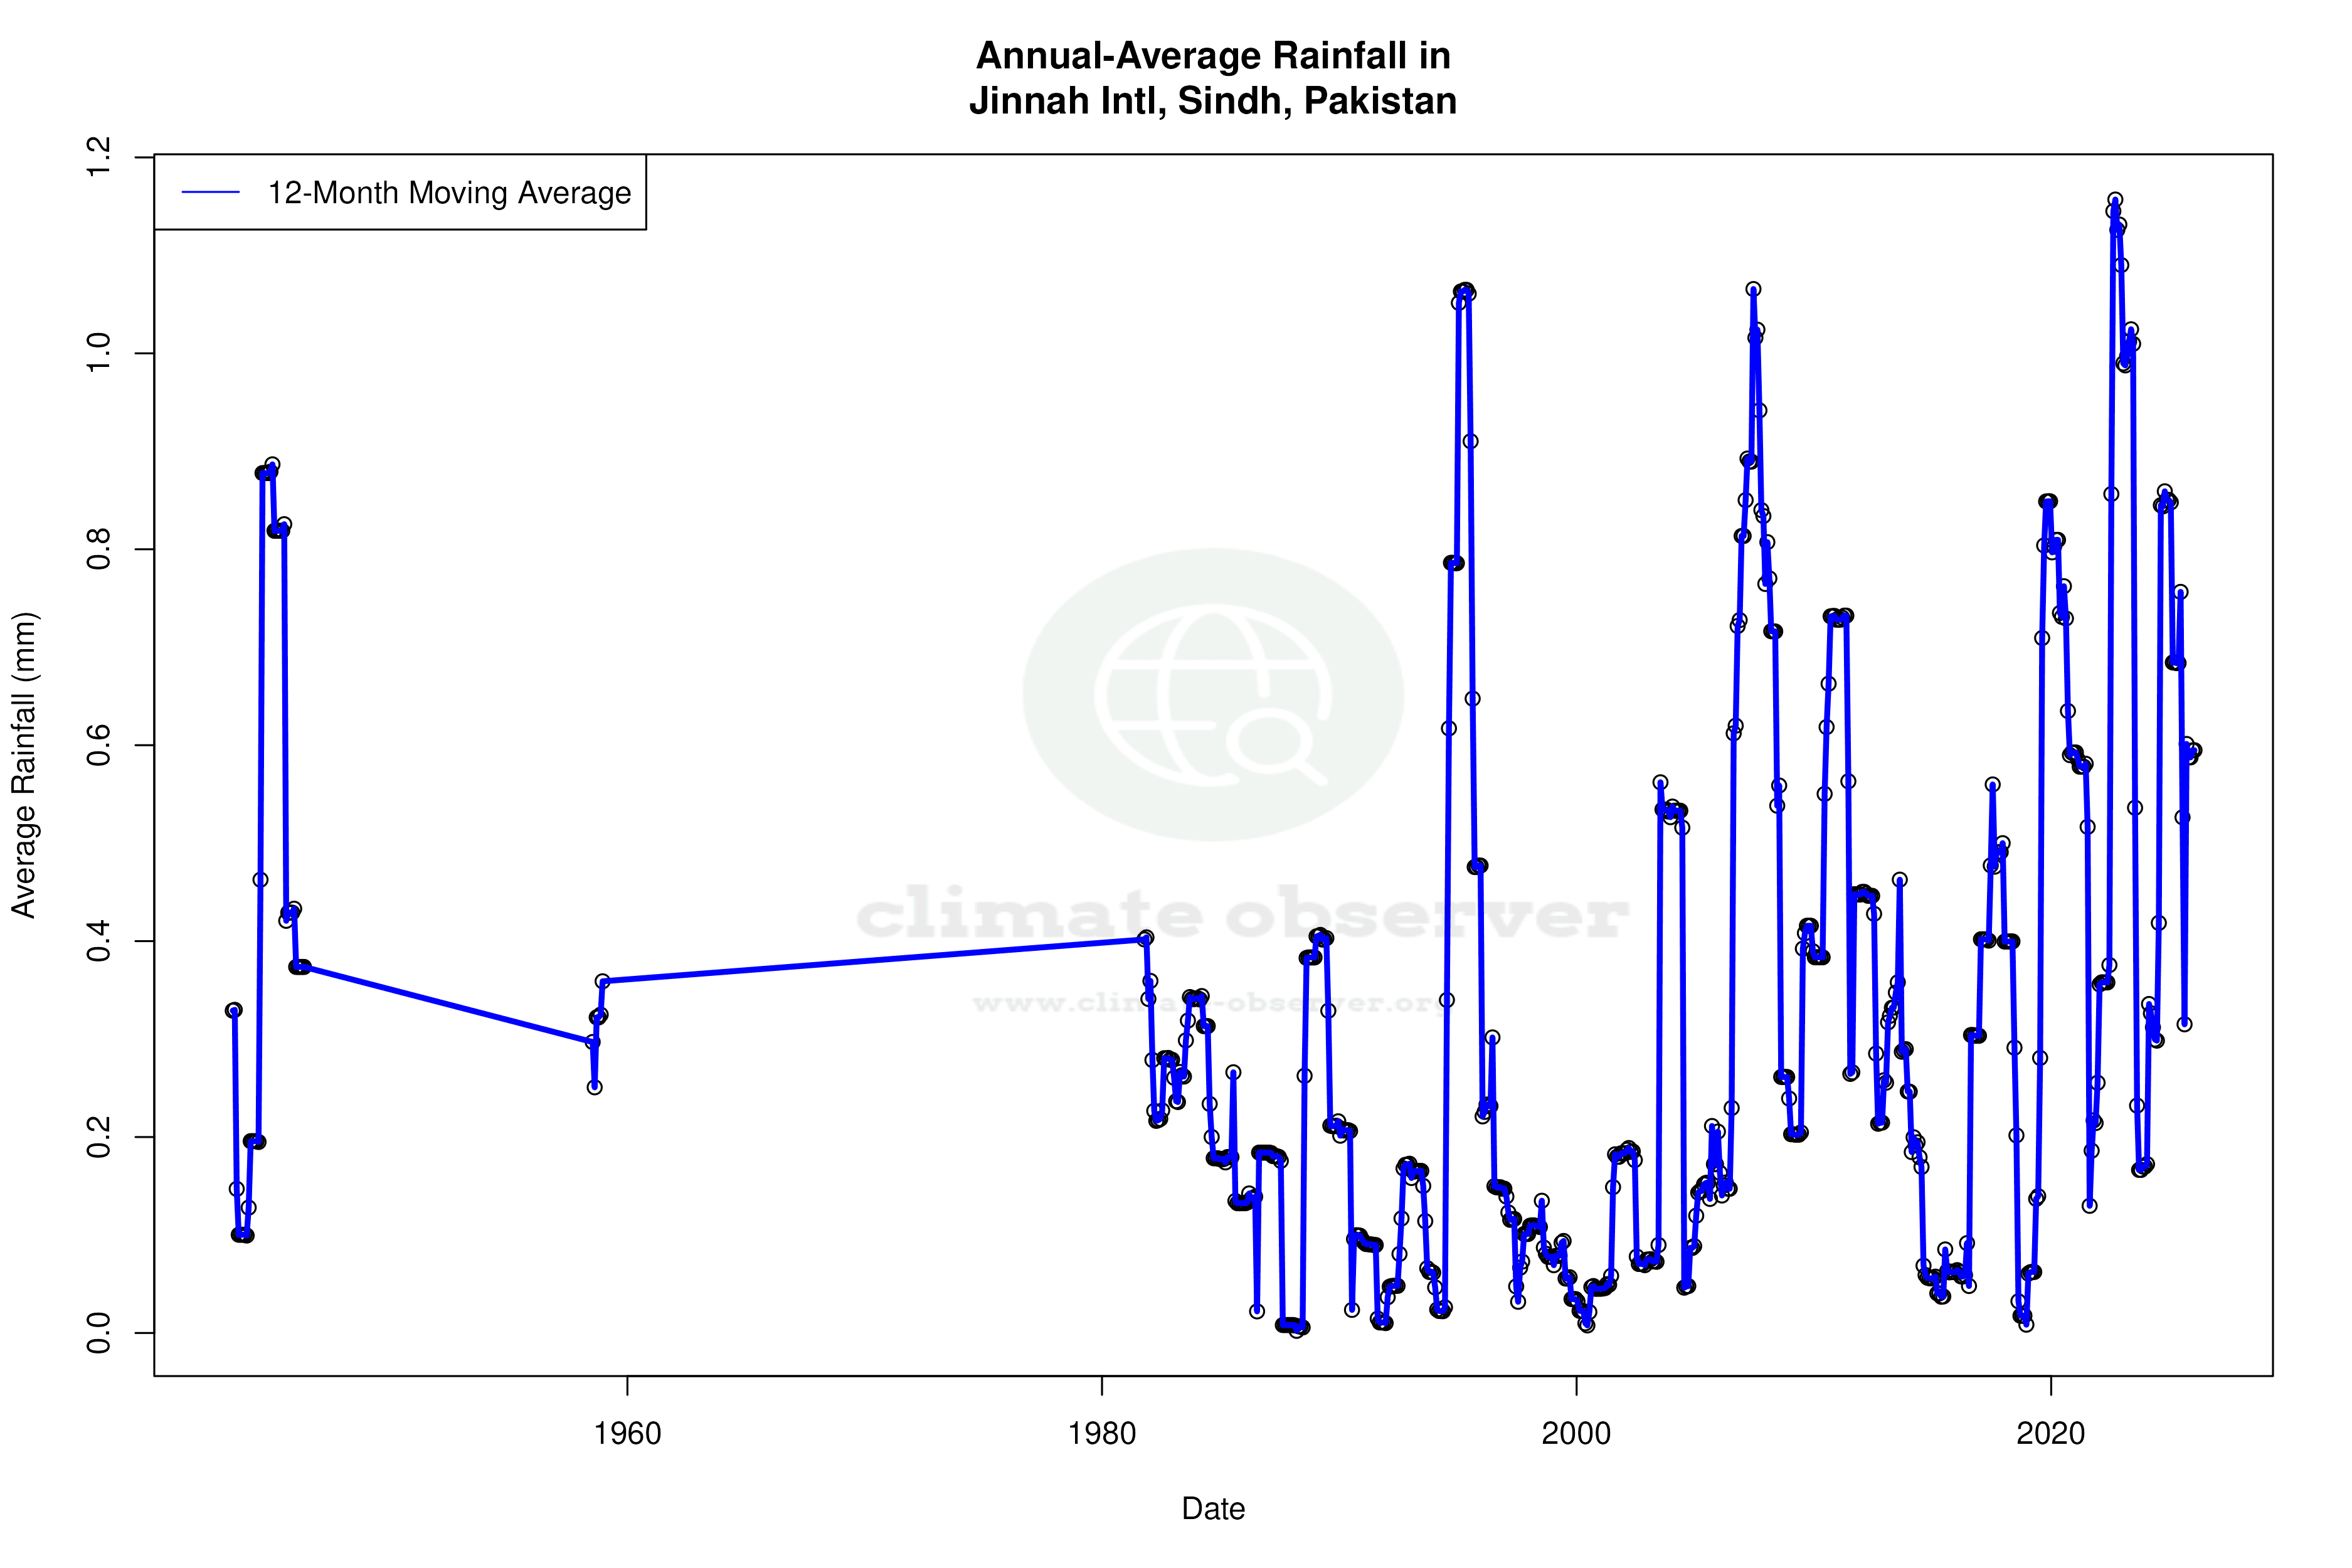
Precipitation Patterns Evolving
The Precipitation Concentration Index (PCI) at Jinnah International has decreased from a baseline of 38.95 to a current value of 29.55. This significant reduction indicates that rainfall is becoming more evenly distributed throughout the year, rather than being concentrated in a few heavy downpours. Such a shift can have profound implications for water management and agriculture in the region, as more consistent precipitation could improve water availability and reduce the risk of flooding.
Record Extremes
Karachi's climate is marked by extreme temperature records, with a maximum of 46.0°C (114.8°F) and a minimum of 0.0°C (32.0°F). These records underscore the city's vulnerability to temperature extremes, which can impact infrastructure, health, and energy demand. The high record is particularly concerning given the ongoing warming trends.
Regional Climate Goals and Challenges
Pakistan has been actively pursuing regional climate goals, focusing on reducing emissions and enhancing resilience to climate impacts. The trends observed at Jinnah International Airport, particularly the rapid warming of daytime temperatures and changes in precipitation distribution, align with broader regional challenges. These include managing urban heat and ensuring sustainable water resources in the face of climate change.
Station Statistics
10-Year Trend
High: +1.09 °C/decade
Low: +0.05 °C/decade
Rain: +0.42 mm/decade
25-Year Trend
High: +0.17 °C/decade
Low: +0.21 °C/decade
Rain: +0.12 mm/decade
50-Year Trend
High: +0.28 °C/decade
Low: +0.43 °C/decade
Rain: +0.08 mm/decade
All-Time Trend
High: +0.14 °C/decade
Low: +0.33 °C/decade
Rain: +0.02 mm/decade
Percentage Above-Average Days
Last 12 Months: 59.2%
This Year: 42.5%
Precipitation Concentration Index (PCI) ℹ️
Last 12 Months: 36.1
Historical Average: 46.2
Percentile Rank of Last 12 Months ℹ️
High: 99th percentile
Low: 92nd percentile
Rain: 83rd percentile
Change in Variance ℹ️
High: +9.2%
Low: +11.6%
Intraday: -2.6%
Data Coverage
66.7%
First Year of Data
1942
Station Location
Historical Weather Records
| Max High | Avg High | Min High | Max Avg | Avg Avg | Min Avg | Max Low | Avg Low | Min Low | Max Precipitation | Avg Precipitation | Max Snow | Avg Snow | |
|---|---|---|---|---|---|---|---|---|---|---|---|---|---|
| Record | 46.0 °C | — | 15.8 °C | 36.8 °C | — | 10.7 °C | 34.0 °C | — | 0.0 °C | 95.7 mm | — | — | — |
| January | 32.3 °C | 25.7 °C | 15.8 °C | 25.6 °C | 18.9 °C | 10.7 °C | 21.0 °C | 12.5 °C | 0.0 °C | 95.7 mm | 0.2 mm | — | — |
| February | 37.4 °C | 28.3 °C | 16.5 °C | 29.7 °C | 21.6 °C | 11.7 °C | 23.0 °C | 14.9 °C | 3.8 °C | 38.2 mm | 0.2 mm | — | — |
| March | 42.2 °C | 32.0 °C | 21.8 °C | 33.2 °C | 25.5 °C | 15.8 °C | 26.5 °C | 19.2 °C | 9.6 °C | 15.3 mm | 0.0 mm | — | — |
| April | 46.0 °C | 34.6 °C | 25.6 °C | 35.0 °C | 28.7 °C | 22.4 °C | 29.4 °C | 23.4 °C | 13.5 °C | 17.0 mm | 0.0 mm | — | — |
| May | 45.8 °C | 35.5 °C | 29.5 °C | 36.6 °C | 30.7 °C | 26.5 °C | 33.0 °C | 26.7 °C | 19.0 °C | 23.0 mm | 0.0 mm | — | — |
| June | 45.4 °C | 35.2 °C | 28.3 °C | 36.8 °C | 31.4 °C | 25.7 °C | 34.0 °C | 28.4 °C | 22.5 °C | 59.2 mm | 0.2 mm | — | — |
| July | 42.0 °C | 33.4 °C | 26.6 °C | 35.1 °C | 30.2 °C | 25.6 °C | 32.0 °C | 27.8 °C | 21.1 °C | 74.2 mm | 1.4 mm | — | — |
| August | 39.5 °C | 32.0 °C | 26.0 °C | 33.9 °C | 28.9 °C | 24.0 °C | 31.1 °C | 26.6 °C | 22.0 °C | 92.1 mm | 1.4 mm | — | — |
| September | 42.1 °C | 32.9 °C | 27.0 °C | 35.3 °C | 29.0 °C | 25.3 °C | 31.0 °C | 25.8 °C | 20.0 °C | 36.7 mm | 0.4 mm | — | — |
| October | 42.0 °C | 34.8 °C | 25.2 °C | 34.9 °C | 28.4 °C | 20.7 °C | 29.0 °C | 22.5 °C | 11.8 °C | 23.9 mm | 0.1 mm | — | — |
| November | 39.1 °C | 32.0 °C | 23.1 °C | 31.4 °C | 24.6 °C | 16.0 °C | 27.0 °C | 18.0 °C | 8.9 °C | 4.1 mm | 0.0 mm | — | — |
| December | 35.5 °C | 27.7 °C | 17.0 °C | 27.0 °C | 20.3 °C | 10.8 °C | 22.0 °C | 13.9 °C | 2.7 °C | 37.0 mm | 0.1 mm | — | — |
Data Visualisations
Remove WatermarksCurrent Year Climate Trends vs Historical


Max Temperature this Year | 1 of 6
Climate 12-Month Moving Averages


Max Temperature 12-Month MA | 1 of 6
Daily Data Points and Averages Throughout the Year


Average Max Temperature Throughout Year | 1 of 5
