Climate for Station: Siedlce, Mazovian, Poland
Loading live weather...
Climate Analysis & Overview
Siedlce is experiencing a notable warming trend, with a 1.07°C (1.93°F) increase in high temperatures over the past decade, outpacing the all-time rise of 0.42°C (0.76°F). Meanwhile, precipitation is becoming more evenly distributed, as indicated by a decrease in the Precipitation Concentration Index from 11.73 to 9.84.
Continental Climate Dynamics
Siedlce, located in the Masovian Voivodeship of Poland, falls under the humid continental climate classification (Dfb). This climate type is characterised by significant seasonal temperature variations, with cold winters and warm summers. The region's flat terrain, with no significant geographical barriers like mountains or large bodies of water, allows for these pronounced temperature swings. Over the past decade, Siedlce has experienced a warming trend, with high temperatures increasing by 1.07°C (1.93°F) and lows by 0.79°C (1.42°F). This recent trend is more pronounced than the all-time warming of 0.42°C (0.76°F) for highs and 0.27°C (0.49°F) for lows, suggesting an acceleration in warming over the last ten years.
Temperature Extremes and Records
The temperature records for Siedlce highlight its climatic extremes. The highest recorded temperature is 35.5°C (95.9°F), while the lowest is -33.3°C (-27.9°F). These extremes underscore the region's susceptibility to both heatwaves and cold snaps, typical of a continental climate. The recent warming trends may influence the frequency and intensity of such extreme weather events, potentially impacting local agriculture and energy consumption patterns.
Precipitation Patterns and Distribution
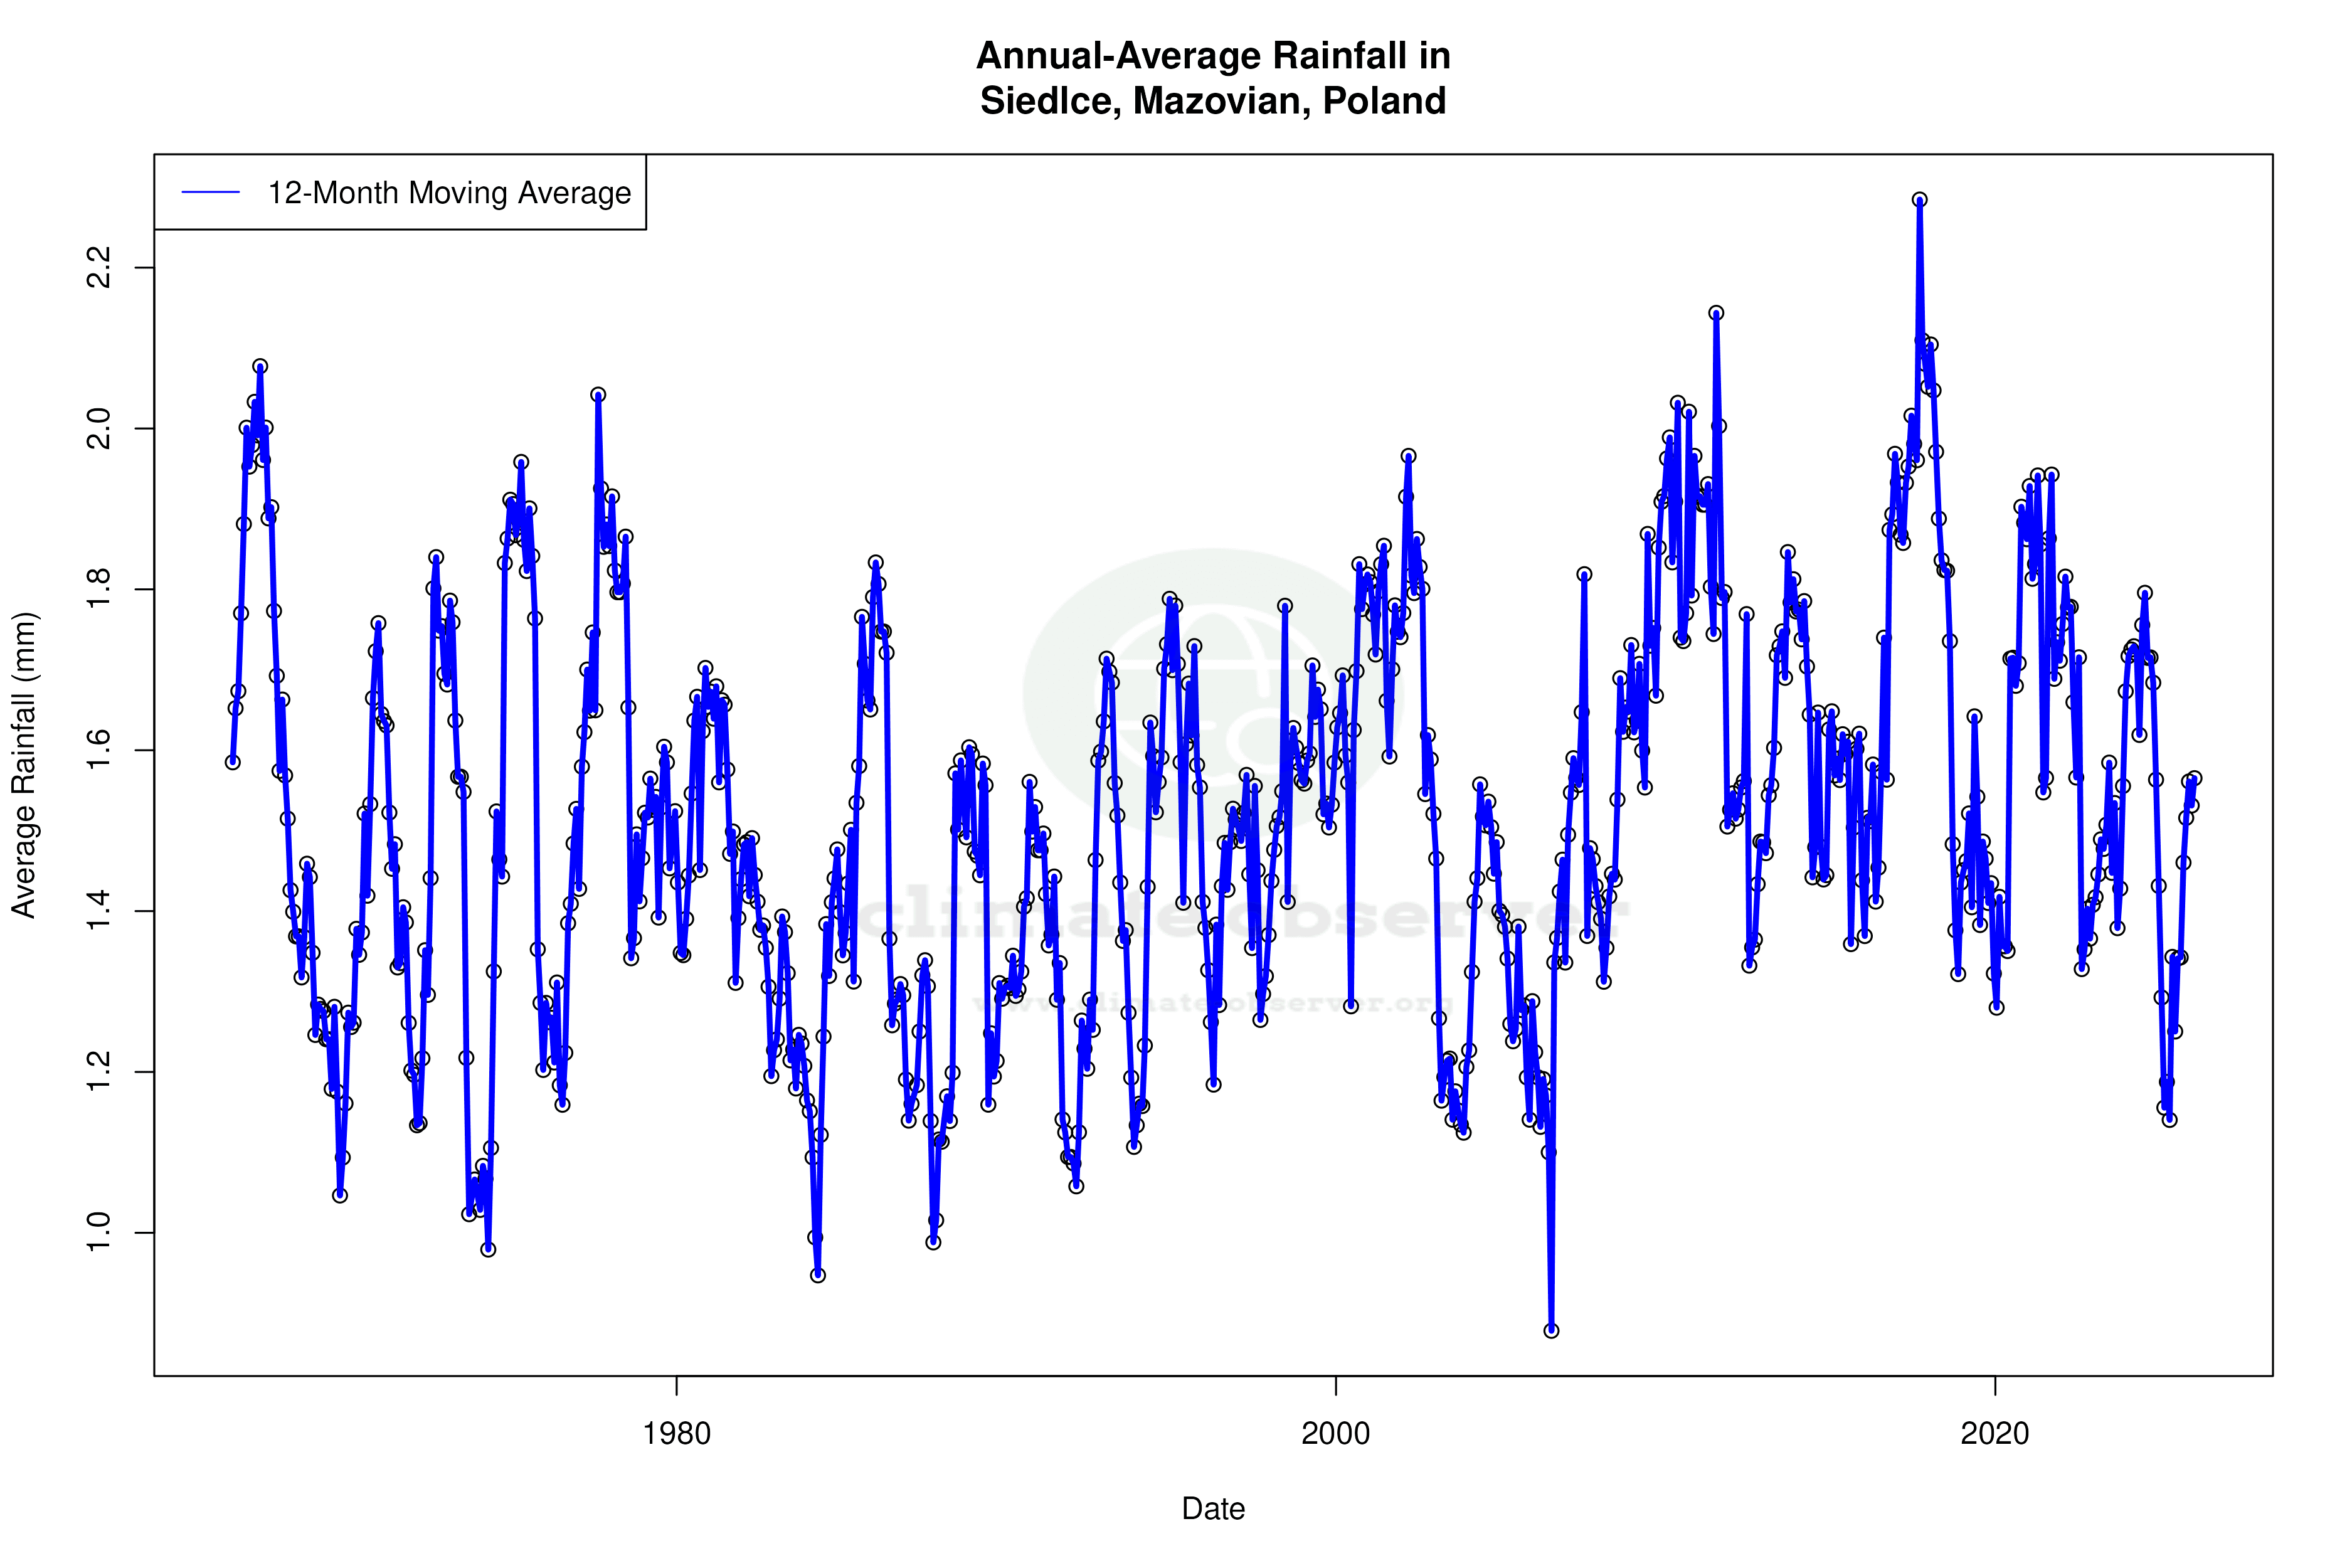
The Precipitation Concentration Index (PCI) provides insight into rainfall distribution. A decrease from 11.73 to 9.84 suggests that precipitation in Siedlce is becoming more evenly distributed throughout the year. This shift towards a more balanced rainfall pattern could mitigate the risk of flooding and drought, benefiting agriculture and water management. A PCI under 10 indicates a very even distribution, which is favourable for sustaining natural ecosystems and agricultural productivity.
Regional Climate Goals and Implications
Poland's commitment to reducing greenhouse gas emissions and enhancing climate resilience aligns with the observed trends in Siedlce. The warming trends and changes in precipitation distribution could influence regional policy decisions, particularly in sectors like agriculture, energy, and water management. As Poland works towards its climate goals, understanding local climate dynamics, such as those in Siedlce, is crucial for developing effective adaptation strategies.
Station Statistics
10-Year Trend
High: +1.18 °C/decade
Low: +0.84 °C/decade
Rain: -0.33 mm/decade
25-Year Trend
High: +0.80 °C/decade
Low: +0.81 °C/decade
Rain: +0.06 mm/decade
50-Year Trend
High: +0.66 °C/decade
Low: +0.45 °C/decade
Rain: +0.05 mm/decade
All-Time Trend
High: +0.51 °C/decade
Low: +0.34 °C/decade
Rain: +0.03 mm/decade
Percentage Above-Average Days
Last 12 Months: 52.3%
This Year: 35.0%
Precipitation Concentration Index (PCI) ℹ️
Last 12 Months: 11.1
Historical Average: 13.1
Percentile Rank of Last 12 Months ℹ️
High: 92nd percentile
Low: 88th percentile
Rain: 29th percentile
Change in Variance ℹ️
High: -3.6%
Low: -15.6%
Intraday: +15.0%
Data Coverage
97.1%
First Year of Data
1972
Station Location
Historical Weather Records
| Max High | Avg High | Min High | Max Avg | Avg Avg | Min Avg | Max Low | Avg Low | Min Low | Max Precipitation | Avg Precipitation | Max Snow | Avg Snow | |
|---|---|---|---|---|---|---|---|---|---|---|---|---|---|
| Record | 35.5 °C | — | -20.8 °C | 28.3 °C | — | -27.6 °C | 22.1 °C | — | -33.3 °C | 58.0 mm | — | — | — |
| January | 17.7 °C | -0.2 °C | -20.8 °C | 13.3 °C | -2.3 °C | -27.6 °C | 10.5 °C | -5.6 °C | -33.3 °C | 19.0 mm | 1.0 mm | — | — |
| February | 16.7 °C | 1.4 °C | -17.7 °C | 11.4 °C | -1.5 °C | -21.9 °C | 9.3 °C | -4.7 °C | -32.8 °C | 18.0 mm | 0.9 mm | — | — |
| March | 23.8 °C | 6.5 °C | -13.5 °C | 18.2 °C | 2.5 °C | -16.8 °C | 12.6 °C | -1.6 °C | -21.6 °C | 18.0 mm | 0.9 mm | — | — |
| April | 30.1 °C | 13.4 °C | -0.5 °C | 21.9 °C | 8.0 °C | -2.8 °C | 15.5 °C | 2.7 °C | -7.3 °C | 25.1 mm | 1.3 mm | — | — |
| May | 31.1 °C | 19.2 °C | 4.2 °C | 24.0 °C | 13.4 °C | 1.9 °C | 17.7 °C | 7.4 °C | -3.9 °C | 35.1 mm | 1.8 mm | — | — |
| June | 33.9 °C | 22.3 °C | 9.5 °C | 27.2 °C | 16.7 °C | 6.3 °C | 20.0 °C | 10.8 °C | -0.9 °C | 53.0 mm | 2.5 mm | — | — |
| July | 35.5 °C | 24.3 °C | 12.8 °C | 28.2 °C | 18.4 °C | 11.1 °C | 21.9 °C | 12.6 °C | 3.9 °C | 58.0 mm | 2.3 mm | — | — |
| August | 35.2 °C | 23.8 °C | 11.8 °C | 28.3 °C | 17.9 °C | 9.4 °C | 22.1 °C | 12.0 °C | 1.0 °C | 56.0 mm | 2.1 mm | — | — |
| September | 33.2 °C | 18.5 °C | 6.0 °C | 24.1 °C | 13.2 °C | 2.2 °C | 17.7 °C | 8.2 °C | -4.2 °C | 44.0 mm | 1.8 mm | — | — |
| October | 26.0 °C | 12.5 °C | -1.3 °C | 19.4 °C | 8.1 °C | -3.9 °C | 14.6 °C | 4.2 °C | -9.8 °C | 44.0 mm | 1.3 mm | — | — |
| November | 18.8 °C | 5.7 °C | -9.5 °C | 14.1 °C | 3.1 °C | -14.1 °C | 12.5 °C | 0.6 °C | -19.2 °C | 22.9 mm | 1.2 mm | — | — |
| December | 14.0 °C | 1.5 °C | -18.1 °C | 10.8 °C | -0.6 °C | -20.8 °C | 8.5 °C | -3.3 °C | -25.4 °C | 25.9 mm | 1.2 mm | — | — |
Data Visualisations
Remove WatermarksCurrent Year Climate Trends vs Historical


Max Temperature this Year | 1 of 6
Climate 12-Month Moving Averages


Max Temperature 12-Month MA | 1 of 6
Daily Data Points and Averages Throughout the Year
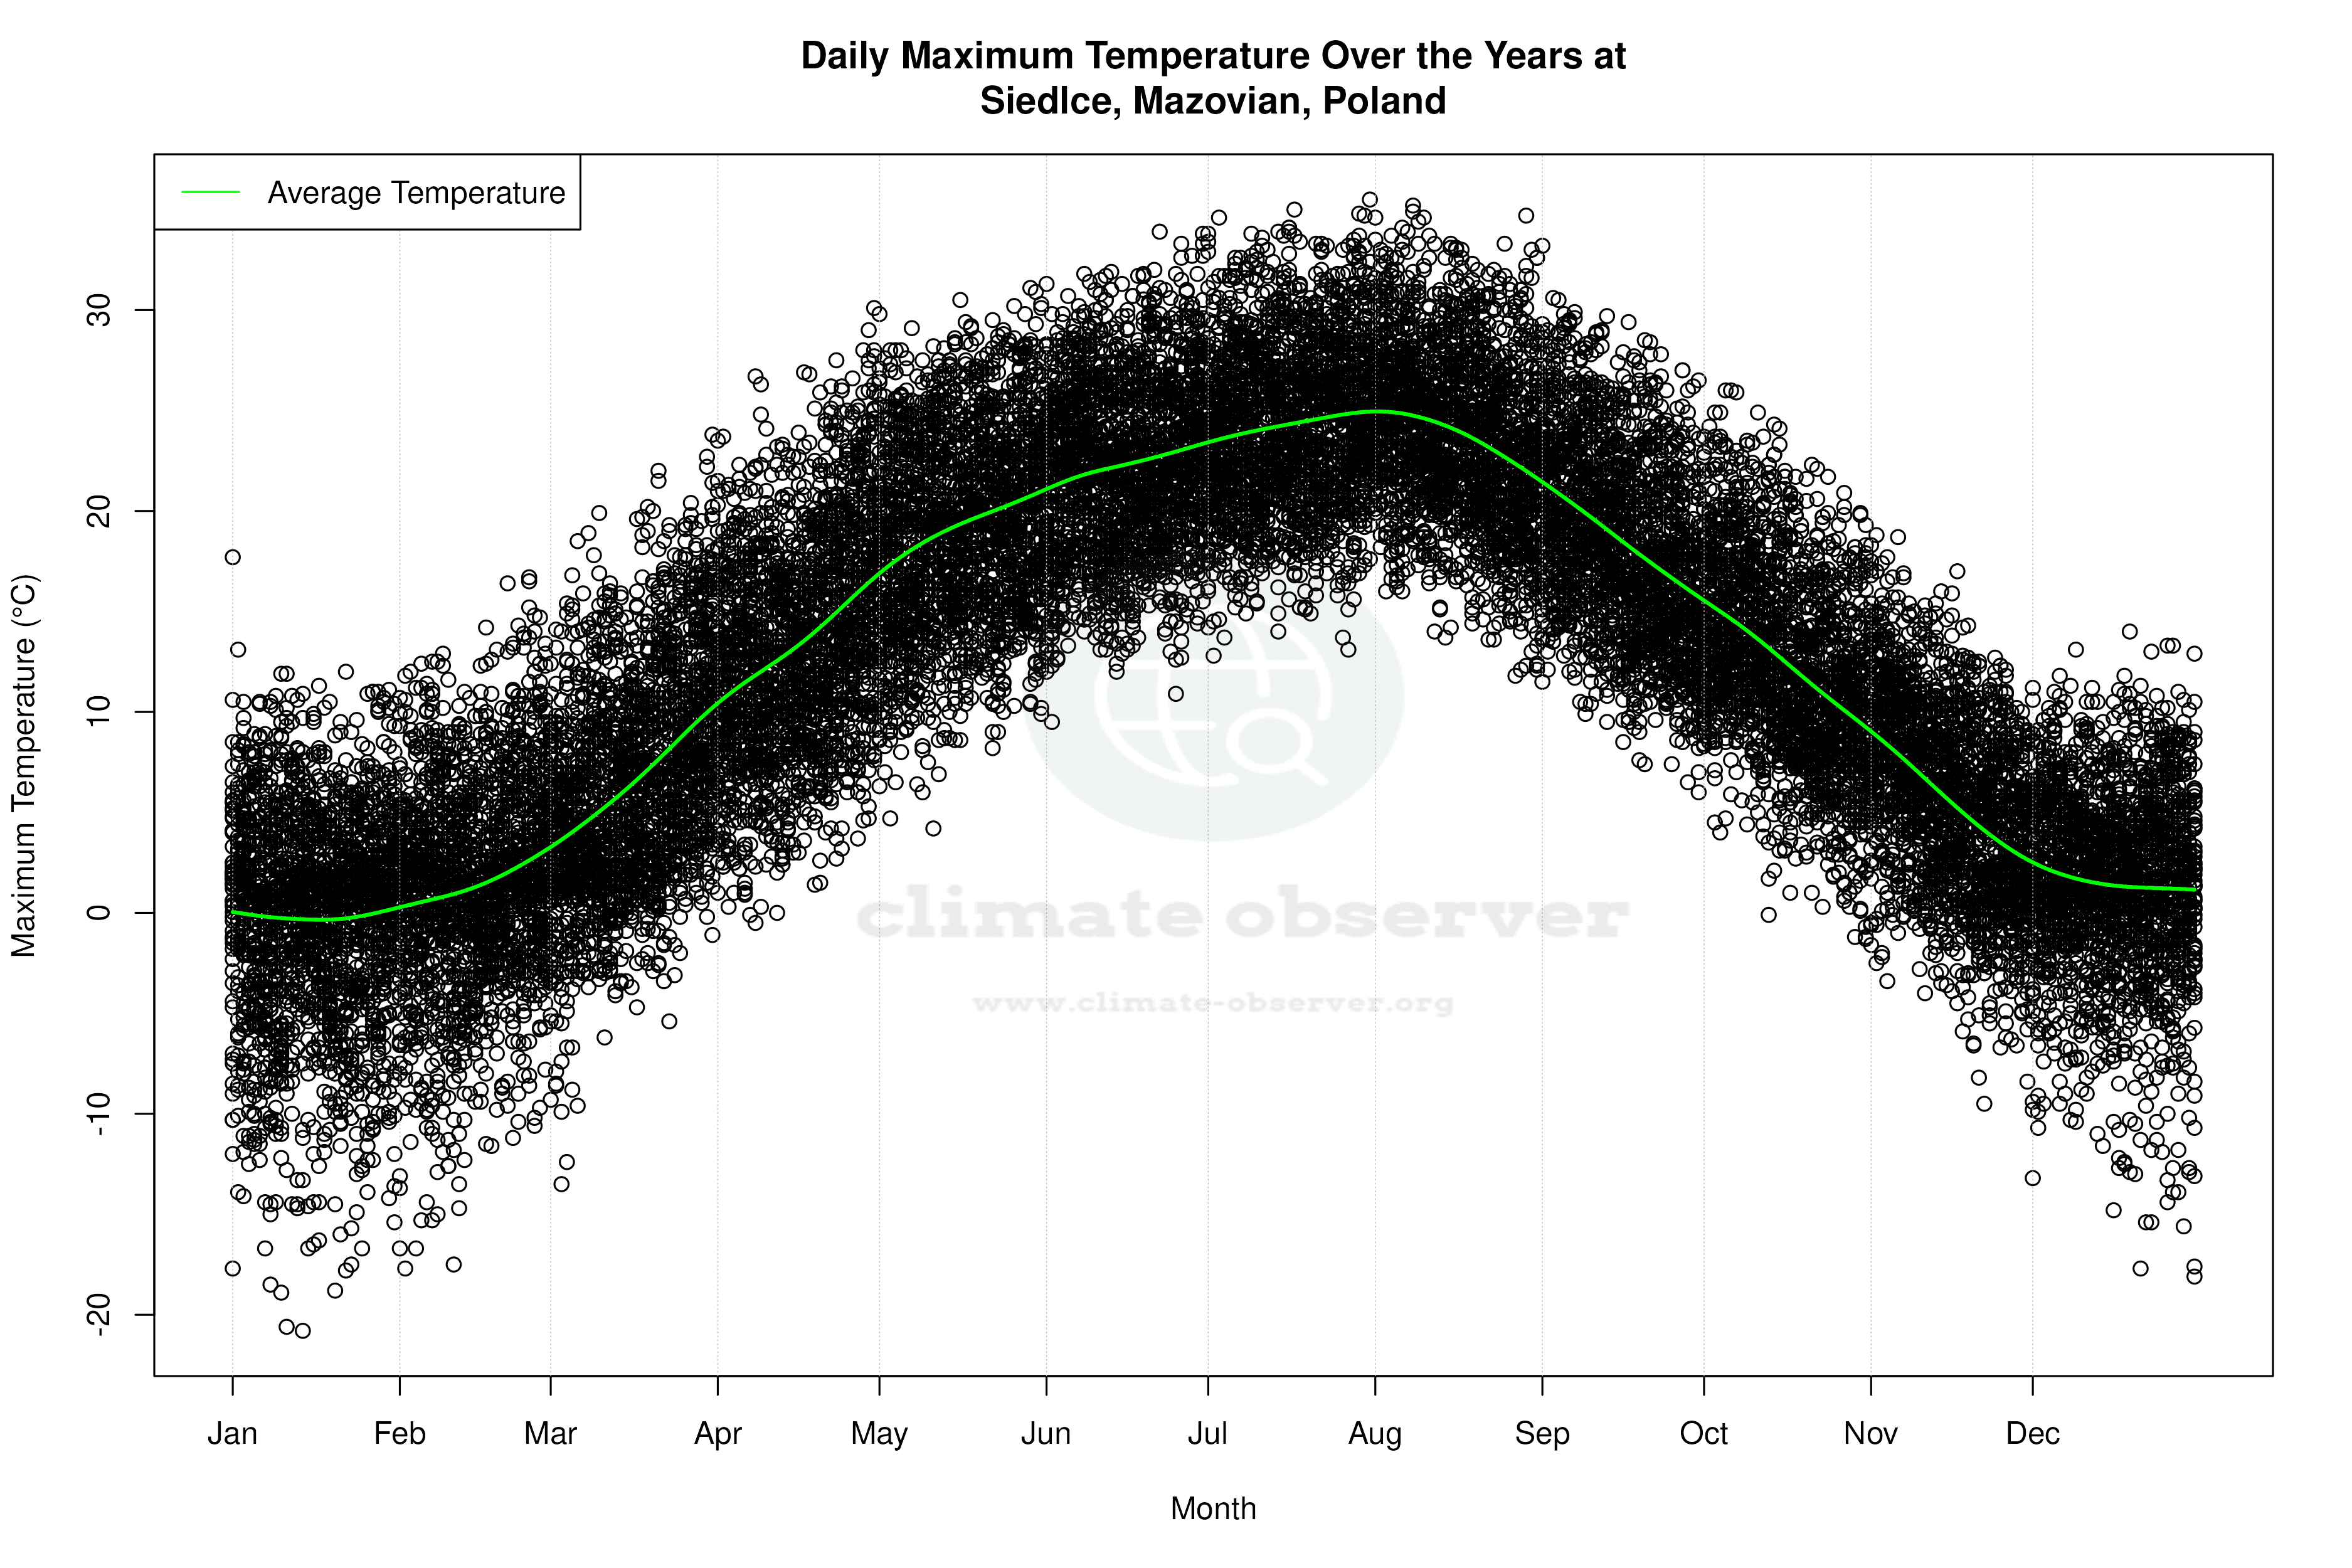


Average Max Temperature Throughout Year | 1 of 5
