Climate for Station: Nis, Central Serbia, Serbia
Loading live weather...
Climate Analysis & Overview
Nis is experiencing a warming trend, with a notable increase in high temperatures over the past decade. Precipitation is becoming slightly more concentrated, indicating potential shifts in weather patterns. These changes align with broader regional climate goals aimed at understanding and adapting to climate dynamics.
Geographical Climate Context
Nis, located in Central Serbia, falls under the Köppen climate classification of Cfa, indicating a humid subtropical climate. This classification is characterised by hot summers and mild winters, influenced by the city's geographical position in a valley surrounded by mountains. The local topography can lead to temperature inversions, affecting both temperature and precipitation patterns. The Nisava River also plays a role in moderating local climatic conditions, contributing to the region's humidity levels.
Decadal Temperature Shifts
Over the past ten years, Nis has experienced a significant warming trend. The high temperatures have risen by 1.81°C (3.26°F), while the lows have increased by 0.75°C (1.35°F). These changes are more pronounced than the all-time temperature trends, which show a rise of 0.30°C (0.54°F) for highs and 0.21°C (0.38°F) for lows. This disparity suggests a recent acceleration in temperature increases, possibly linked to broader climatic changes across the Balkans.
Historical Extremes
Nis has recorded some extreme temperatures, with a maximum of 44.2°C (111.6°F) and a minimum of -23.7°C (-10.7°F). These records highlight the city's potential for both intense heat and severe cold, reflective of its continental climate influences. Such extremes can have significant impacts on local agriculture, infrastructure, and daily life, necessitating adaptive measures.
Precipitation Patterns and PCI
The Precipitation Concentration Index (PCI) for Nis has seen a slight increase from a baseline of 12.1 to a current value of 12.5. This indicates a marginal shift towards more concentrated precipitation events, meaning that rainfall is occurring in fewer, more intense events rather than being evenly distributed throughout the year. While this change is not drastic, it could affect water management and agricultural planning in the region.
Regional Climate Goals and Implications
Serbia's regional climate goals focus on enhancing resilience and understanding of climate variability. The warming trends observed in Nis align with these objectives, providing critical data for developing adaptive strategies. Recent weather events, such as heatwaves and heavy rainfall, underscore the importance of such initiatives. As Nis continues to experience these climatic shifts, ongoing monitoring and research will be vital in mitigating potential impacts.
Station Statistics
10-Year Trend
High: +1.78 °C/decade
Low: +0.74 °C/decade
Rain: -0.21 mm/decade
25-Year Trend
High: +0.98 °C/decade
Low: +0.67 °C/decade
Rain: -0.01 mm/decade
50-Year Trend
High: +0.59 °C/decade
Low: +0.38 °C/decade
Rain: +0.03 mm/decade
All-Time Trend
High: +0.31 °C/decade
Low: +0.21 °C/decade
Rain: +0.02 mm/decade
Percentage Above-Average Days
Last 12 Months: 52.3%
This Year: 45.0%
Precipitation Concentration Index (PCI) ℹ️
Last 12 Months: 14.6
Historical Average: 13.0
Percentile Rank of Last 12 Months ℹ️
High: 94th percentile
Low: 89th percentile
Rain: 30th percentile
Change in Variance ℹ️
High: -3.7%
Low: -2.5%
Intraday: +1.7%
Data Coverage
88.0%
First Year of Data
1946
Station Location
Historical Weather Records
| Max High | Avg High | Min High | Max Avg | Avg Avg | Min Avg | Max Low | Avg Low | Min Low | Max Precipitation | Avg Precipitation | Max Snow | Avg Snow | |
|---|---|---|---|---|---|---|---|---|---|---|---|---|---|
| Record | 44.2 °C | — | -13.8 °C | 32.2 °C | — | -19.0 °C | 26.9 °C | — | -23.7 °C | 76.6 mm | — | — | — |
| January | 21.7 °C | 4.6 °C | -13.8 °C | 14.7 °C | 0.5 °C | -19.0 °C | 11.5 °C | -2.9 °C | -23.7 °C | 38.4 mm | 1.3 mm | — | — |
| February | 23.9 °C | 7.8 °C | -11.4 °C | 17.4 °C | 2.8 °C | -15.7 °C | 12.2 °C | -1.3 °C | -21.6 °C | 34.8 mm | 1.3 mm | — | — |
| March | 33.5 °C | 12.7 °C | -6.8 °C | 21.9 °C | 7.2 °C | -9.8 °C | 15.0 °C | 1.9 °C | -15.0 °C | 30.2 mm | 1.4 mm | — | — |
| April | 33.0 °C | 18.4 °C | 2.0 °C | 24.3 °C | 11.9 °C | -0.9 °C | 18.2 °C | 6.3 °C | -5.6 °C | 33.2 mm | 1.7 mm | — | — |
| May | 35.3 °C | 23.4 °C | 7.6 °C | 26.7 °C | 16.7 °C | 6.2 °C | 21.4 °C | 10.7 °C | -1.0 °C | 43.2 mm | 2.1 mm | — | — |
| June | 40.3 °C | 27.0 °C | 11.6 °C | 30.6 °C | 20.3 °C | 8.8 °C | 23.9 °C | 14.1 °C | 4.2 °C | 56.8 mm | 2.1 mm | — | — |
| July | 44.2 °C | 29.5 °C | 13.8 °C | 32.2 °C | 22.4 °C | 13.1 °C | 24.8 °C | 15.5 °C | 4.1 °C | 73.0 mm | 1.4 mm | — | — |
| August | 42.2 °C | 29.9 °C | 12.1 °C | 32.2 °C | 22.2 °C | 11.1 °C | 26.9 °C | 15.3 °C | 4.6 °C | 71.2 mm | 1.4 mm | — | — |
| September | 39.6 °C | 25.3 °C | 8.5 °C | 29.3 °C | 17.8 °C | 6.8 °C | 22.9 °C | 11.7 °C | -3.0 °C | 49.5 mm | 1.5 mm | — | — |
| October | 34.9 °C | 19.1 °C | 0.4 °C | 25.3 °C | 12.3 °C | 0.6 °C | 20.6 °C | 6.9 °C | -6.8 °C | 47.3 mm | 1.5 mm | — | — |
| November | 29.0 °C | 12.2 °C | -4.5 °C | 21.8 °C | 6.6 °C | -9.4 °C | 16.8 °C | 3.0 °C | -14.0 °C | 76.6 mm | 2.0 mm | — | — |
| December | 22.2 °C | 6.3 °C | -8.6 °C | 18.1 °C | 2.2 °C | -11.5 °C | 14.0 °C | -0.9 °C | -16.6 °C | 35.7 mm | 1.7 mm | — | — |
Data Visualisations
Remove WatermarksCurrent Year Climate Trends vs Historical
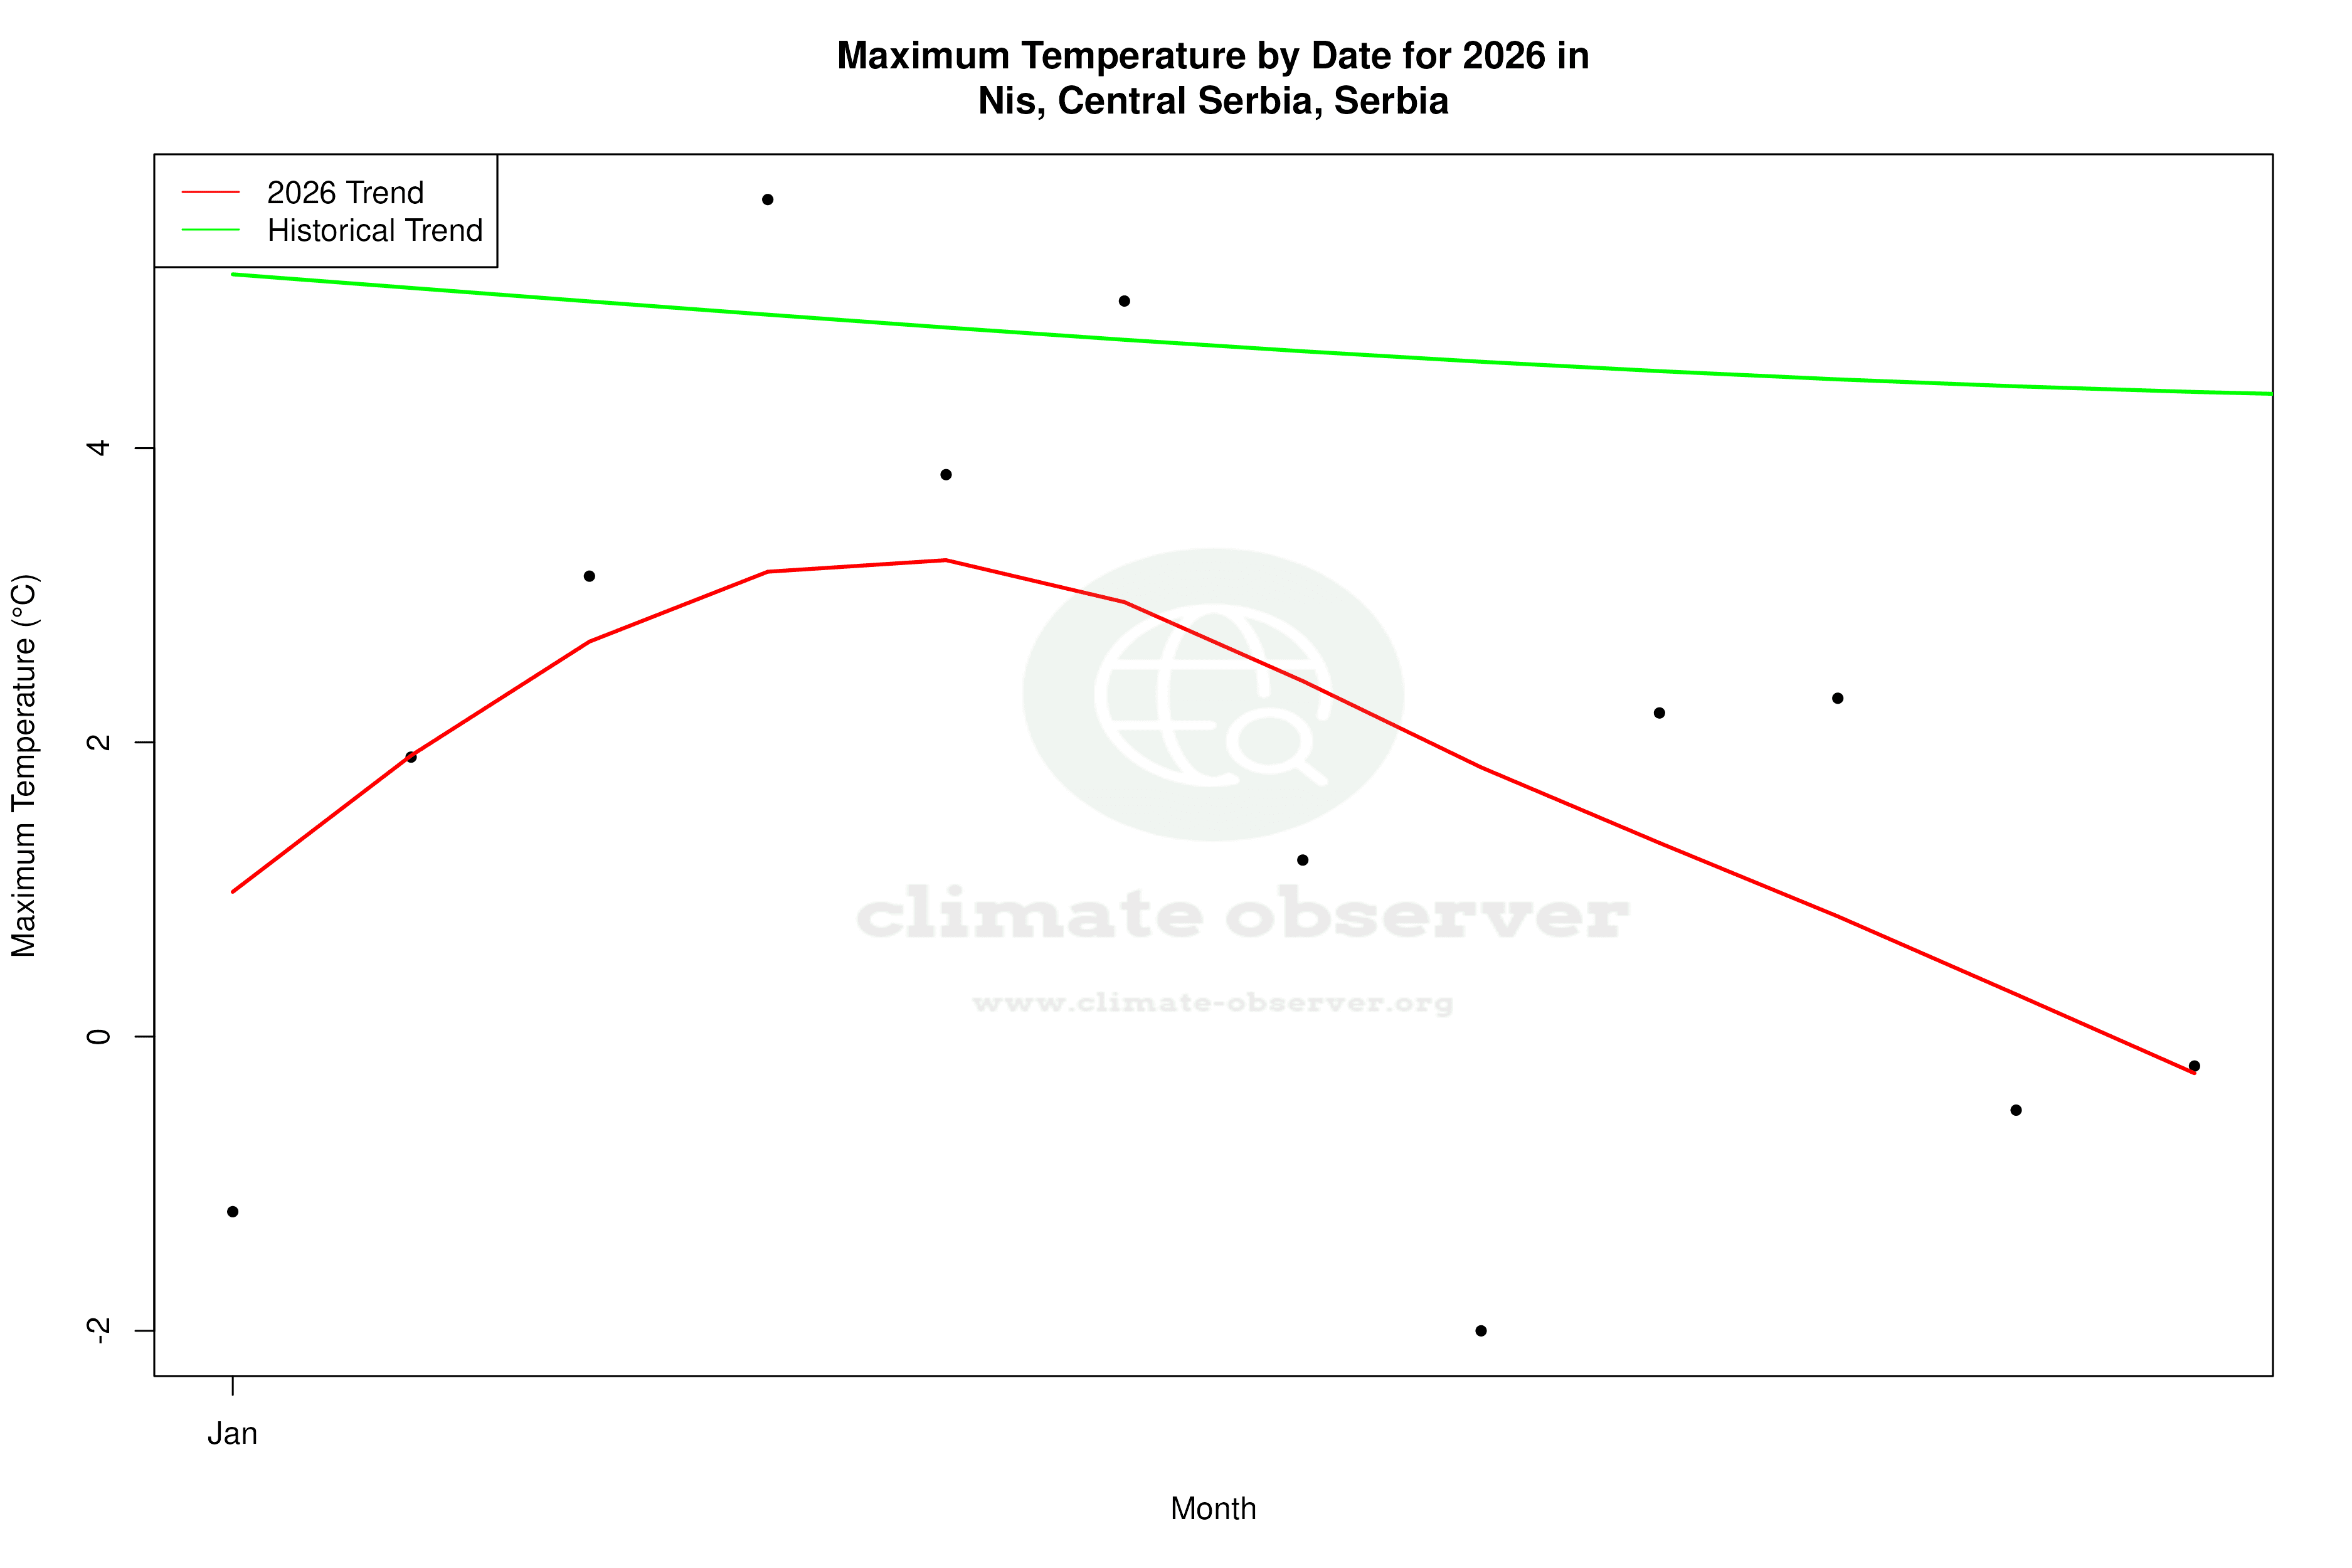


Max Temperature this Year | 1 of 6
Climate 12-Month Moving Averages


Max Temperature 12-Month MA | 1 of 6
Daily Data Points and Averages Throughout the Year


Average Max Temperature Throughout Year | 1 of 5
