Climate for Station: Majuro Wbas Ap, Ratak, Marshall Islands
Loading live weather...
Climate Analysis & Overview
The climate profile for Majuro Wbas Ap reveals a complex interplay of warming and cooling trends, with a notable shift towards more evenly distributed precipitation. While long-term data indicates a warming trend, recent years have shown a slight cooling in temperature highs and lows.
Tropical Climate Dynamics
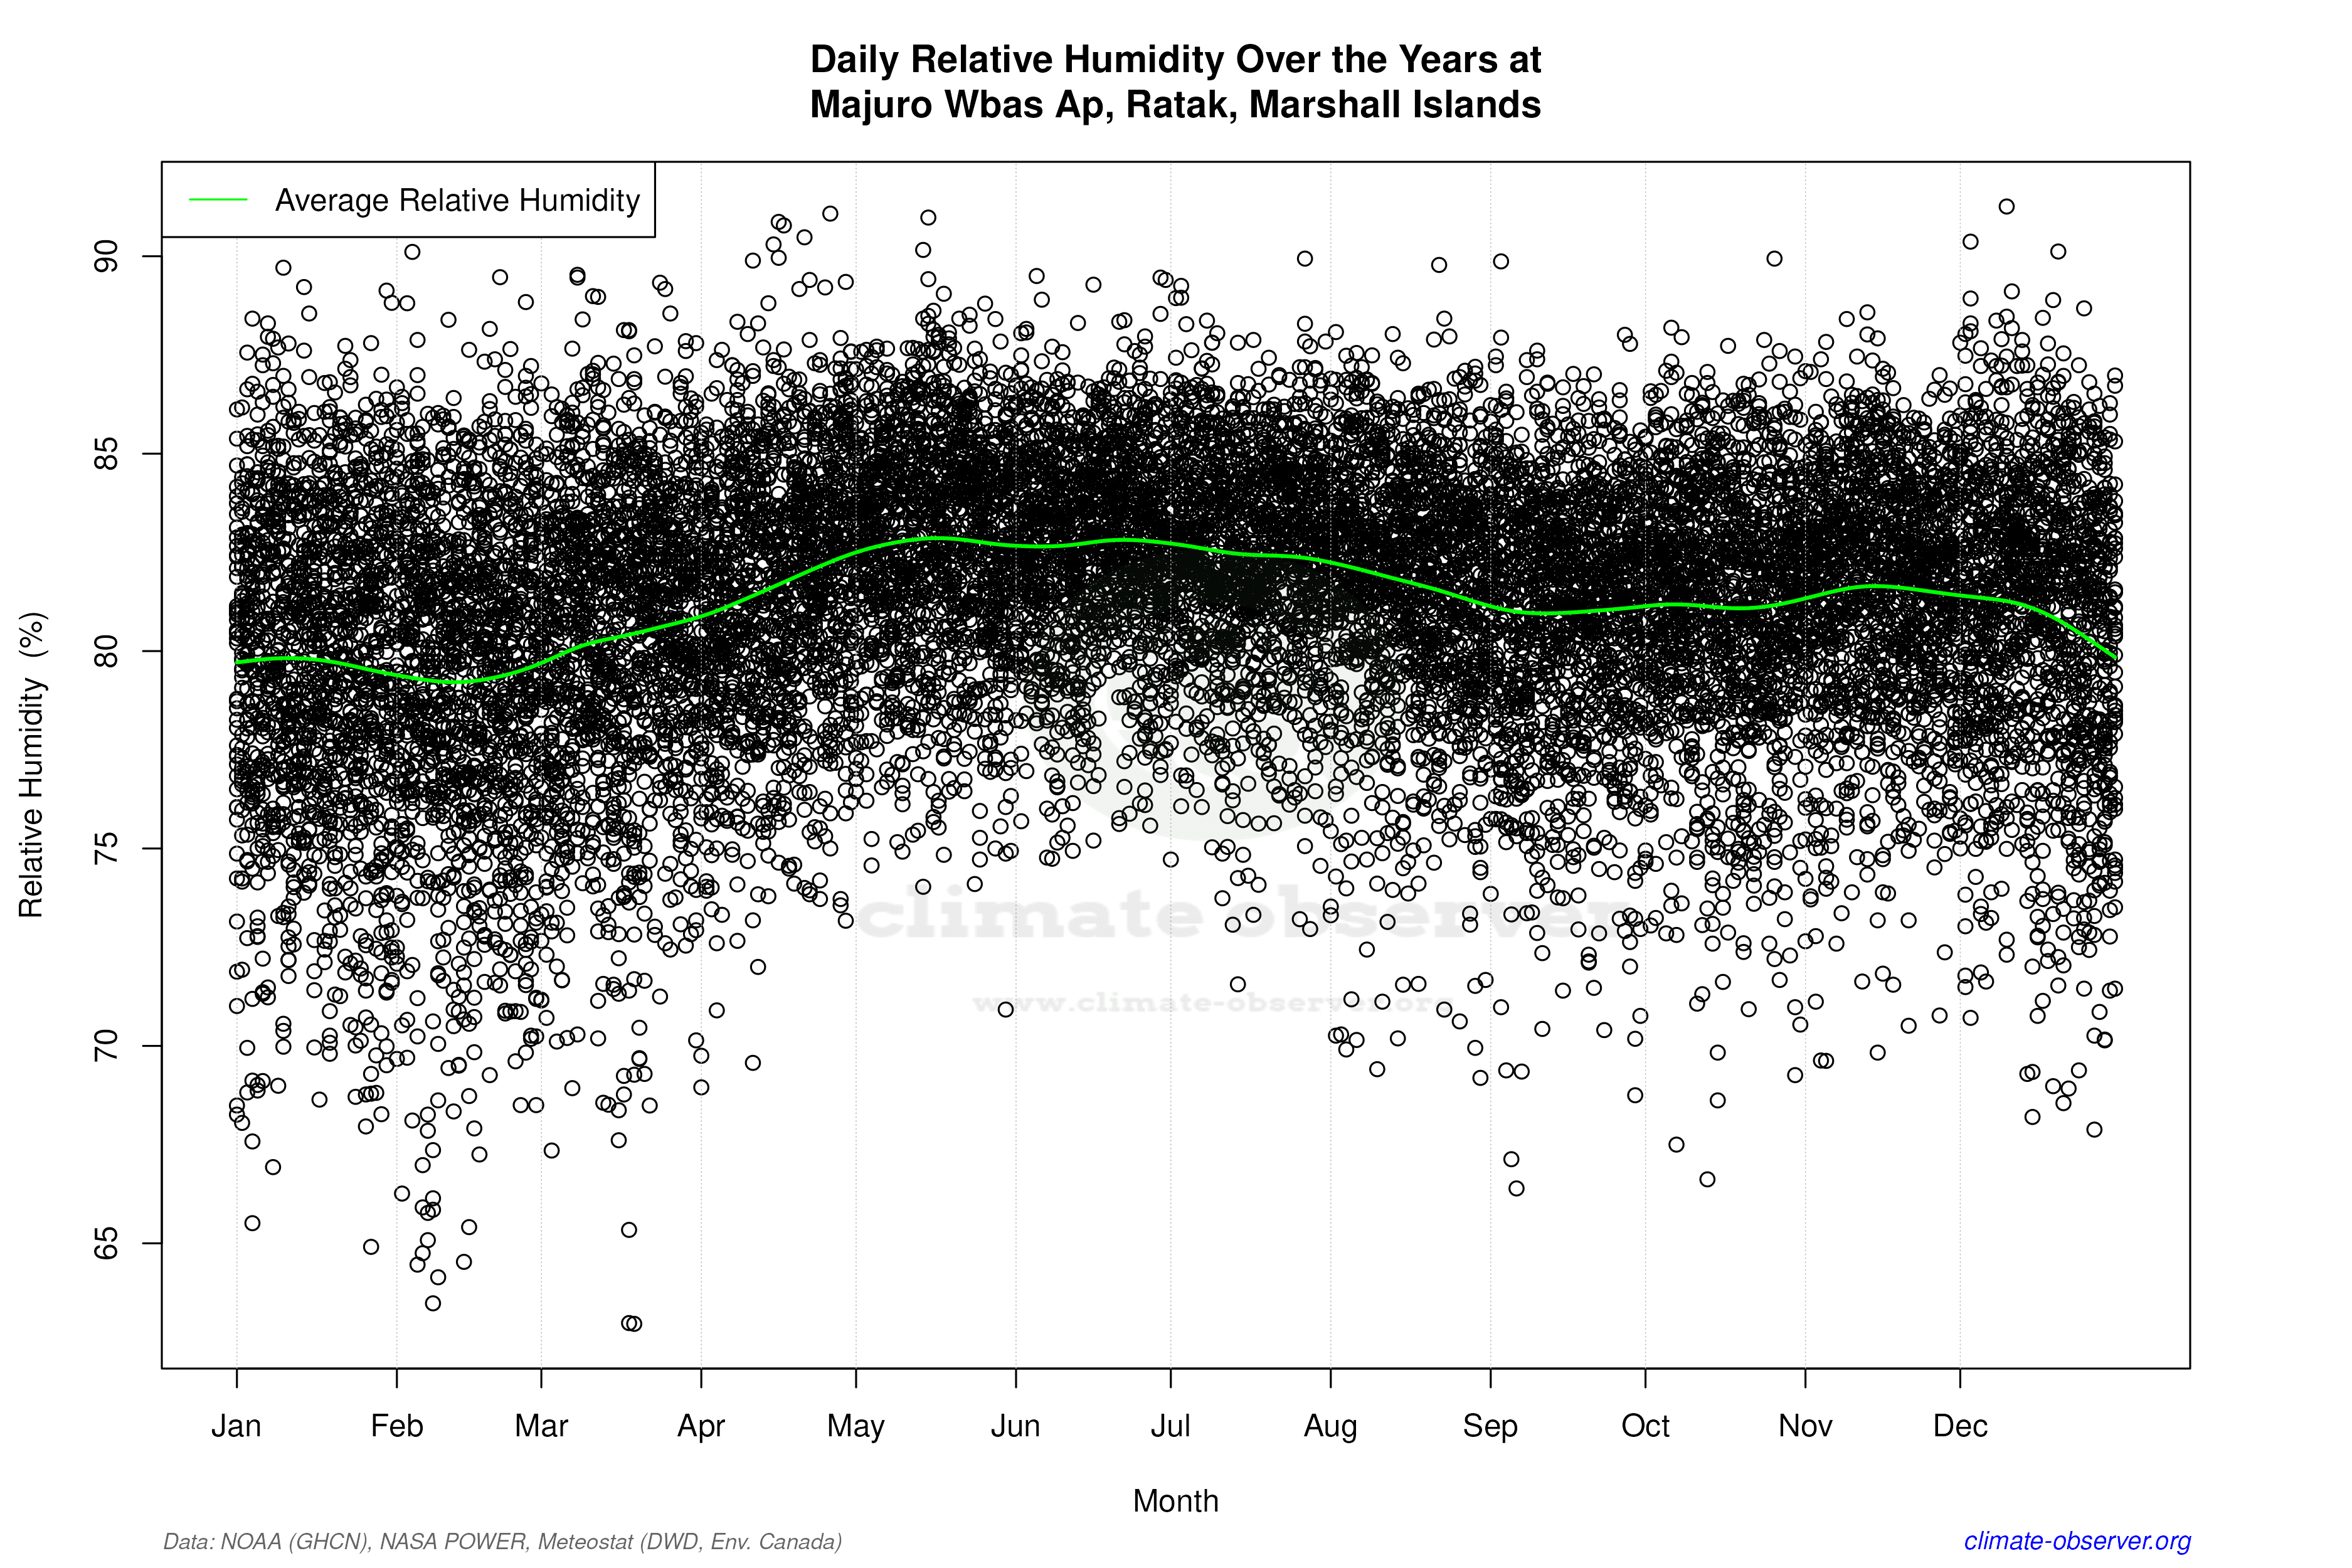
Majuro Wbas Ap, located in the Marshall Islands, experiences a tropical rainforest climate, classified under the Köppen system as Af. This classification is characterised by high temperatures and significant rainfall throughout the year, influenced heavily by its proximity to the equator and the surrounding Pacific Ocean. The local geography, with its low-lying atolls, plays a crucial role in moderating temperature extremes and ensuring consistent humidity levels.
Temperature Trends: A Tale of Two Timelines
The all-time trends at Majuro Wbas Ap indicate a warming pattern, with highs increasing by 0.10°C (0.18°F) and lows by 0.29°C (0.52°F). This suggests a gradual rise in baseline temperatures over the decades. However, the more recent 10-year trends tell a different story, with a slight cooling observed in both highs, decreasing by 0.15°C (0.27°F), and lows by 0.05°C (0.09°F). This divergence highlights the complexity of climate dynamics in the region, where short-term fluctuations can contrast with long-term trends.
Precipitation Patterns: Towards Even Distribution
The Precipitation Concentration Index (PCI) has seen a decrease from a baseline of 10.77 to a current value of 9.55. This indicates a shift towards more evenly distributed rainfall events, reducing the concentration of precipitation in fewer, more intense occurrences. Such a trend can be beneficial for the region, potentially mitigating the risk of flooding and improving water resource management.
Temperature Extremes: A Narrow Band
Majuro Wbas Ap experiences a relatively narrow range of temperature extremes, with a recorded maximum of 34.7°C (94.5°F) and a minimum of 20.0°C (68.0°F). These values reflect the moderating influence of the ocean, which helps to maintain stable temperatures year-round. The limited temperature variability is typical of equatorial regions, where the sun's consistent angle ensures minimal seasonal change.
Regional Climate Context
The Marshall Islands have been proactive in addressing climate change, with initiatives aimed at reducing carbon emissions and enhancing resilience against sea level rise. Recent weather events, such as increased storm activity, underscore the importance of these efforts. The climate data from Majuro Wbas Ap provides valuable insights into the broader regional trends, contributing to the understanding and management of climate impacts in this vulnerable island nation.
Station Statistics
10-Year Trend
High: -0.16 °C/decade
Low: -0.05 °C/decade
Rain: +0.55 mm/decade
25-Year Trend
High: +0.03 °C/decade
Low: +0.40 °C/decade
Rain: +0.73 mm/decade
50-Year Trend
High: +0.03 °C/decade
Low: +0.56 °C/decade
Rain: +0.15 mm/decade
All-Time Trend
High: +0.10 °C/decade
Low: +0.29 °C/decade
Rain: -0.07 mm/decade
Percentage Above-Average Days
Last 12 Months: 74.5%
This Year: 75.0%
Precipitation Concentration Index (PCI) ℹ️
Last 12 Months: 9.3
Historical Average: 10.8
Percentile Rank of Last 12 Months ℹ️
High: 79th percentile
Low: 95th percentile
Rain: 71st percentile
Change in Variance ℹ️
High: +0.1%
Low: -24.7%
Intraday: -24.0%
Data Coverage
81.6%
First Year of Data
1946
Station Location
Historical Weather Records
| Max High | Avg High | Min High | Max Avg | Avg Avg | Min Avg | Max Low | Avg Low | Min Low | Max Precipitation | Avg Precipitation | Max Snow | Avg Snow | |
|---|---|---|---|---|---|---|---|---|---|---|---|---|---|
| Record | 34.7 °C | — | 25.0 °C | 29.9 °C | — | 24.4 °C | 29.1 °C | — | 20.0 °C | 380.5 mm | — | 0.0 mm | — |
| January | 33.3 °C | 29.6 °C | 26.1 °C | 29.1 °C | 27.7 °C | 25.2 °C | 28.3 °C | 25.3 °C | 20.6 °C | 212.1 mm | 6.6 mm | 0.0 mm | 0.0 mm |
| February | 32.8 °C | 29.8 °C | 26.1 °C | 29.1 °C | 27.6 °C | 25.1 °C | 28.4 °C | 25.3 °C | 21.1 °C | 168.9 mm | 6.5 mm | 0.0 mm | 0.0 mm |
| March | 32.2 °C | 29.9 °C | 26.1 °C | 29.2 °C | 27.6 °C | 25.4 °C | 28.4 °C | 25.3 °C | 21.1 °C | 205.7 mm | 7.0 mm | 0.0 mm | 0.0 mm |
| April | 32.2 °C | 29.9 °C | 26.6 °C | 29.1 °C | 27.8 °C | 24.4 °C | 28.3 °C | 25.3 °C | 21.1 °C | 168.4 mm | 9.0 mm | 0.0 mm | 0.0 mm |
| May | 32.2 °C | 30.0 °C | 26.1 °C | 29.2 °C | 28.0 °C | 24.8 °C | 28.5 °C | 25.3 °C | 21.1 °C | 205.2 mm | 9.1 mm | 0.0 mm | 0.0 mm |
| June | 33.3 °C | 30.0 °C | 26.1 °C | 29.2 °C | 28.0 °C | 25.8 °C | 28.5 °C | 25.2 °C | 21.1 °C | 151.9 mm | 9.7 mm | 0.0 mm | 0.0 mm |
| July | 32.8 °C | 30.1 °C | 26.7 °C | 29.5 °C | 27.9 °C | 25.8 °C | 28.4 °C | 25.2 °C | 21.1 °C | 136.9 mm | 10.0 mm | 0.0 mm | 0.0 mm |
| August | 34.7 °C | 30.2 °C | 26.1 °C | 29.8 °C | 27.9 °C | 25.8 °C | 28.6 °C | 25.2 °C | 21.7 °C | 184.7 mm | 9.4 mm | 0.0 mm | 0.0 mm |
| September | 32.8 °C | 30.3 °C | 26.7 °C | 29.9 °C | 28.0 °C | 25.9 °C | 29.1 °C | 25.2 °C | 21.1 °C | 130.0 mm | 10.6 mm | 0.0 mm | 0.0 mm |
| October | 32.8 °C | 30.3 °C | 26.7 °C | 29.5 °C | 28.0 °C | 26.2 °C | 28.9 °C | 25.2 °C | 21.1 °C | 213.1 mm | 11.6 mm | 0.0 mm | 0.0 mm |
| November | 33.9 °C | 30.1 °C | 25.0 °C | 29.6 °C | 28.0 °C | 26.0 °C | 28.9 °C | 25.2 °C | 20.0 °C | 207.0 mm | 11.5 mm | 0.0 mm | 0.0 mm |
| December | 32.8 °C | 29.8 °C | 26.1 °C | 29.5 °C | 28.0 °C | 25.6 °C | 28.9 °C | 25.3 °C | 21.1 °C | 380.5 mm | 9.4 mm | 0.0 mm | 0.0 mm |
Data Visualisations
Remove WatermarksCurrent Year Climate Trends vs Historical


Max Temperature this Year | 1 of 6
Climate 12-Month Moving Averages


Max Temperature 12-Month MA | 1 of 6
Daily Data Points and Averages Throughout the Year


Average Max Temperature Throughout Year | 1 of 5
