Climate for Station: Calarasi, Călărași, Romania
Loading live weather...
Climate Analysis & Overview
Calarasi, Romania, is experiencing a warming trend, with recent data revealing a 1.72°C (3.10°F) increase in high temperatures over the past decade. This is significantly higher than the all-time trend, which shows a modest rise of 0.16°C (0.29°F). The Precipitation Concentration Index (PCI) has increased, indicating more concentrated rainfall events.
Calarasi's Climatic Character
Calarasi is located in southeastern Romania, nestled in a region characterised by a humid continental climate, denoted as Dfb in the Köppen classification. This climate type typically involves warm summers and cold winters, influenced by the proximity to the Danube River, which moderates temperature extremes. The station's geographical position makes it susceptible to both continental and maritime influences, impacting its climatic patterns.
Warming Trends and Temperature Shifts
The most notable change in Calarasi's climate is the warming trend observed over the last decade. High temperatures have increased by 1.72°C (3.10°F), while low temperatures have risen by 0.44°C (0.79°F). These figures are markedly higher than the all-time trends, which show a smaller increase of 0.16°C (0.29°F) for highs and 0.05°C (0.09°F) for lows. This divergence suggests a recent acceleration in warming, potentially influenced by broader regional climate dynamics and global climate change.
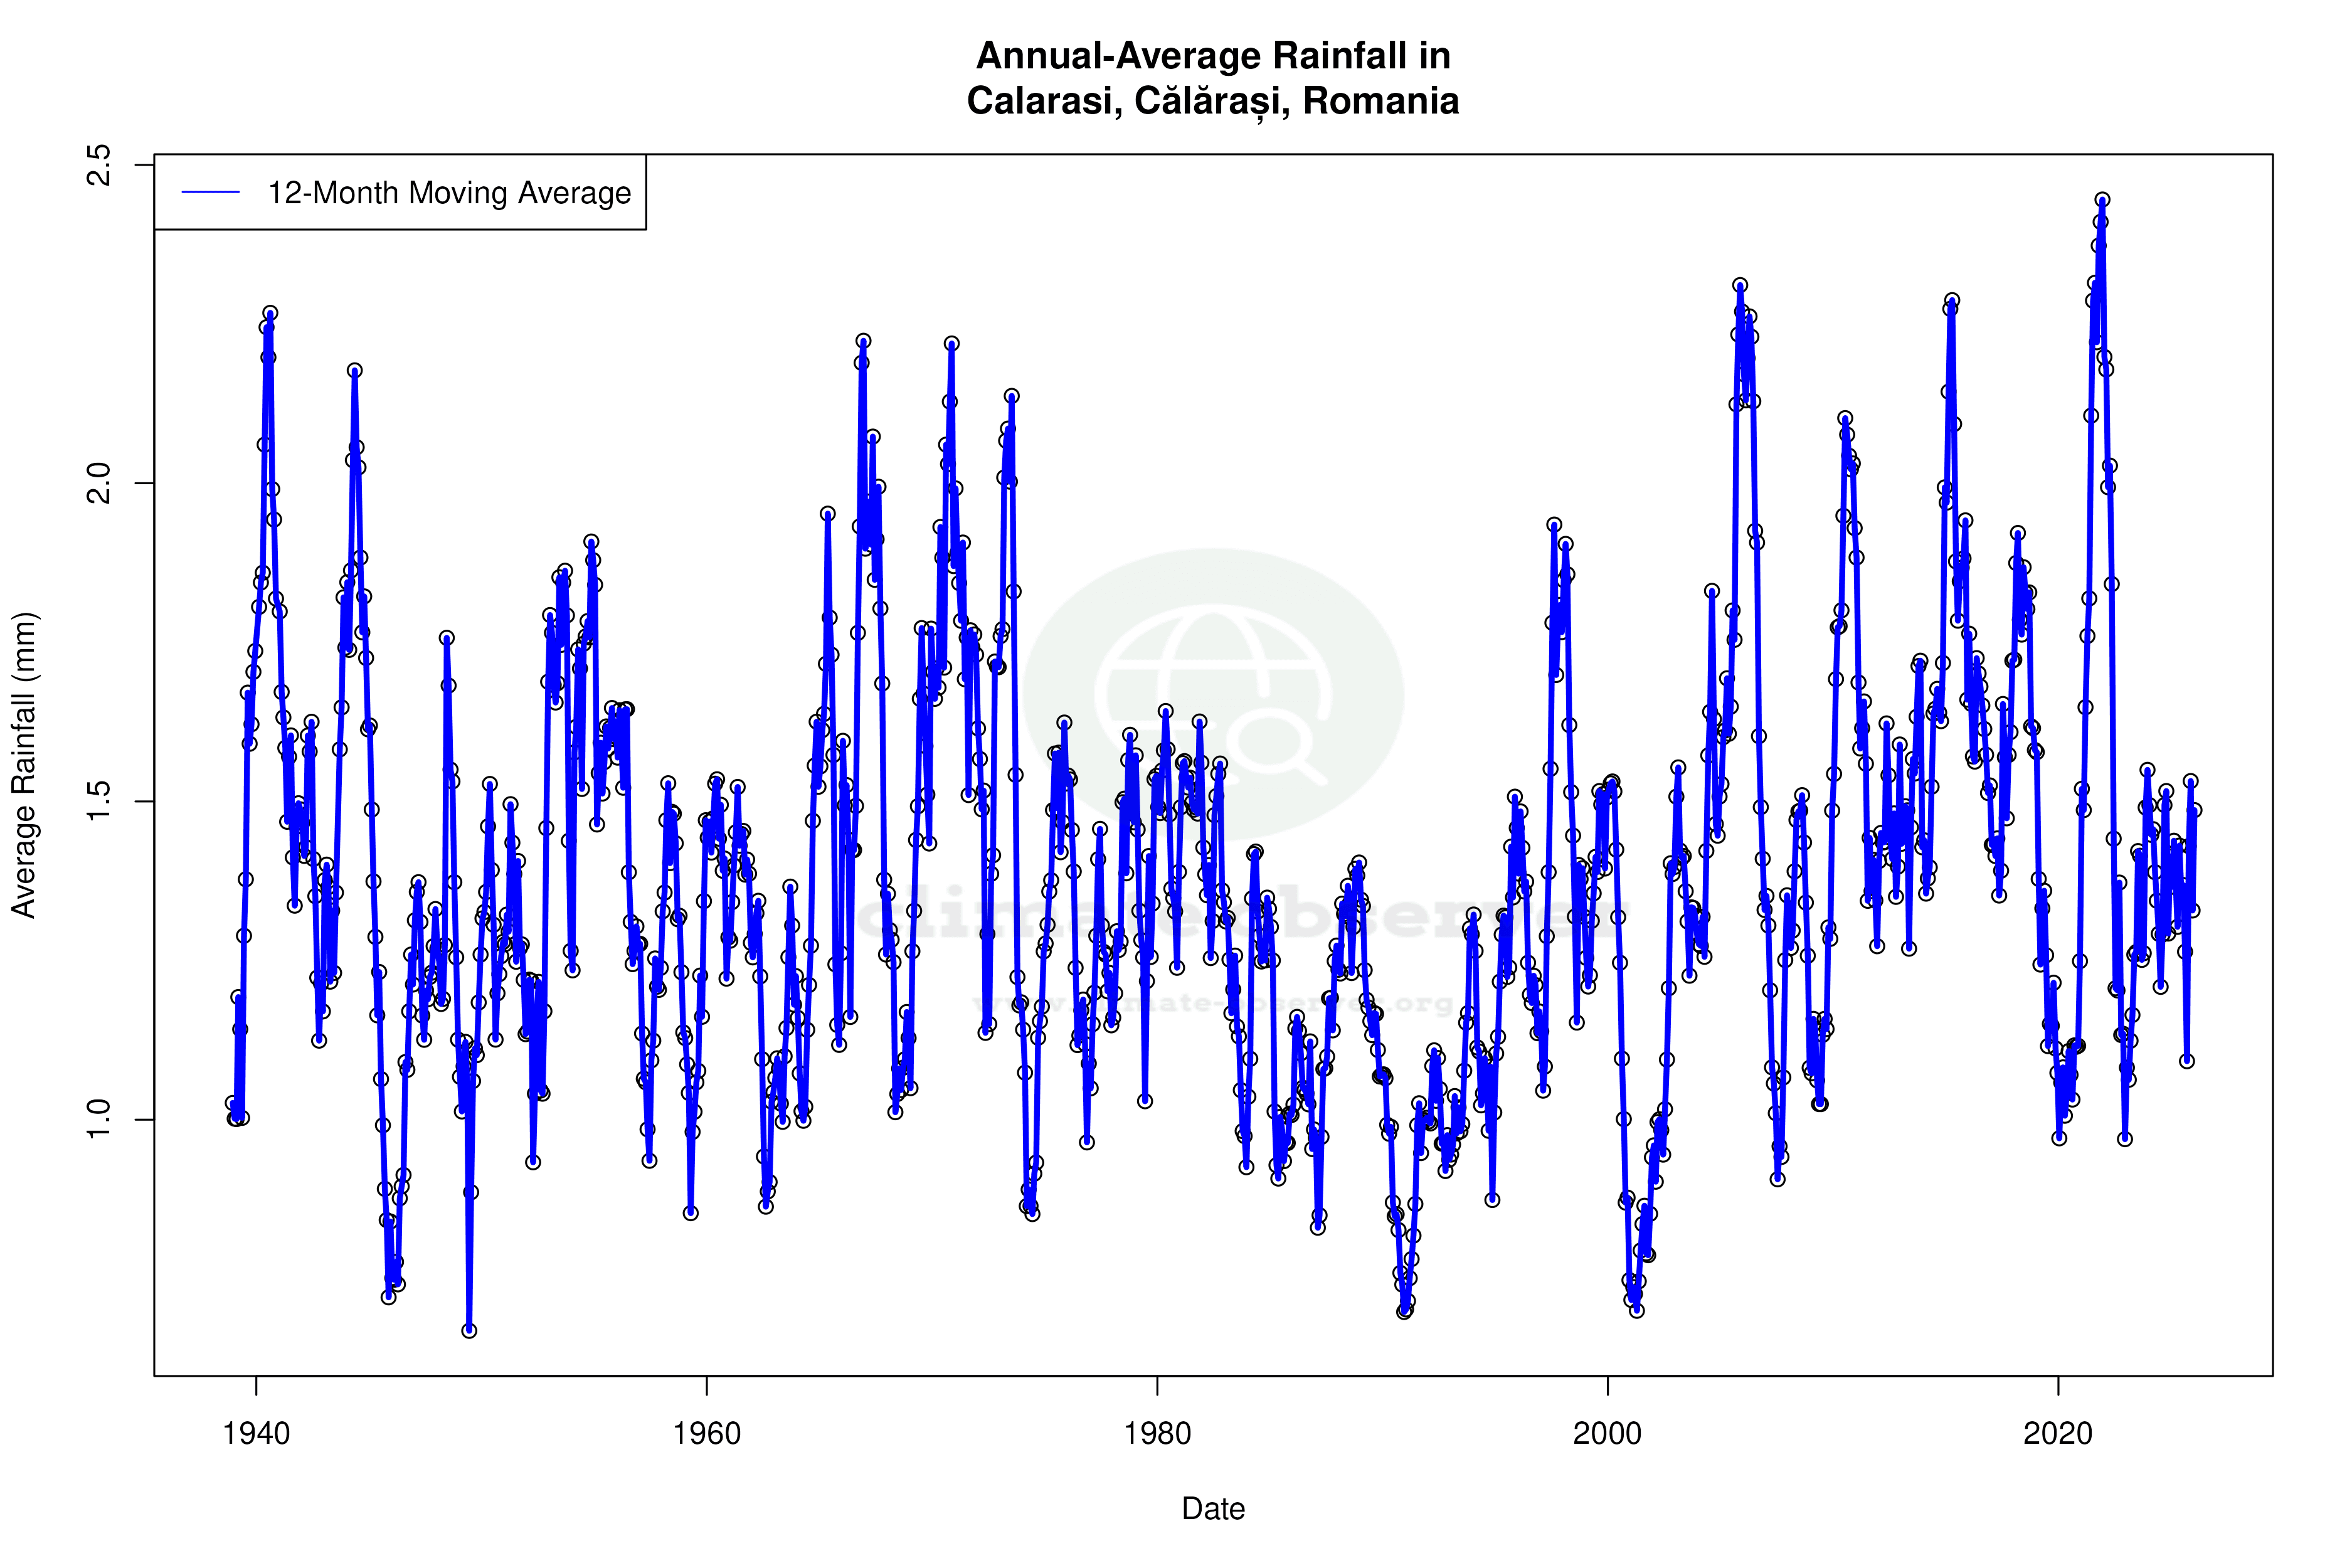
Precipitation Patterns and PCI Insights
The Precipitation Concentration Index (PCI) for Calarasi has risen from a baseline of 12.1 to a current value of 14.4. This increase indicates that precipitation is becoming more concentrated, with rain falling in fewer, more intense events. While a PCI under 20 is not considered highly concentrated, the change suggests a shift towards more sporadic and potentially more severe rainfall events, which could have implications for local agriculture and water management.
Temperature Extremes and Historical Records
Calarasi has experienced significant temperature extremes, with a record high of 42.3°C (108.1°F) and a record low of -30.0°C (-22.0°F). These extremes highlight the region's vulnerability to temperature fluctuations, which can impact energy demand, infrastructure, and public health. The recent warming trends may exacerbate these extremes, leading to more frequent occurrences of record-breaking temperatures.
Regional Climate Context and Future Considerations
Romania's climate goals focus on mitigating the impacts of climate change and adapting to its effects. The observed trends in Calarasi align with broader regional patterns of warming and changing precipitation, underscoring the importance of integrating climate resilience into local planning. Recent weather events, such as heatwaves and intense rainstorms, serve as reminders of the challenges posed by a changing climate and the need for proactive measures to safeguard communities and ecosystems.
Station Statistics
10-Year Trend
High: +1.72 °C/decade
Low: +1.00 °C/decade
Rain: -0.22 mm/decade
25-Year Trend
High: +0.91 °C/decade
Low: +0.72 °C/decade
Rain: +0.08 mm/decade
50-Year Trend
High: +0.59 °C/decade
Low: +0.43 °C/decade
Rain: +0.08 mm/decade
All-Time Trend
High: +0.14 °C/decade
Low: +0.04 °C/decade
Rain: +0.01 mm/decade
Percentage Above-Average Days
Last 12 Months: 57.3%
This Year: 47.4%
Precipitation Concentration Index (PCI) ℹ️
Last 12 Months: 14.1
Historical Average: 12.3
Percentile Rank of Last 12 Months ℹ️
High: 93rd percentile
Low: 94th percentile
Rain: 53rd percentile
Change in Variance ℹ️
High: -10.6%
Low: -11.8%
Intraday: +0.1%
Data Coverage
75.8%
First Year of Data
1942
Station Location
Historical Weather Records
| Max High | Avg High | Min High | Max Avg | Avg Avg | Min Avg | Max Low | Avg Low | Min Low | Max Precipitation | Avg Precipitation | Max Snow | Avg Snow | |
|---|---|---|---|---|---|---|---|---|---|---|---|---|---|
| Record | 42.3 °C | — | -17.1 °C | 33.5 °C | — | -16.5 °C | 27.1 °C | — | -30.0 °C | 84.0 mm | — | — | — |
| January | 20.9 °C | 2.6 °C | -17.1 °C | 16.4 °C | -0.3 °C | -16.5 °C | 13.8 °C | -4.5 °C | -30.0 °C | 39.6 mm | 1.1 mm | — | — |
| February | 25.0 °C | 5.2 °C | -16.7 °C | 16.2 °C | 1.3 °C | -15.9 °C | 13.3 °C | -2.8 °C | -24.7 °C | 44.4 mm | 1.0 mm | — | — |
| March | 30.7 °C | 11.3 °C | -8.8 °C | 20.9 °C | 5.9 °C | -11.2 °C | 17.7 °C | 1.0 °C | -17.5 °C | 39.2 mm | 1.1 mm | — | — |
| April | 34.0 °C | 18.2 °C | 3.0 °C | 24.3 °C | 11.5 °C | -0.5 °C | 19.3 °C | 5.8 °C | -7.8 °C | 53.7 mm | 1.3 mm | — | — |
| May | 37.5 °C | 23.8 °C | 9.1 °C | 26.6 °C | 17.2 °C | 5.5 °C | 22.2 °C | 10.8 °C | -5.1 °C | 84.0 mm | 1.7 mm | — | — |
| June | 39.5 °C | 27.7 °C | 13.7 °C | 30.2 °C | 22.0 °C | 12.0 °C | 24.1 °C | 15.0 °C | 5.5 °C | 67.0 mm | 2.2 mm | — | — |
| July | 42.3 °C | 30.0 °C | 16.8 °C | 33.5 °C | 24.4 °C | 15.4 °C | 27.1 °C | 16.8 °C | 7.6 °C | 70.3 mm | 1.7 mm | — | — |
| August | 41.4 °C | 29.9 °C | 16.2 °C | 31.5 °C | 24.0 °C | 14.8 °C | 25.2 °C | 16.0 °C | 5.0 °C | 55.6 mm | 1.2 mm | — | — |
| September | 38.2 °C | 25.3 °C | 8.0 °C | 28.3 °C | 18.9 °C | 7.7 °C | 22.2 °C | 12.0 °C | -2.6 °C | 71.7 mm | 1.3 mm | — | — |
| October | 36.7 °C | 18.7 °C | -3.0 °C | 24.7 °C | 12.5 °C | -0.8 °C | 20.0 °C | 7.1 °C | -7.3 °C | 48.3 mm | 1.3 mm | — | — |
| November | 30.5 °C | 11.2 °C | -6.1 °C | 21.9 °C | 6.4 °C | -6.8 °C | 19.2 °C | 2.7 °C | -16.5 °C | 34.8 mm | 1.5 mm | — | — |
| December | 22.2 °C | 4.9 °C | -12.9 °C | 14.8 °C | 1.4 °C | -14.8 °C | 16.2 °C | -1.8 °C | -21.1 °C | 30.4 mm | 1.3 mm | — | — |
Data Visualisations
Remove WatermarksCurrent Year Climate Trends vs Historical


Max Temperature this Year | 1 of 6
Climate 12-Month Moving Averages


Max Temperature 12-Month MA | 1 of 6
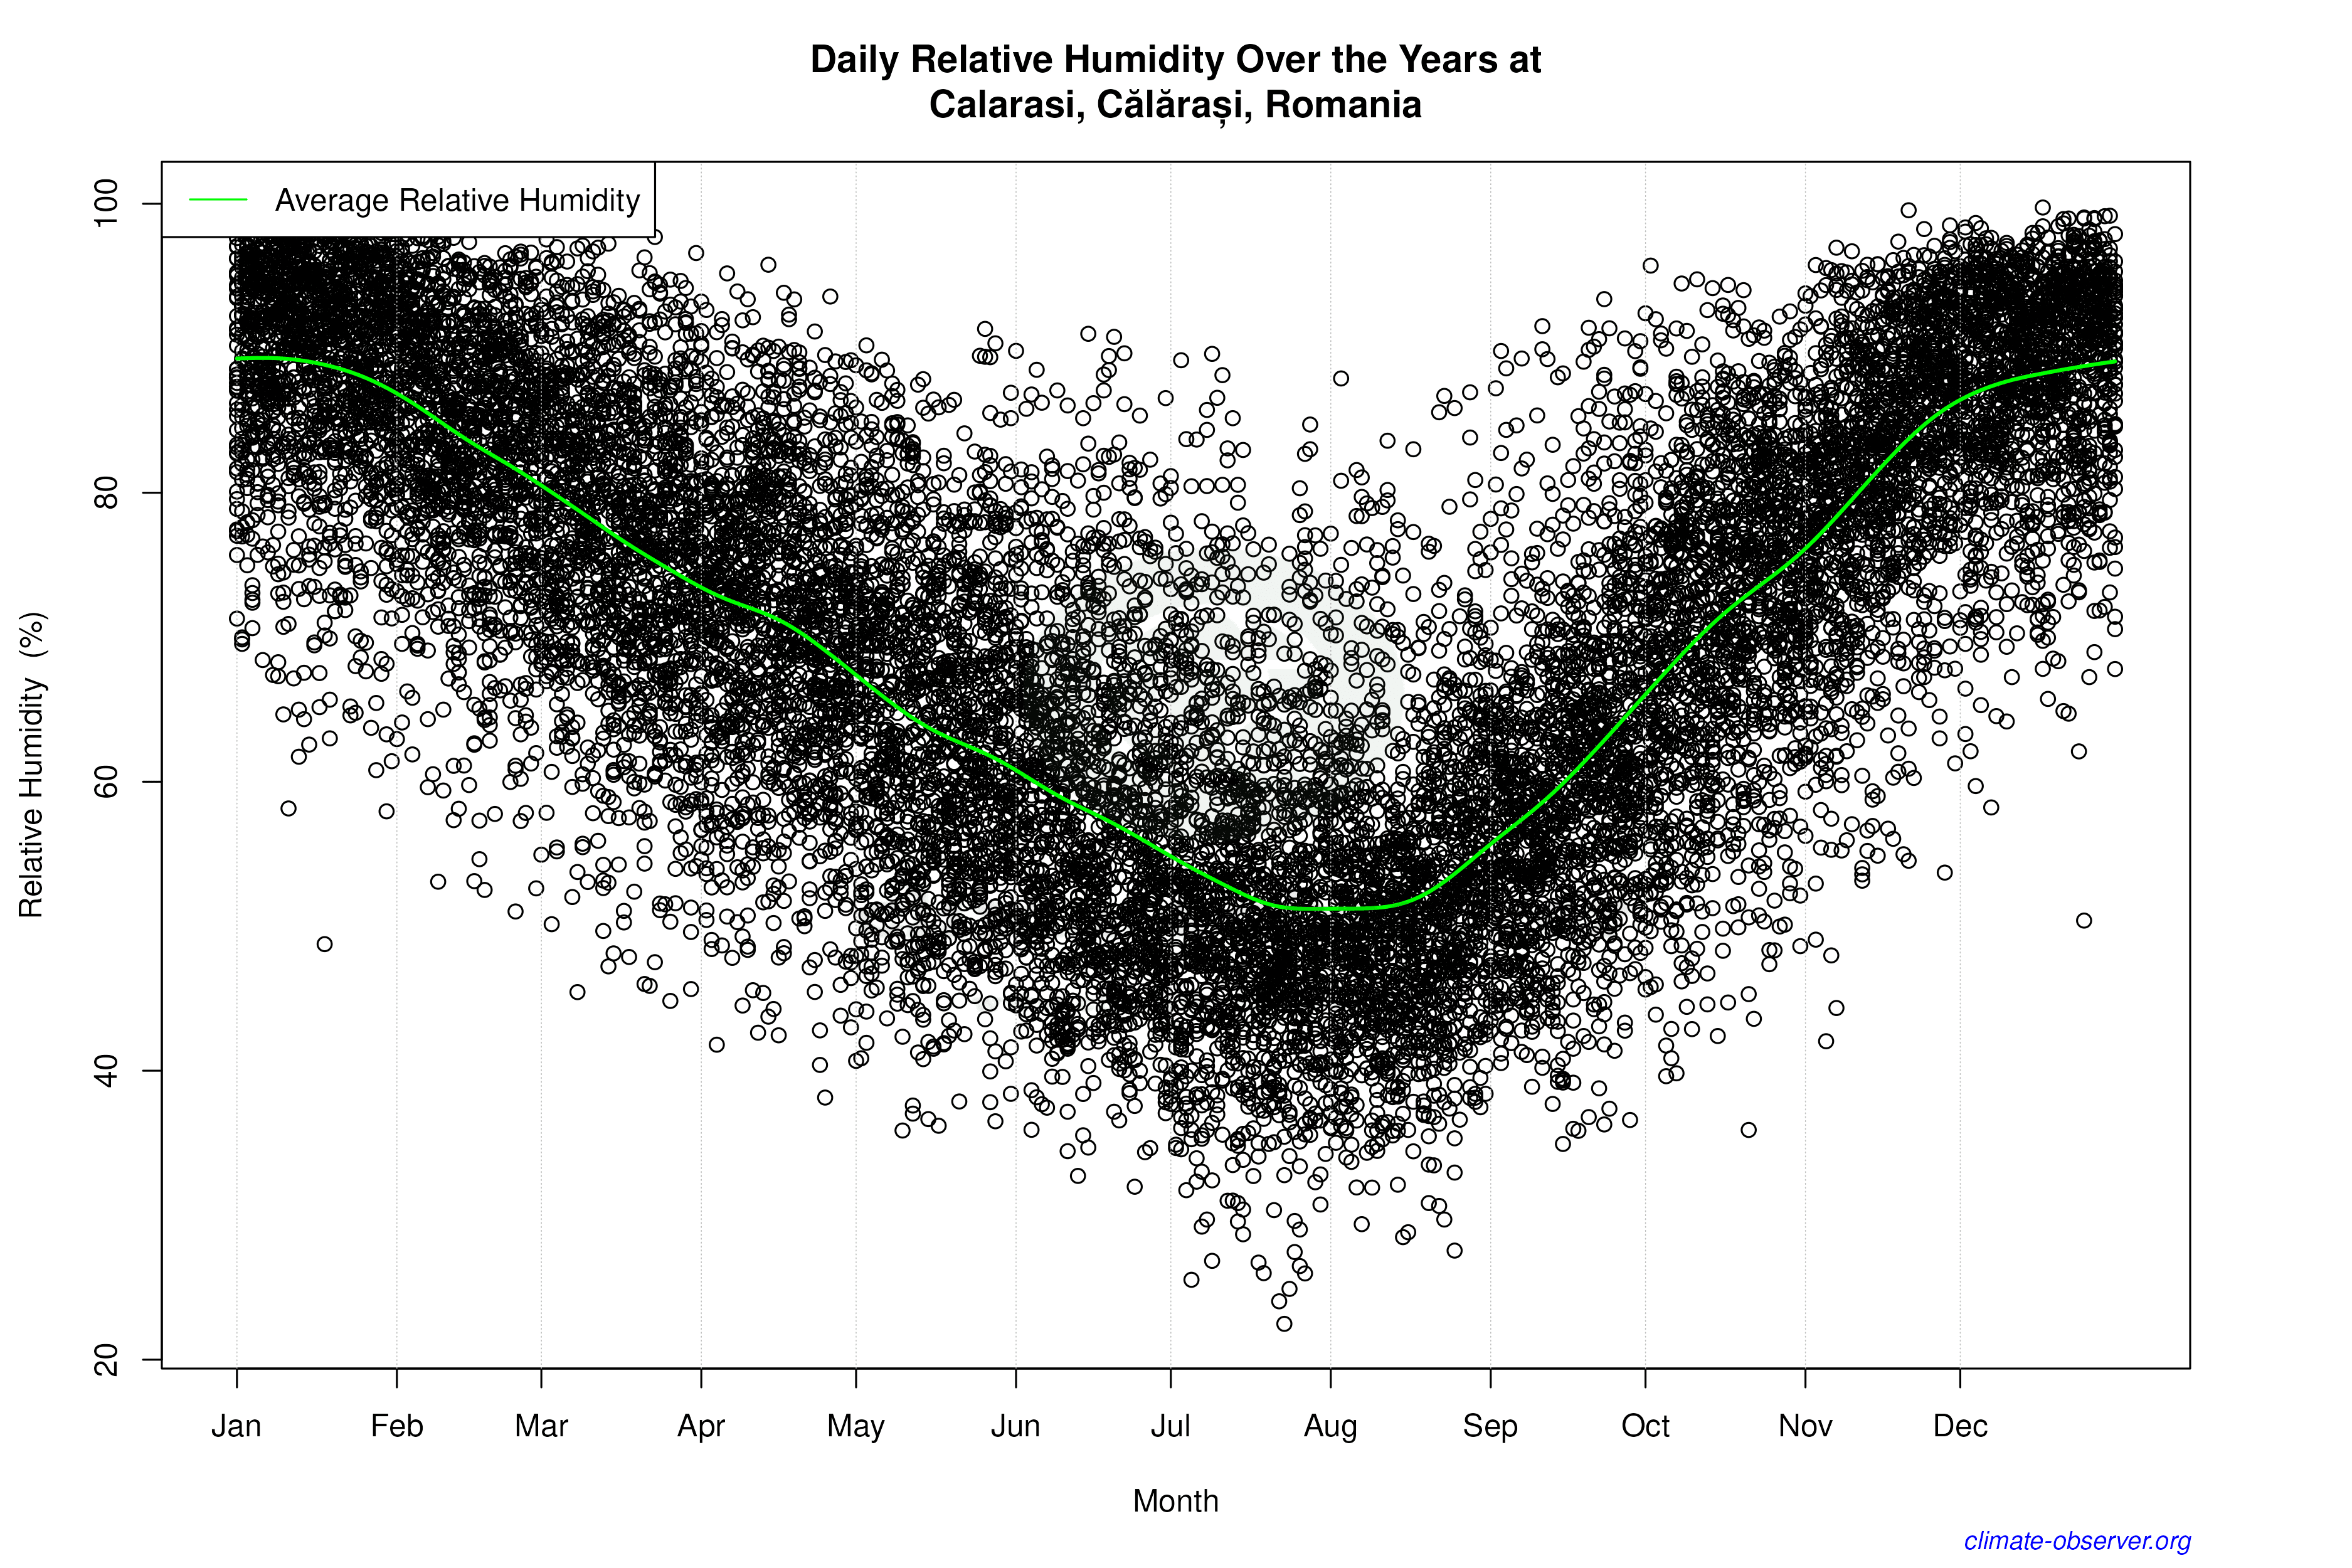
Daily Data Points and Averages Throughout the Year


Average Max Temperature Throughout Year | 1 of 5
