Climate for Station: Coloso, Puerto Rico, Puerto Rico [United States]
Loading live weather...
Climate Analysis & Overview
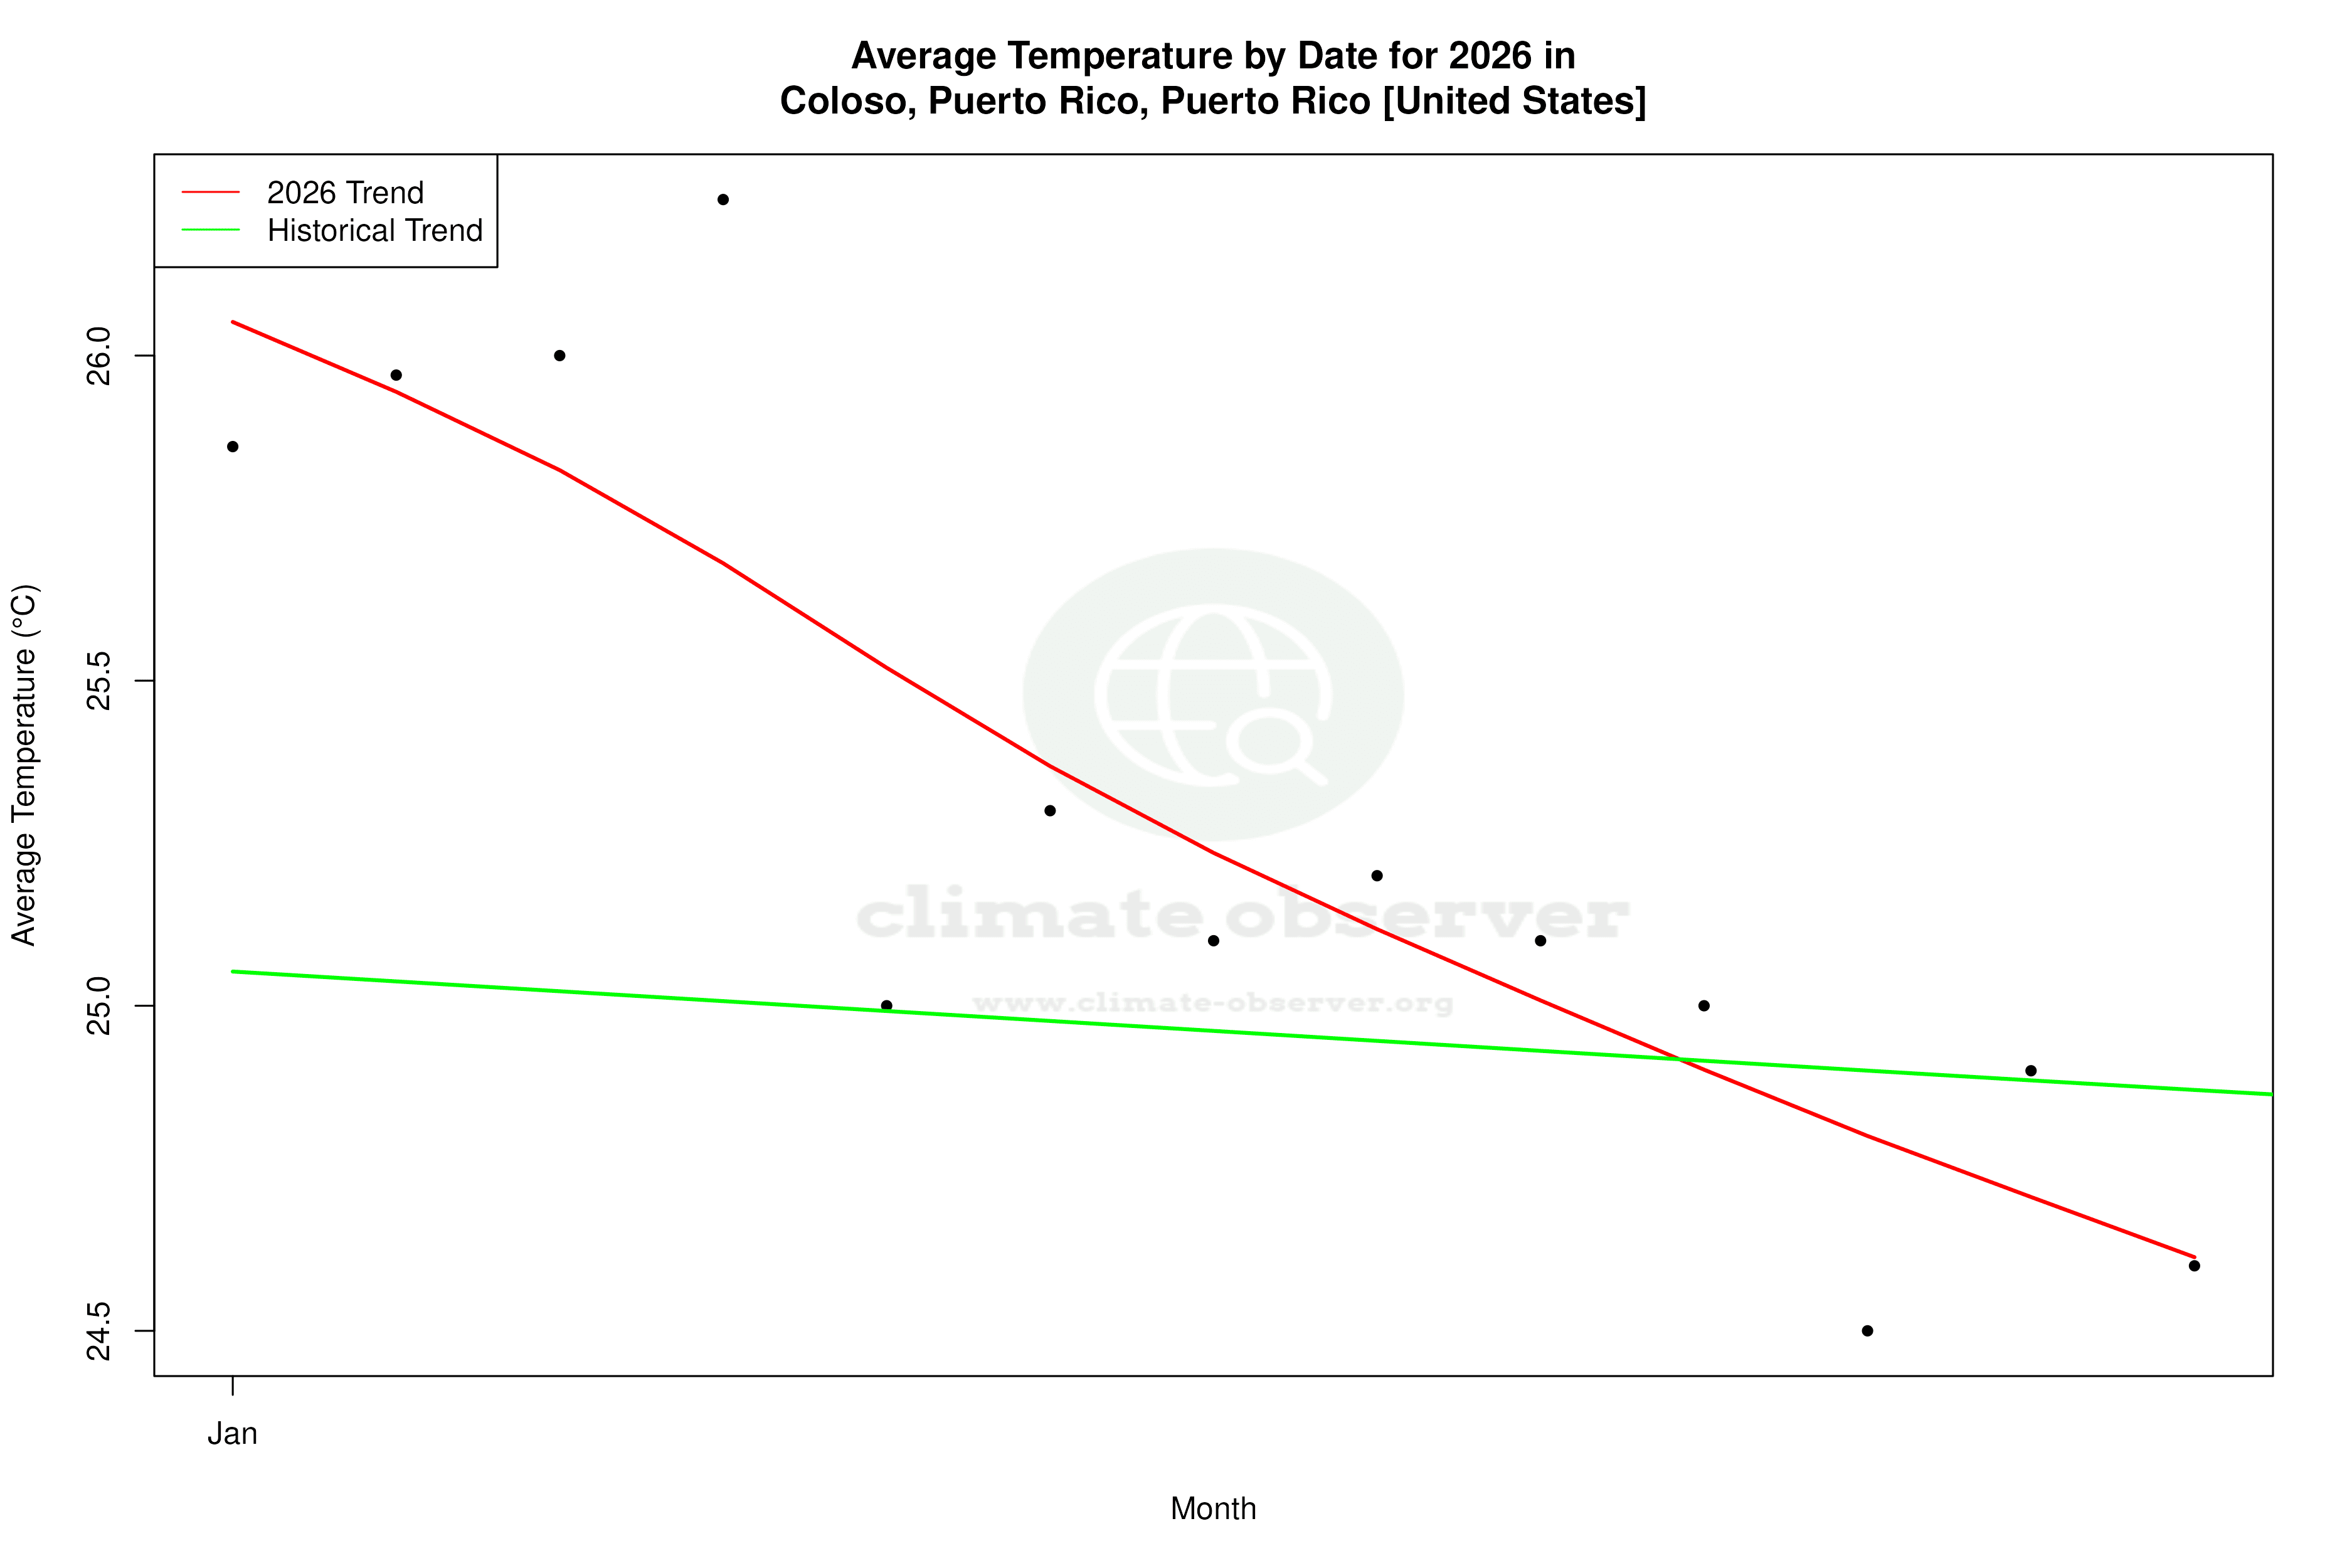
The climate profile for Guanábano, Aguada, Puerto Rico, reveals a complex interplay of warming and cooling trends over different time scales. While recent years have seen a notable warming in high temperatures, long-term data indicates a slight cooling. Precipitation patterns have become more evenly distributed, hinting at subtle shifts in local climate dynamics.
Tropical Climate Dynamics
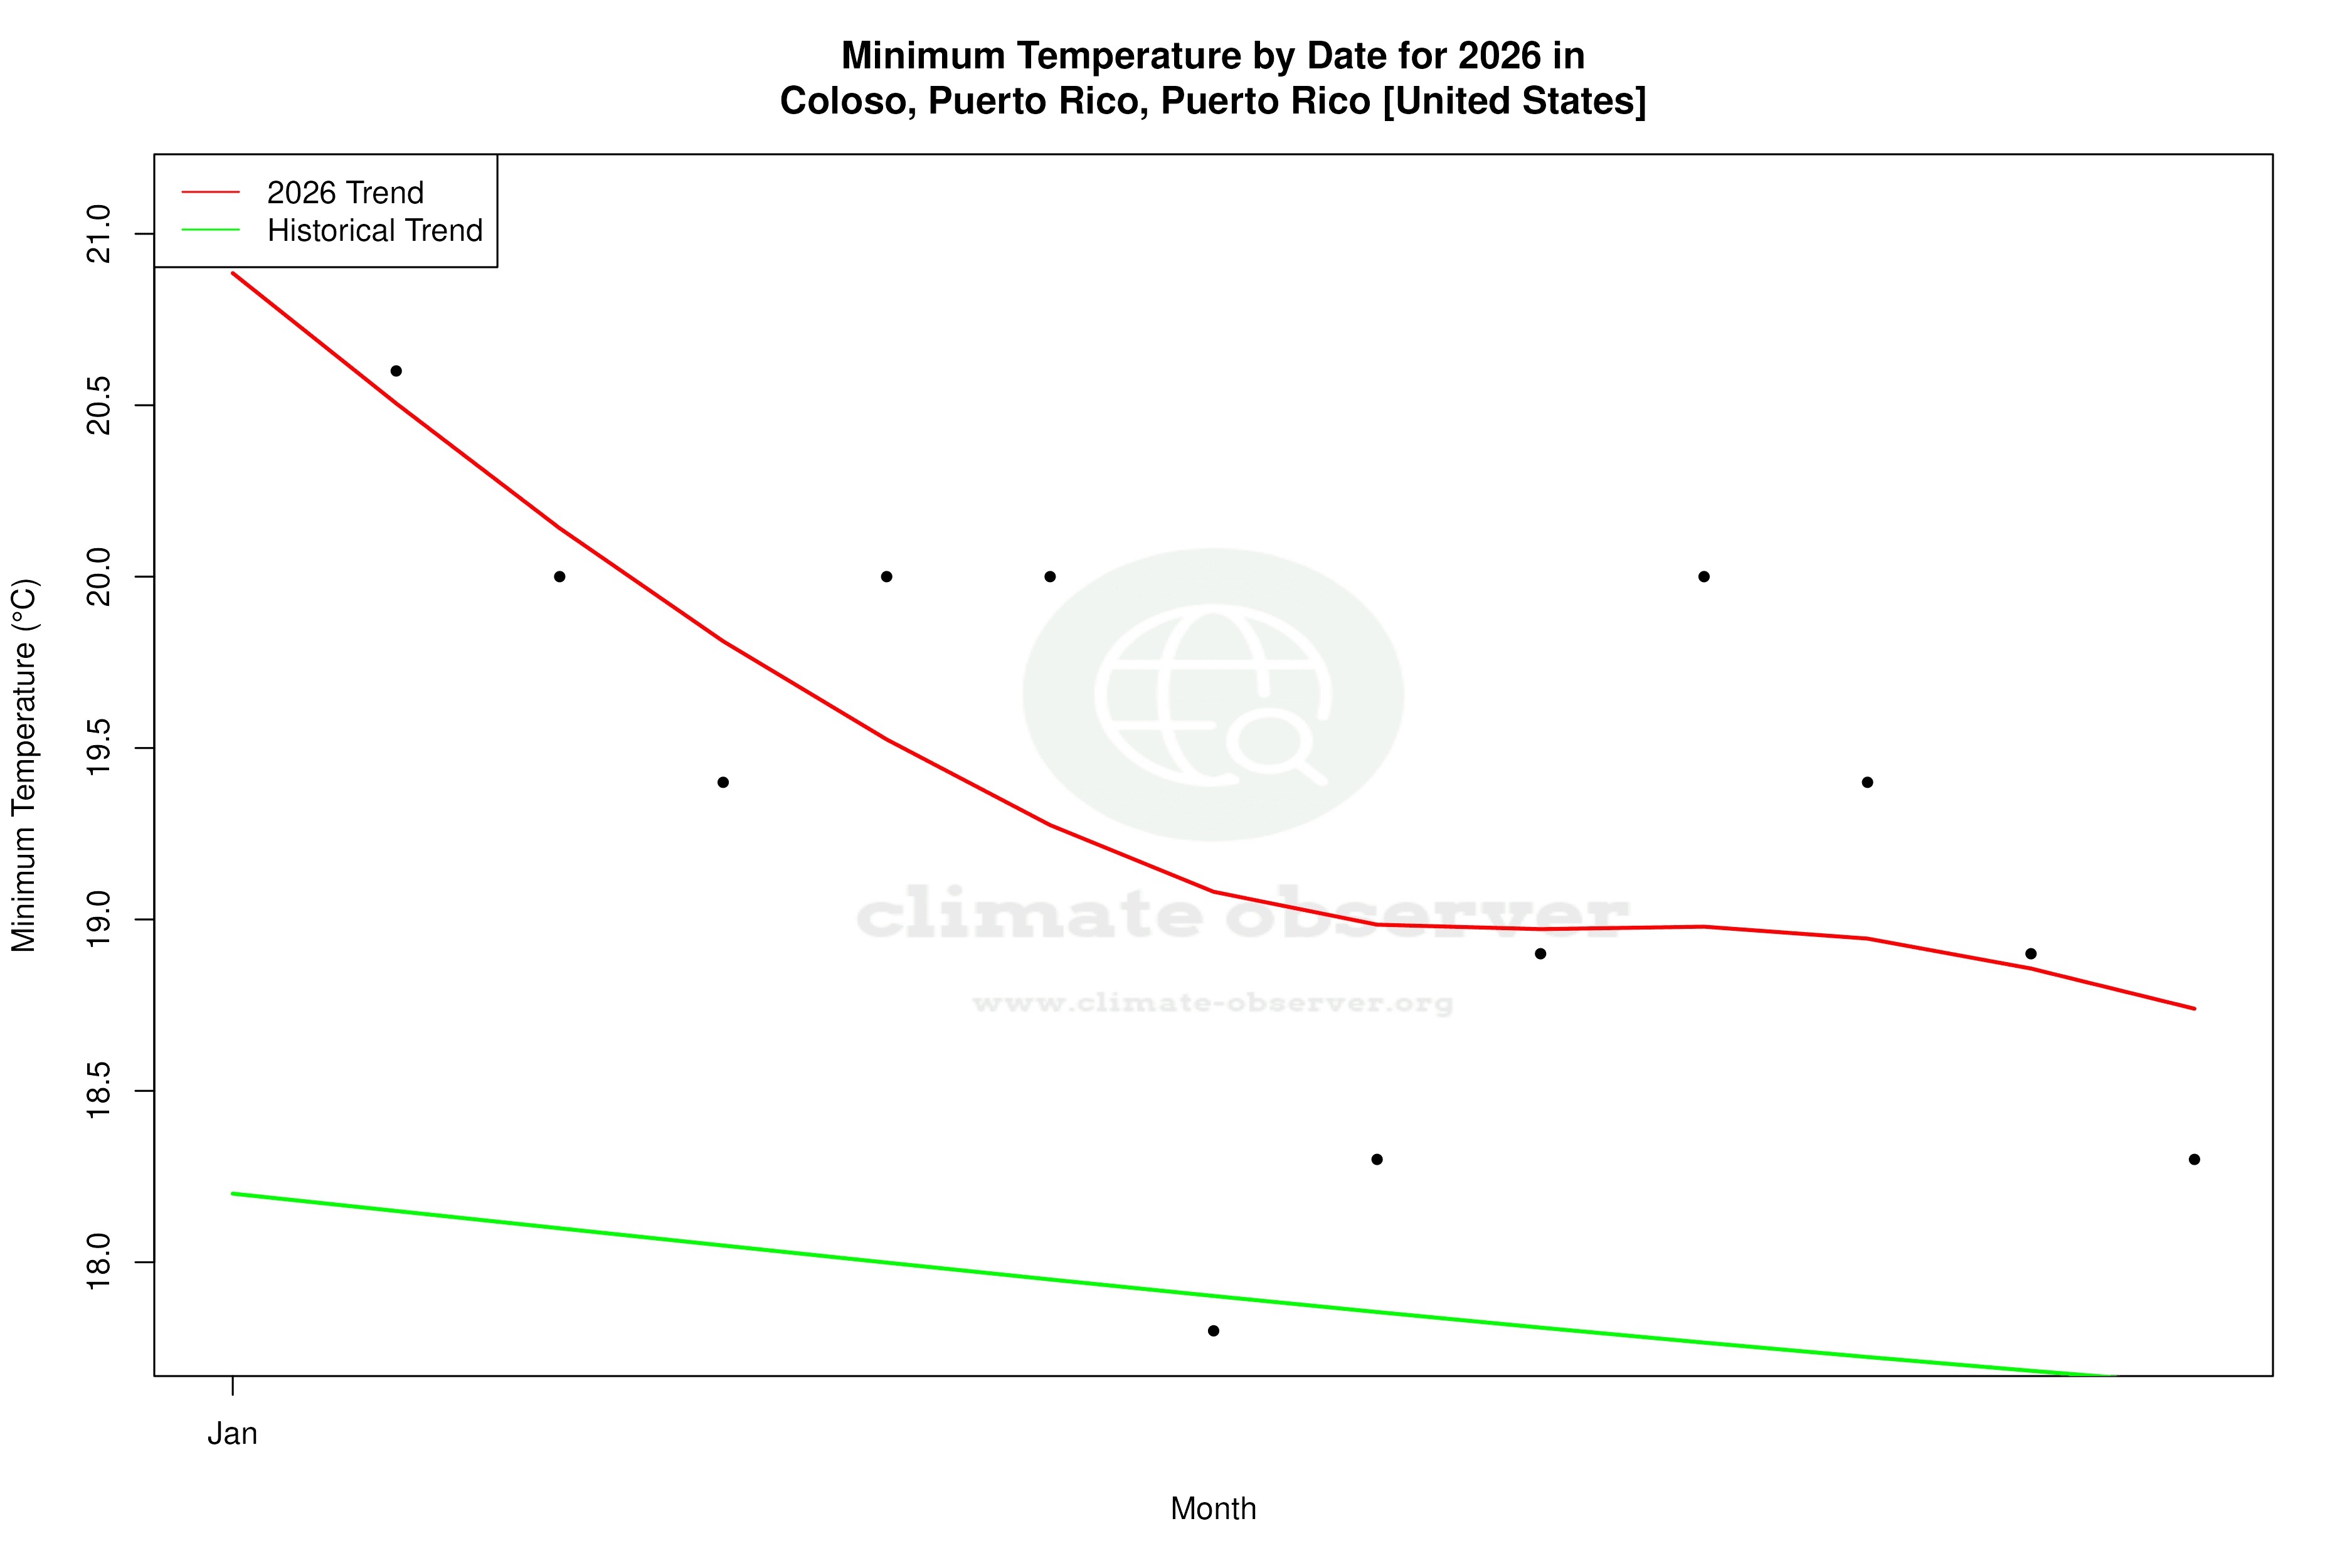
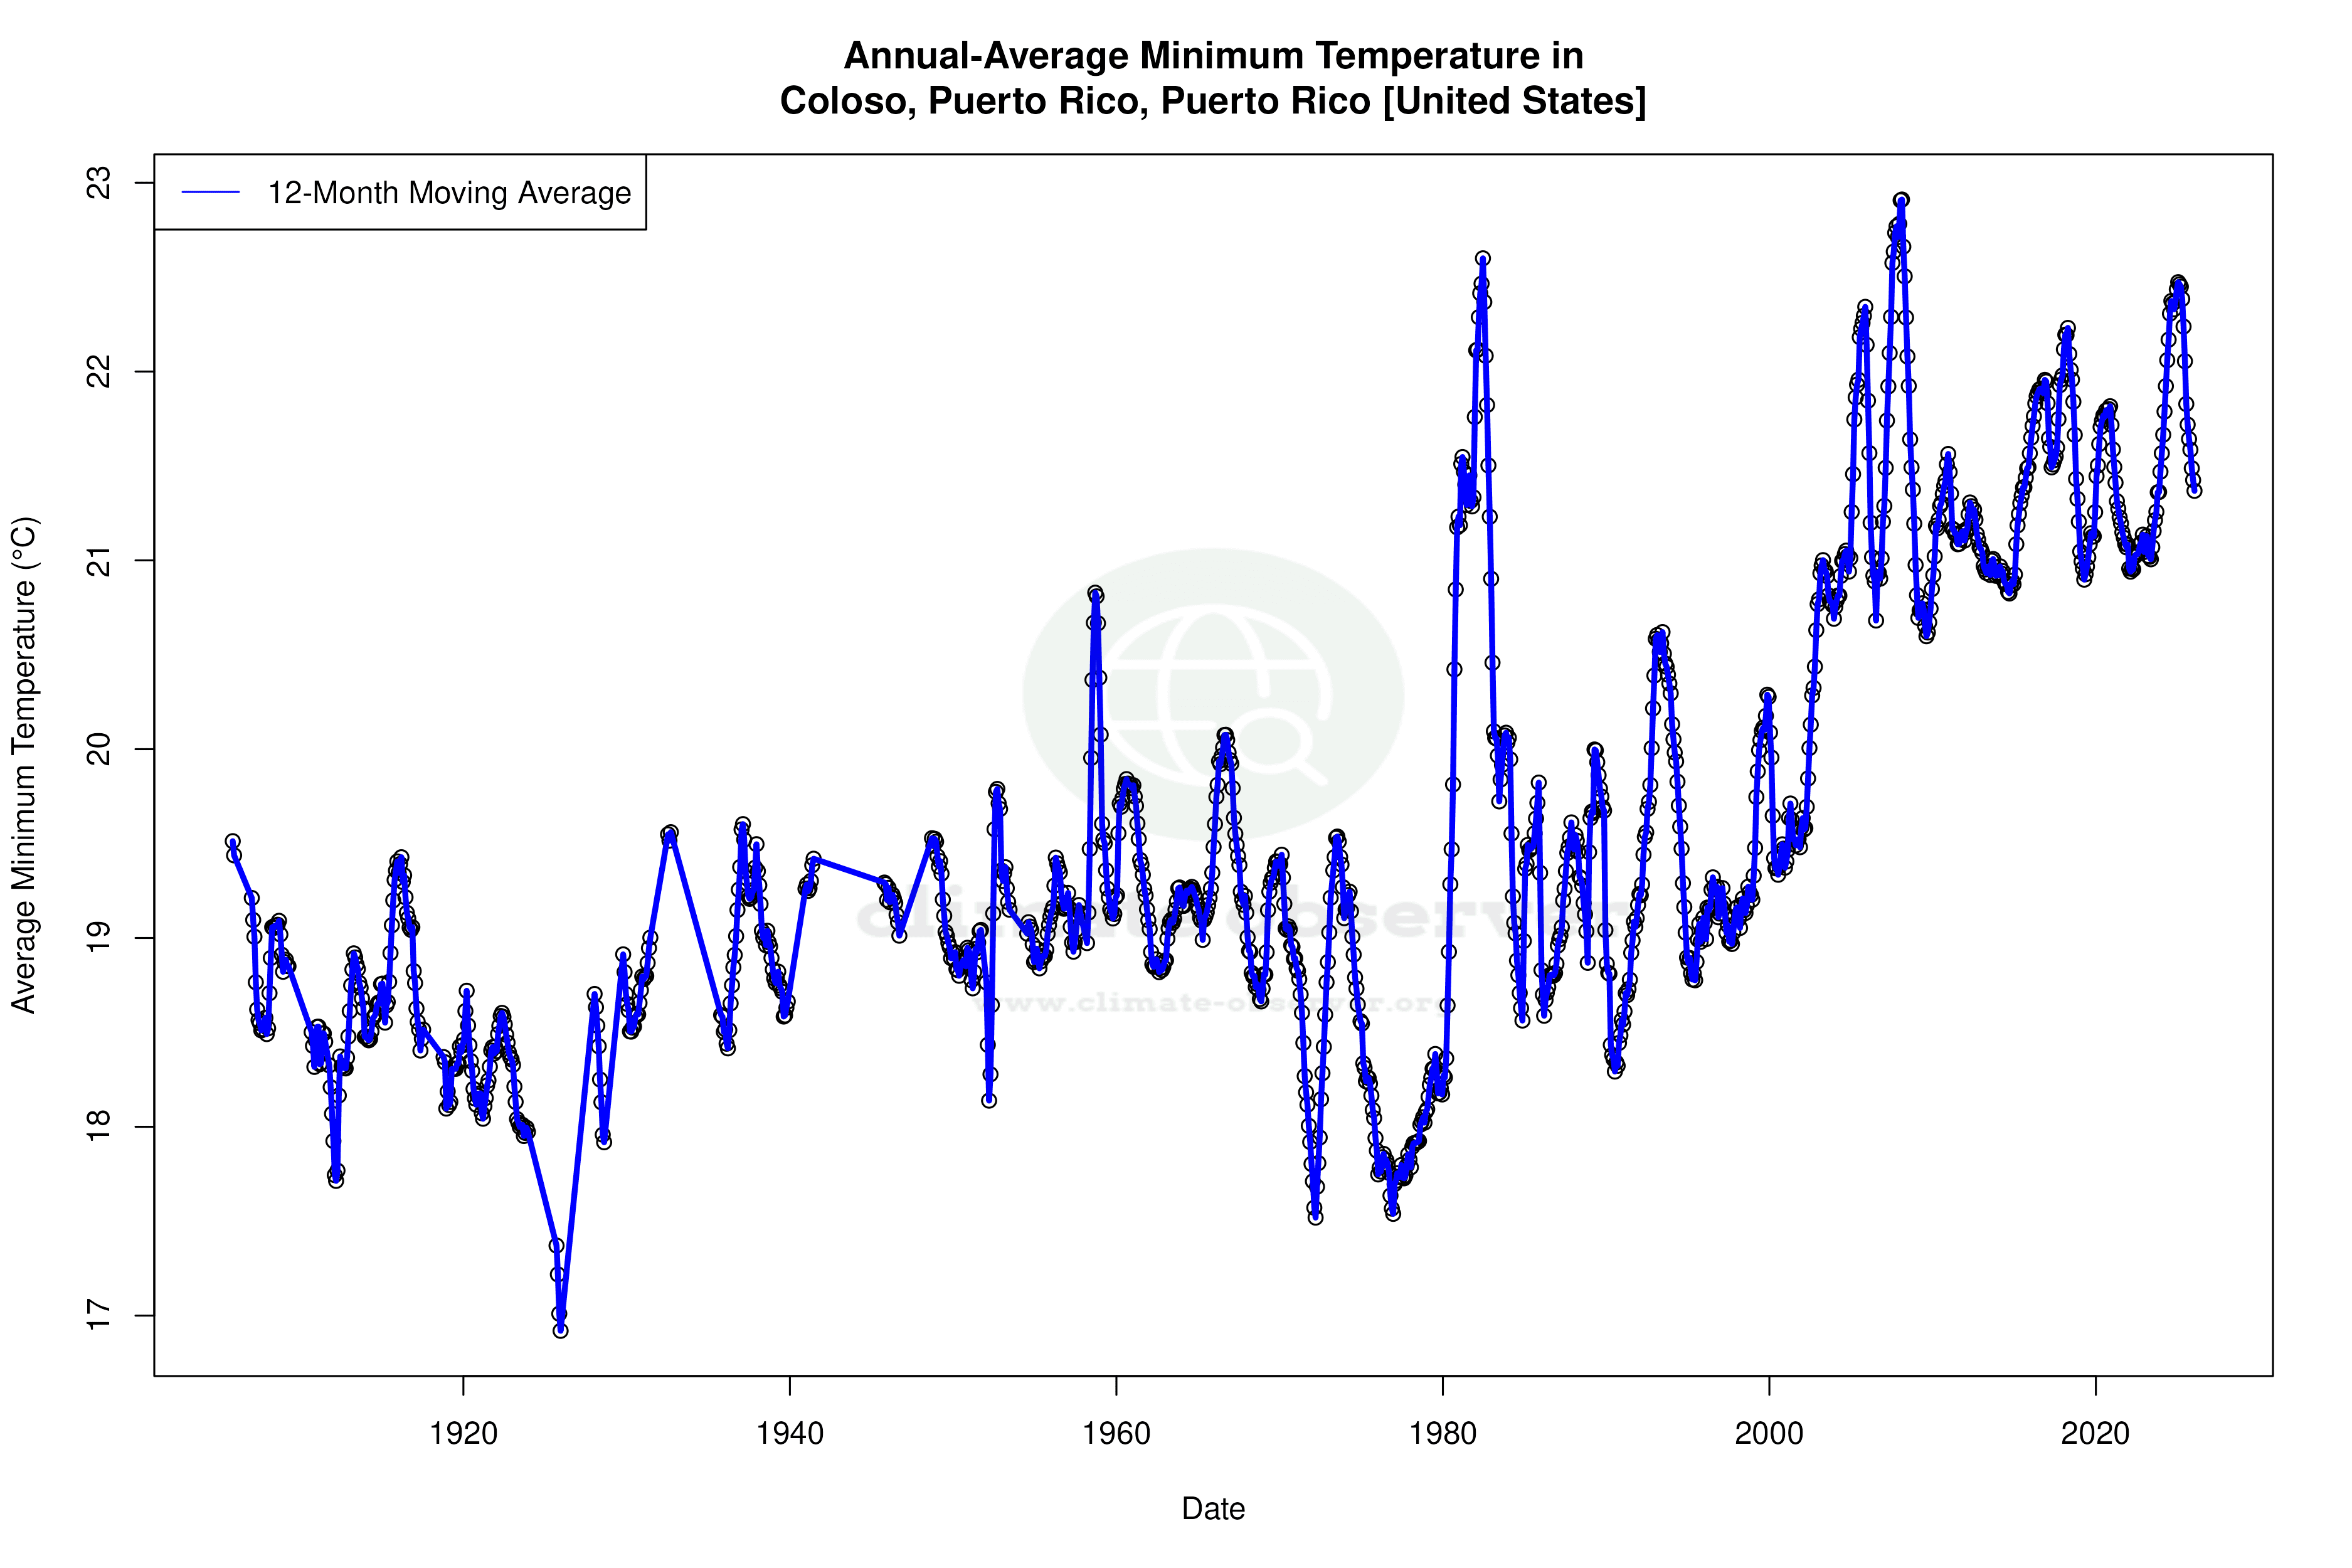
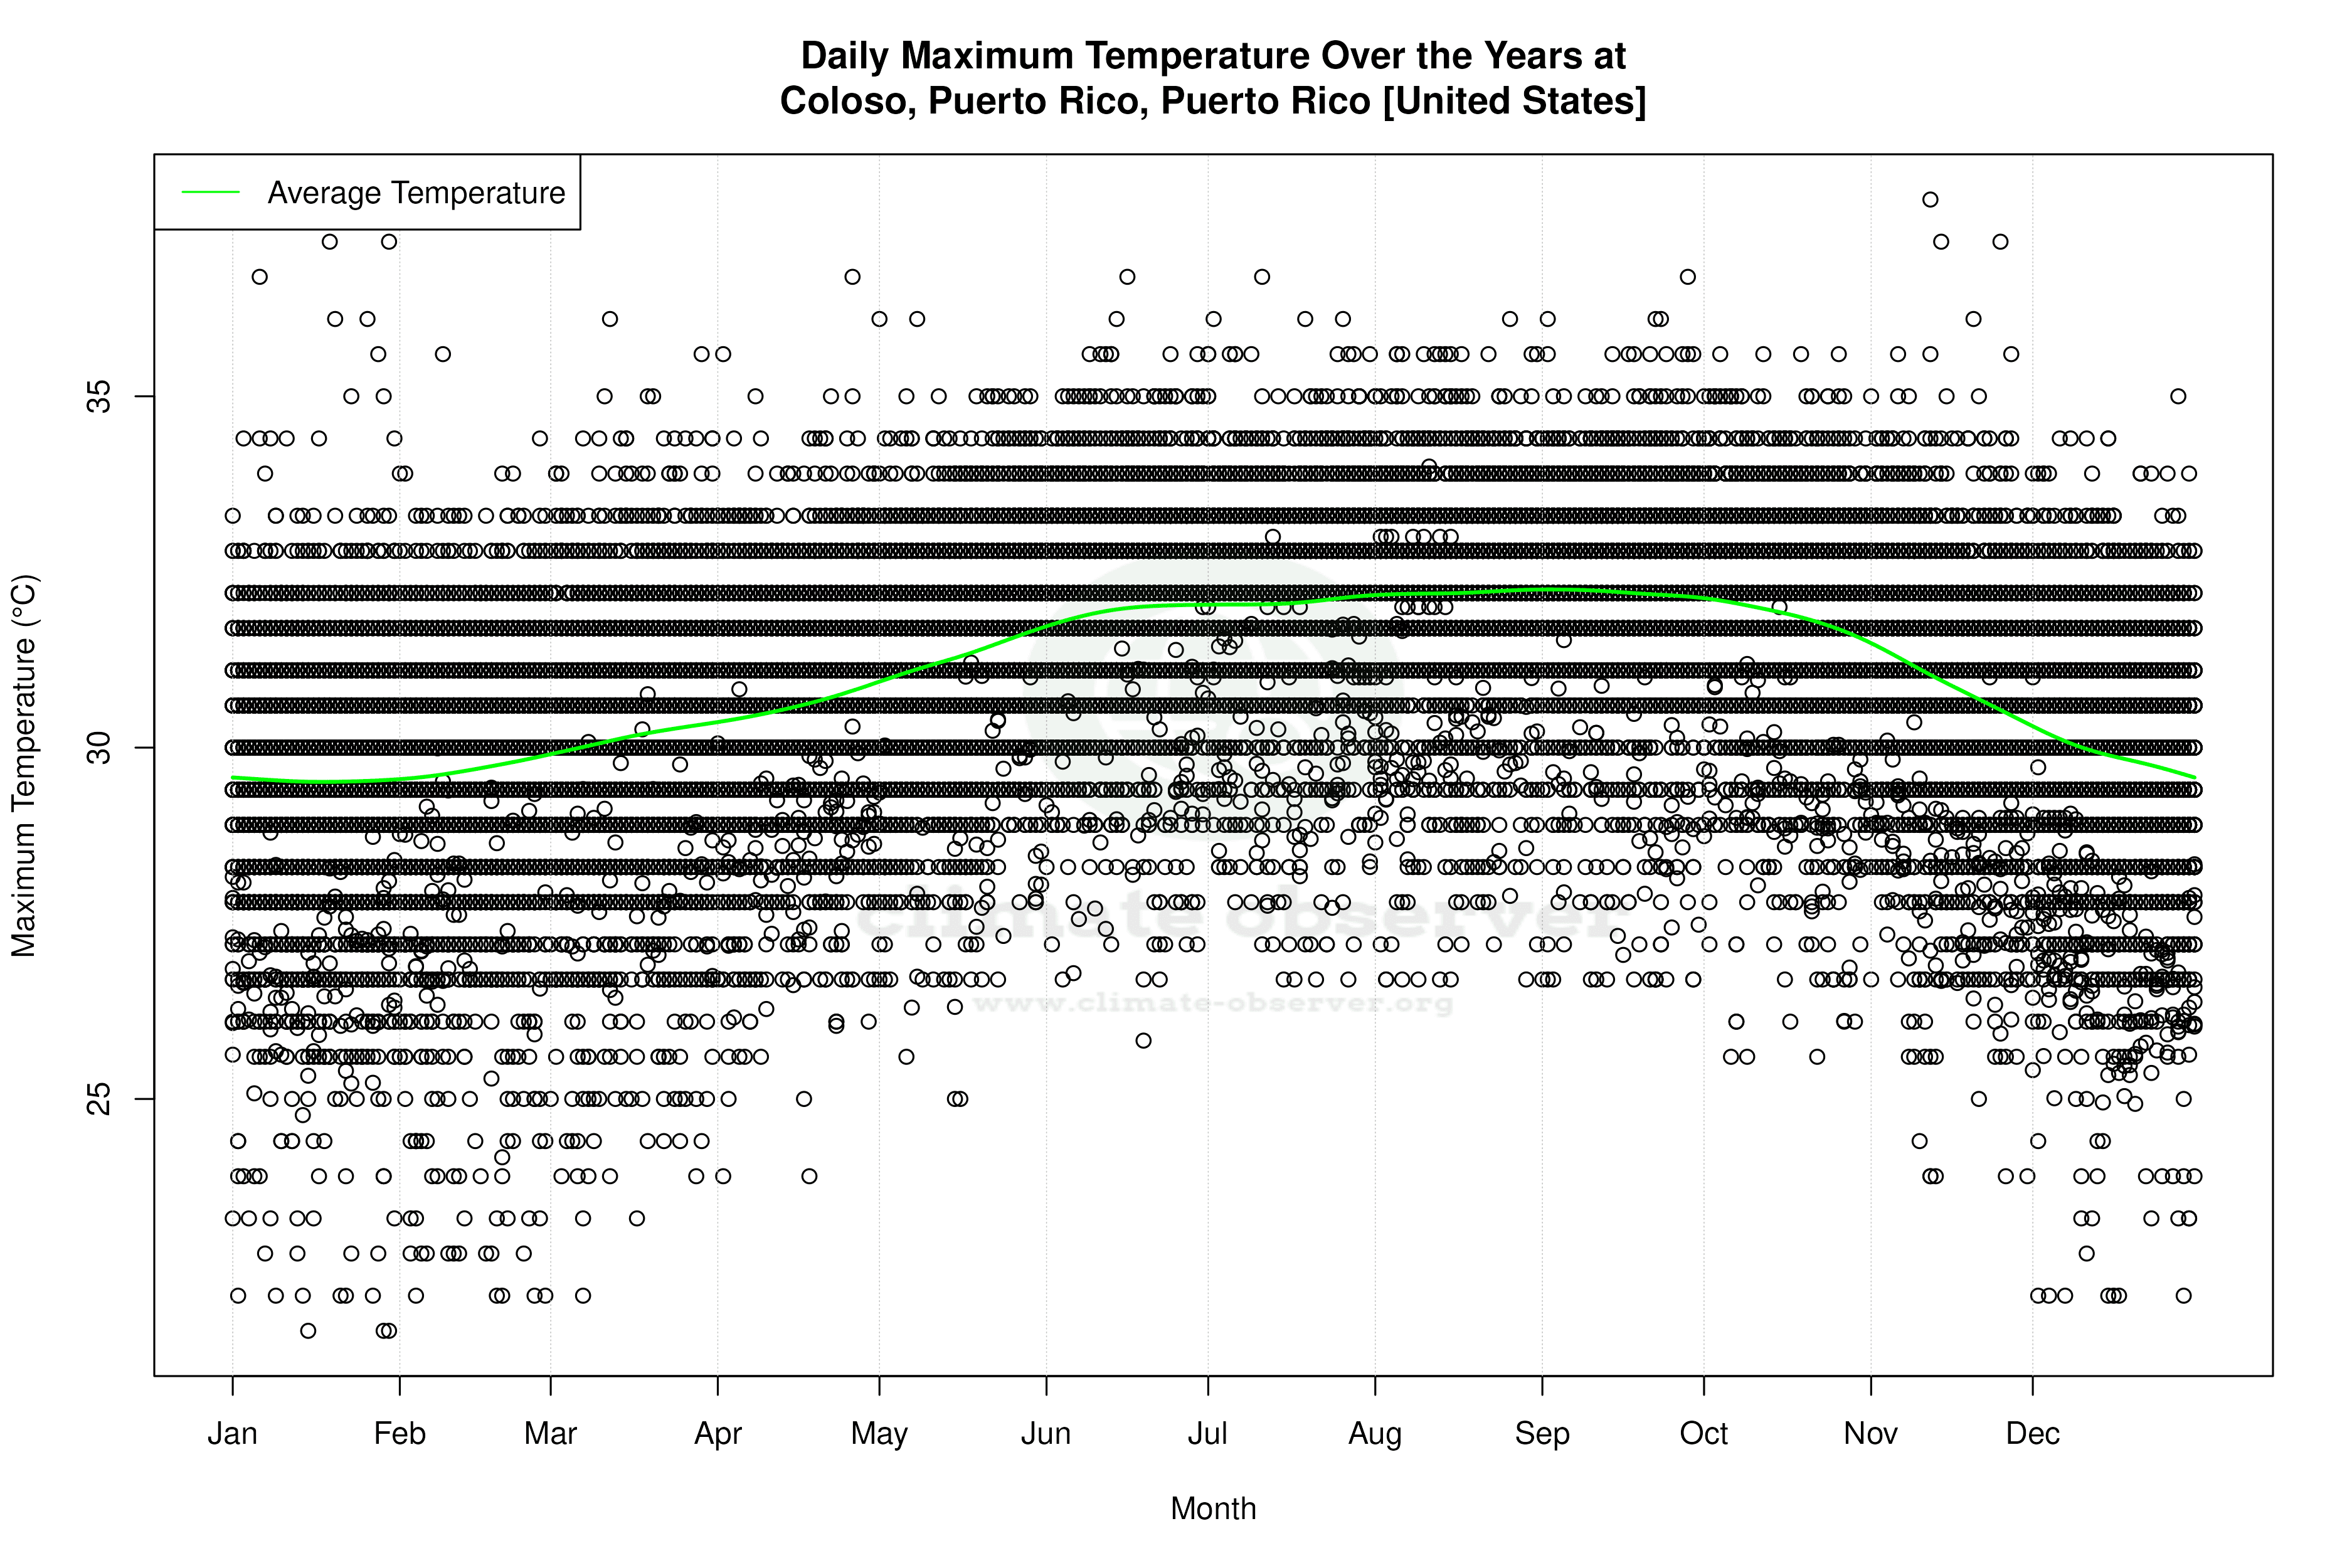
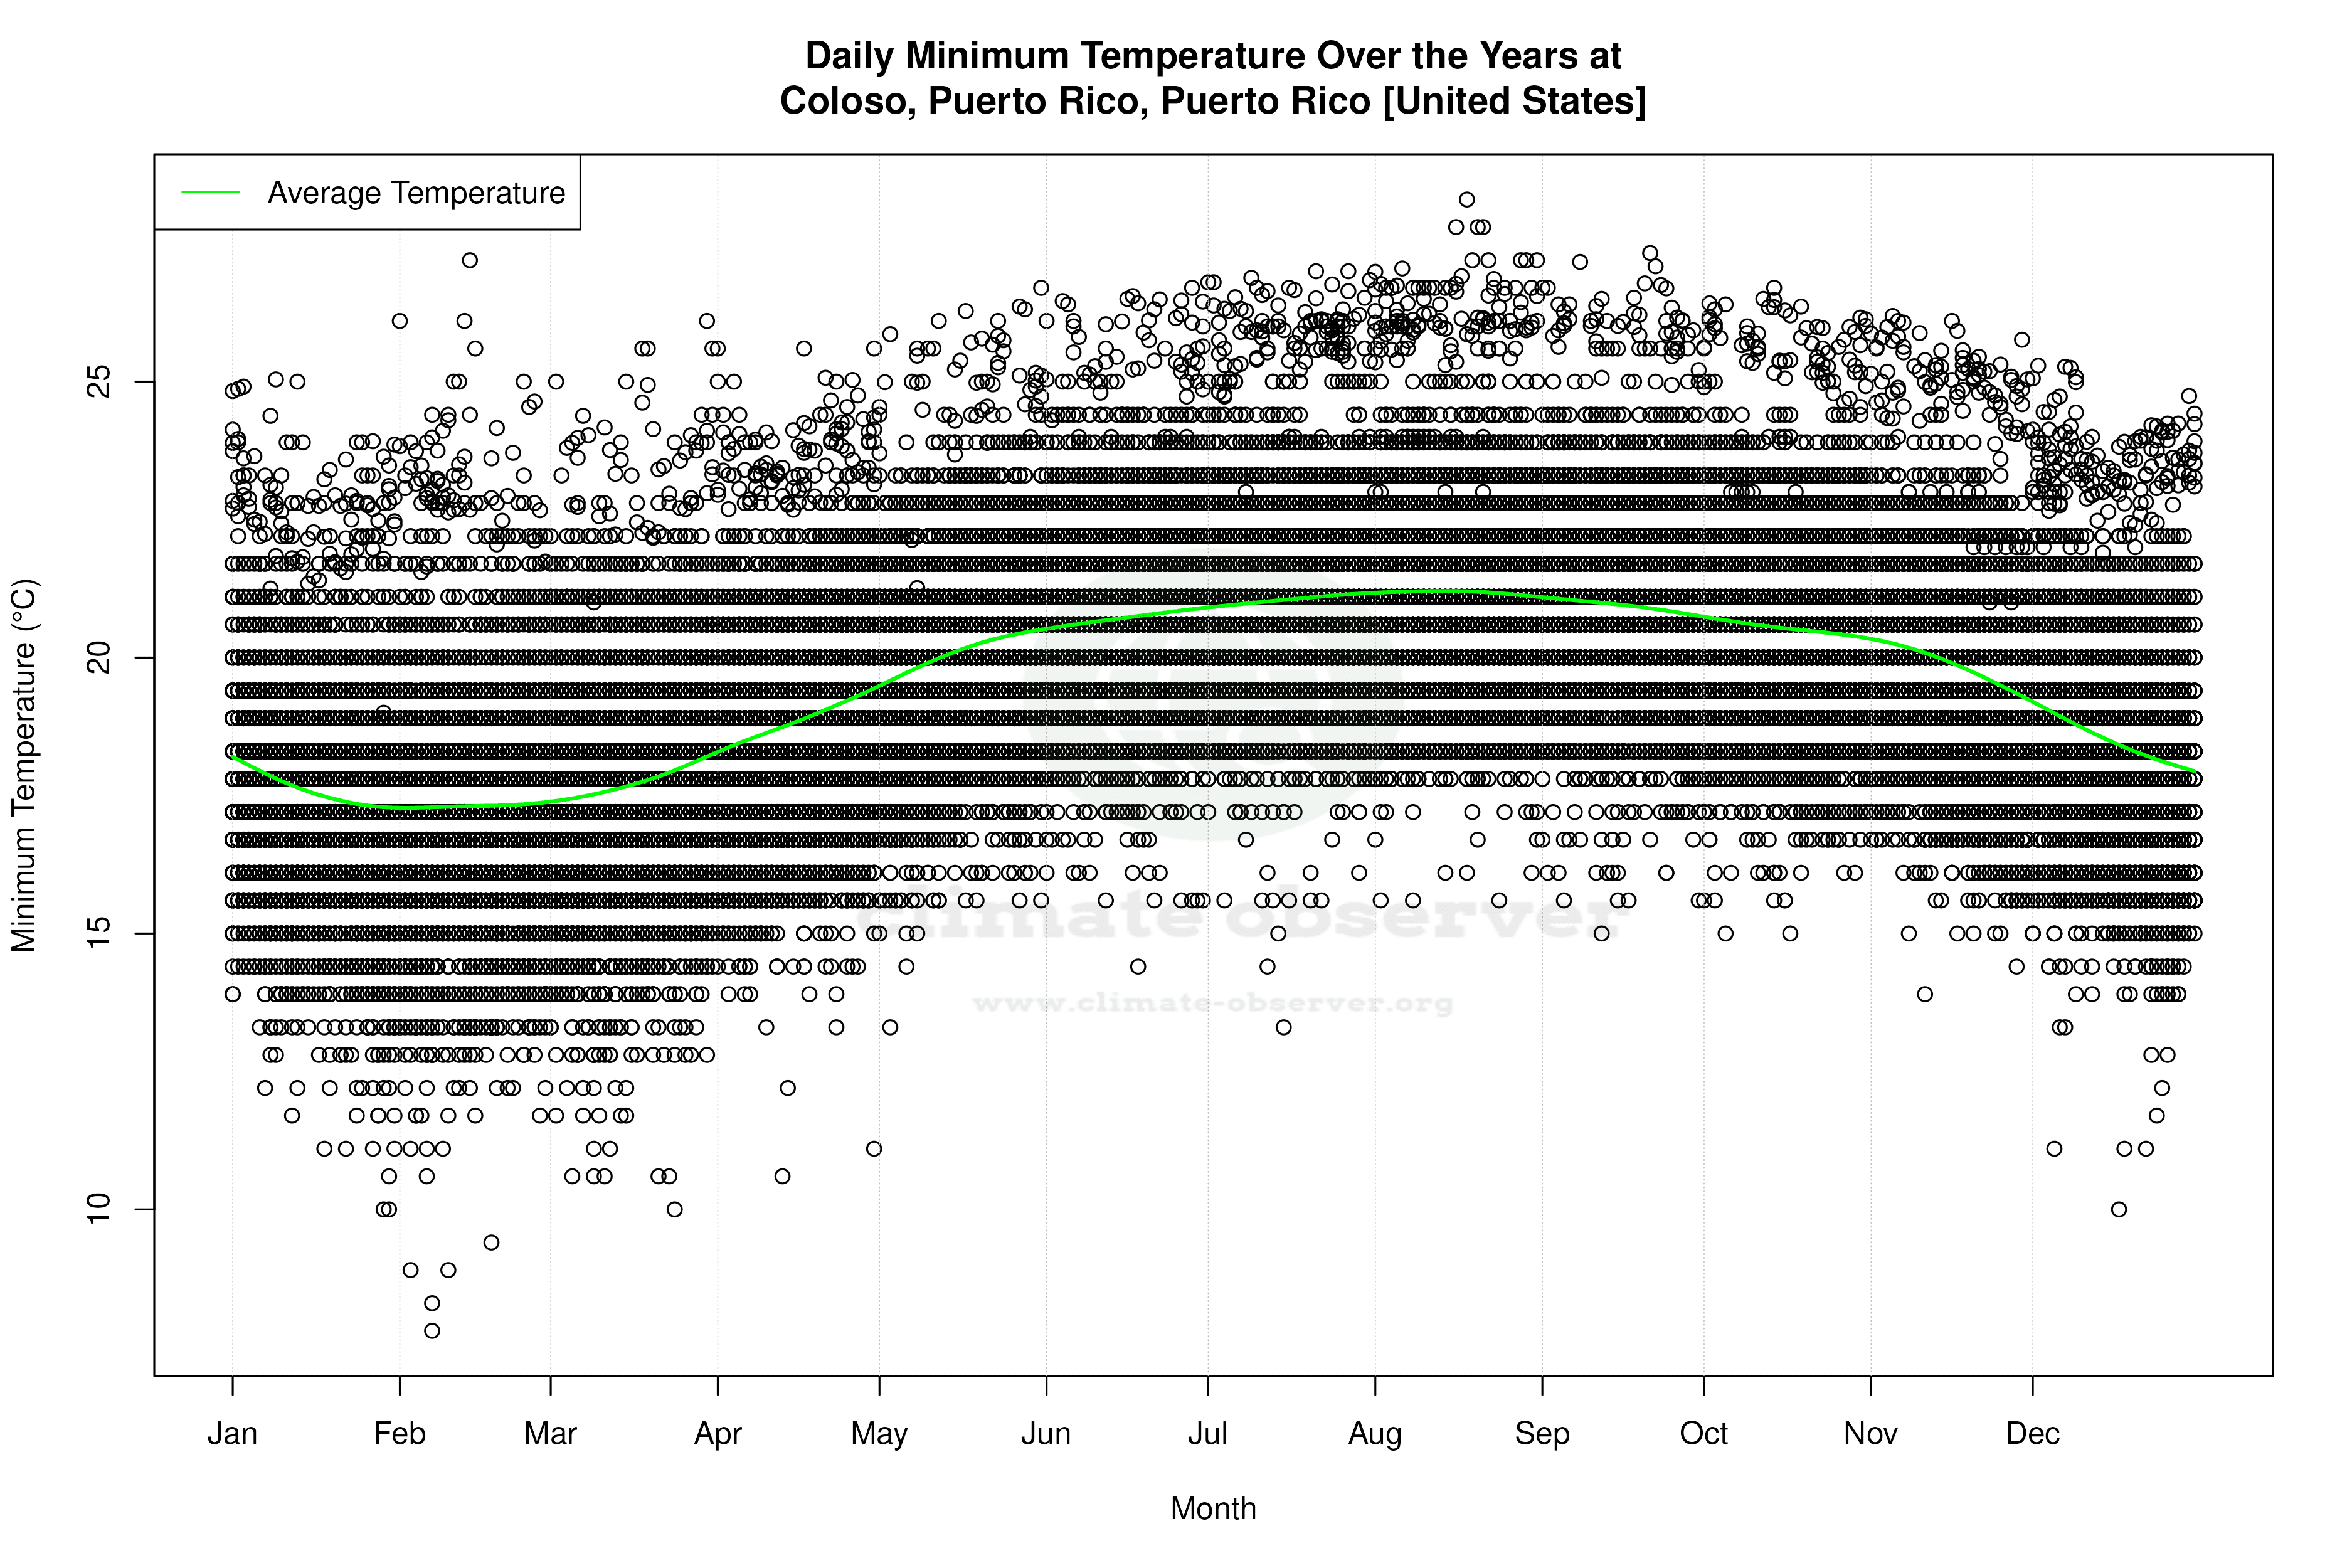
Guanábano, located at 18.38°N, 67.16°W, falls within the tropical rainforest climate zone according to the Köppen classification. This region is characterised by consistently warm temperatures and significant rainfall throughout the year. The local geography, with its proximity to the ocean and relatively flat terrain, plays a crucial role in moderating temperatures and influencing precipitation patterns. The station's all-time temperature trends show a slight cooling in high temperatures by 0.04°C (0.07°F), while low temperatures have risen by 0.25°C (0.45°F). This indicates a narrowing of the temperature range over the years.
Recent Thermal Shifts
Over the past decade, Guanábano has experienced a warming trend in high temperatures, with an increase of 0.98°C (1.76°F). This recent warming contrasts with the long-term cooling trend, suggesting a possible shift in regional climate patterns or short-term variability. The low temperatures have remained relatively stable over the past ten years, with a negligible change of -0.01°C (-0.01°F), indicating that night-time temperatures have not followed the same warming trend as daytime highs.
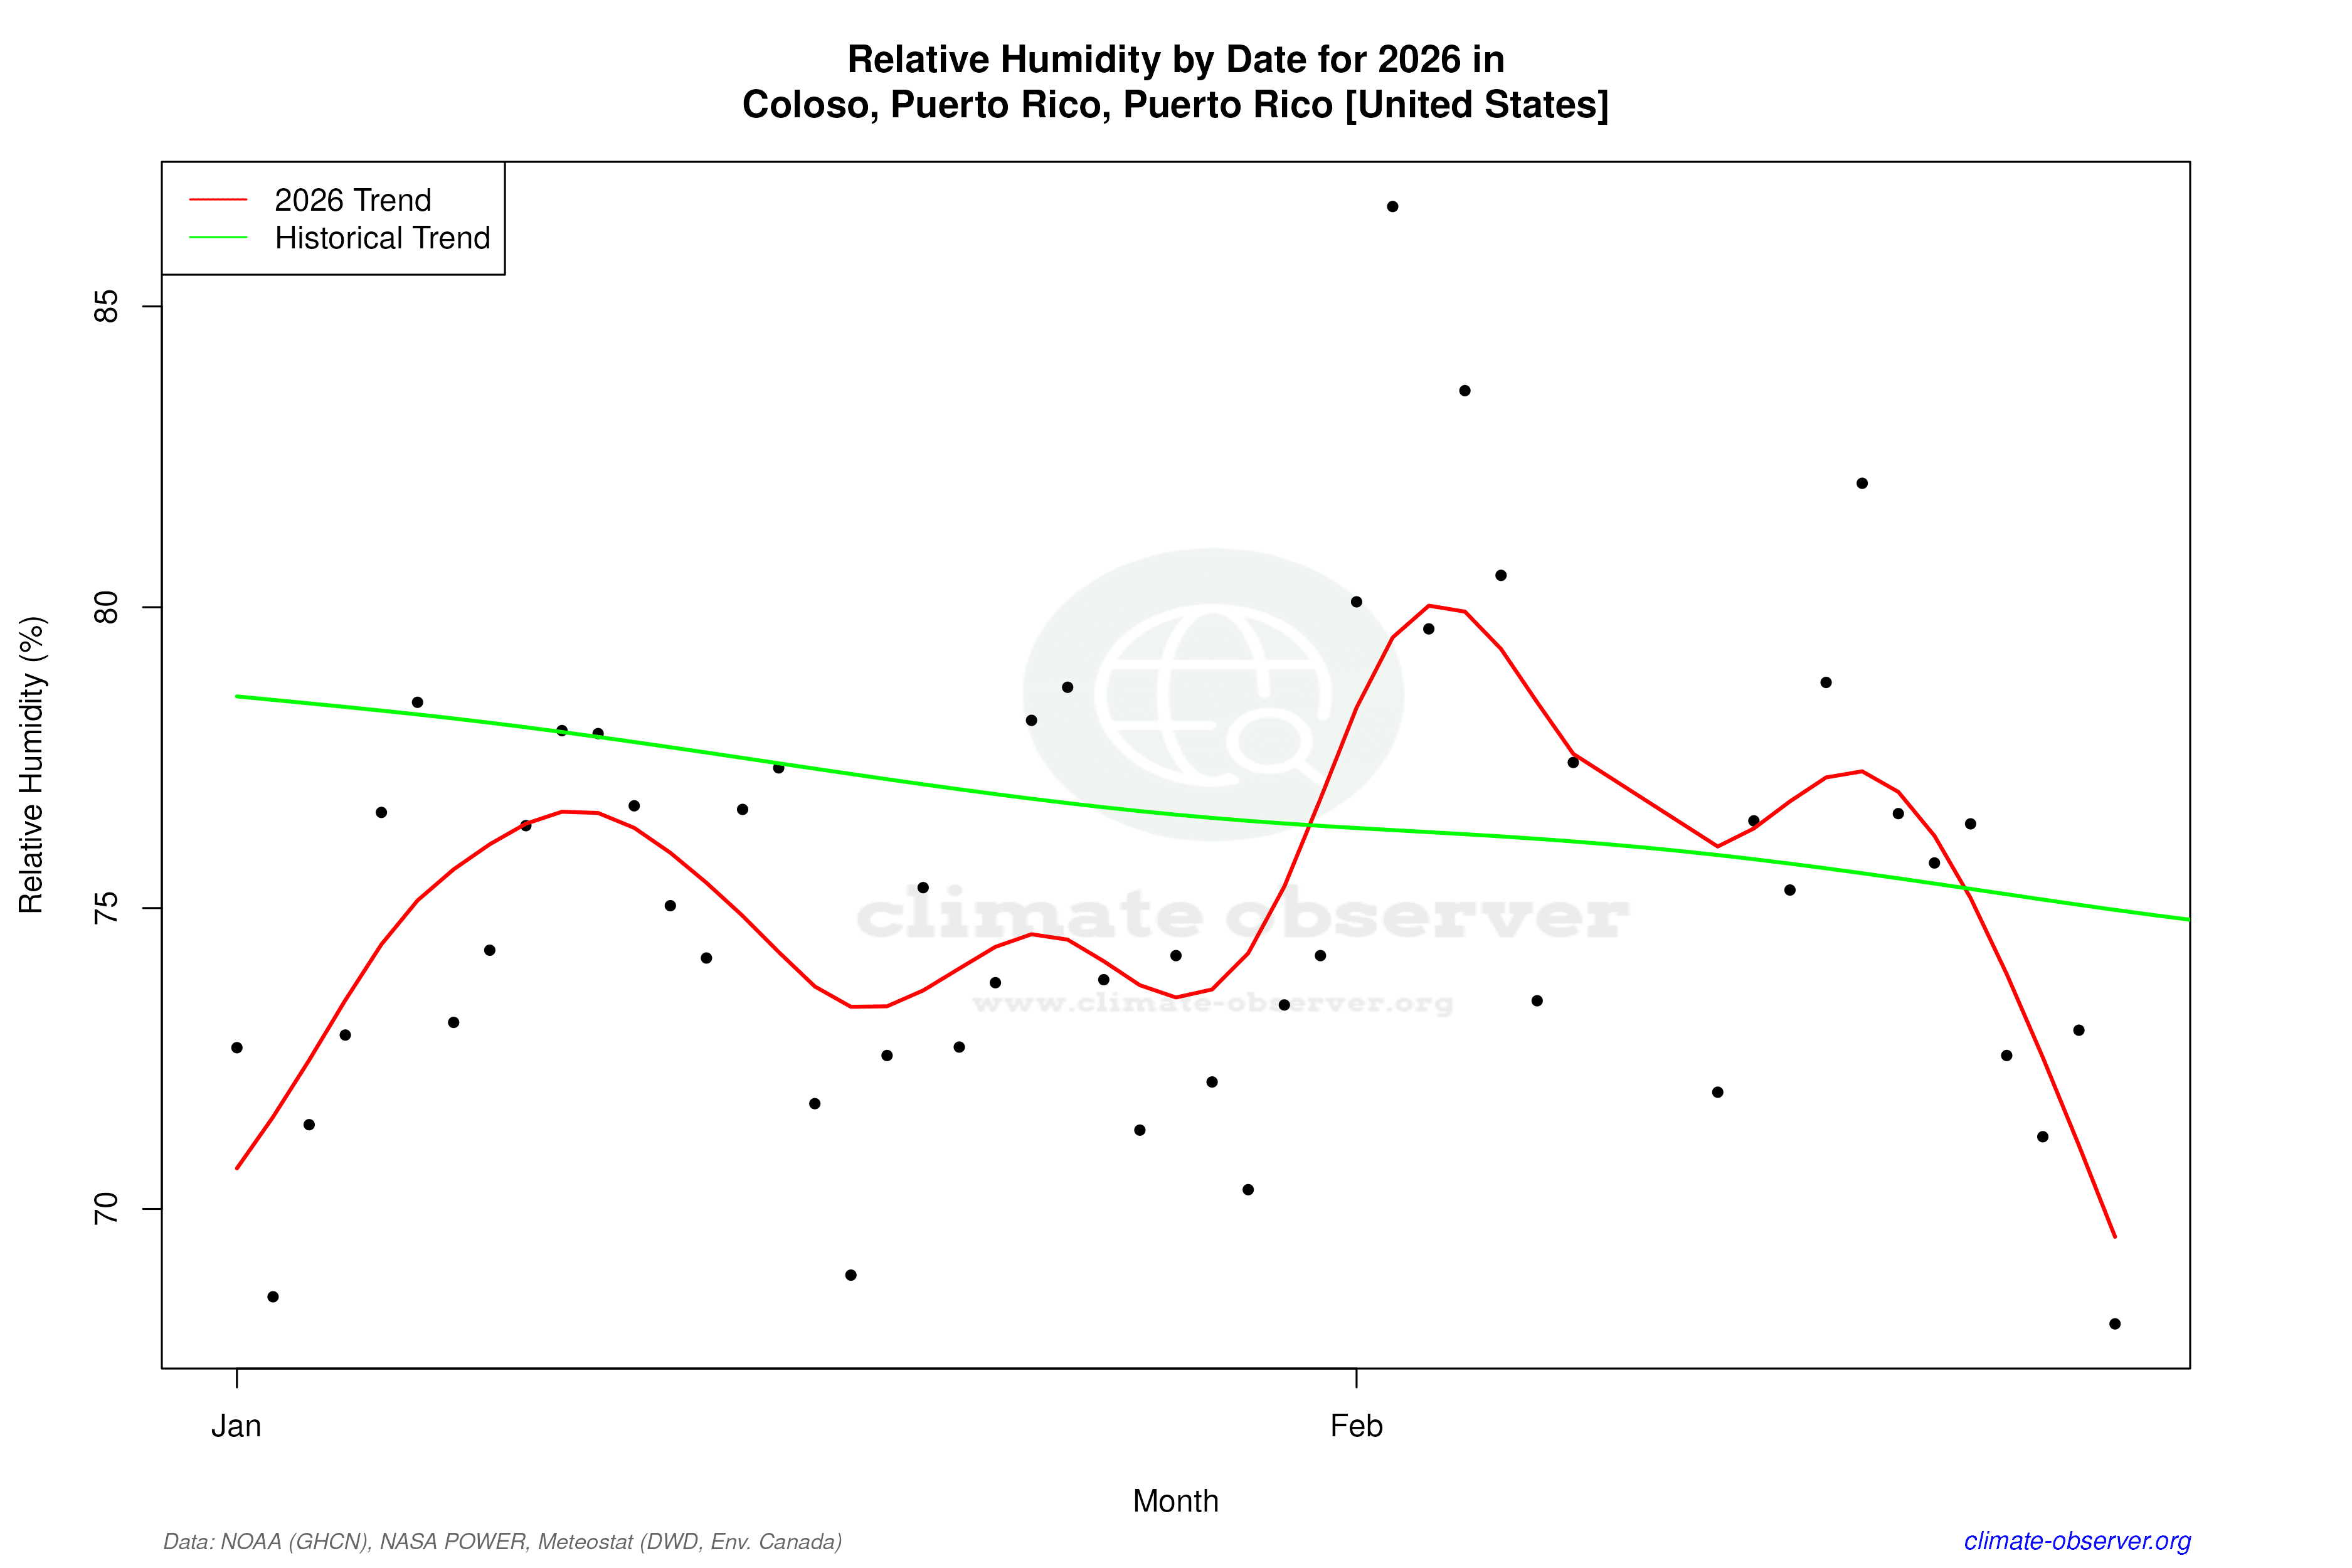
Precipitation Patterns and Distribution
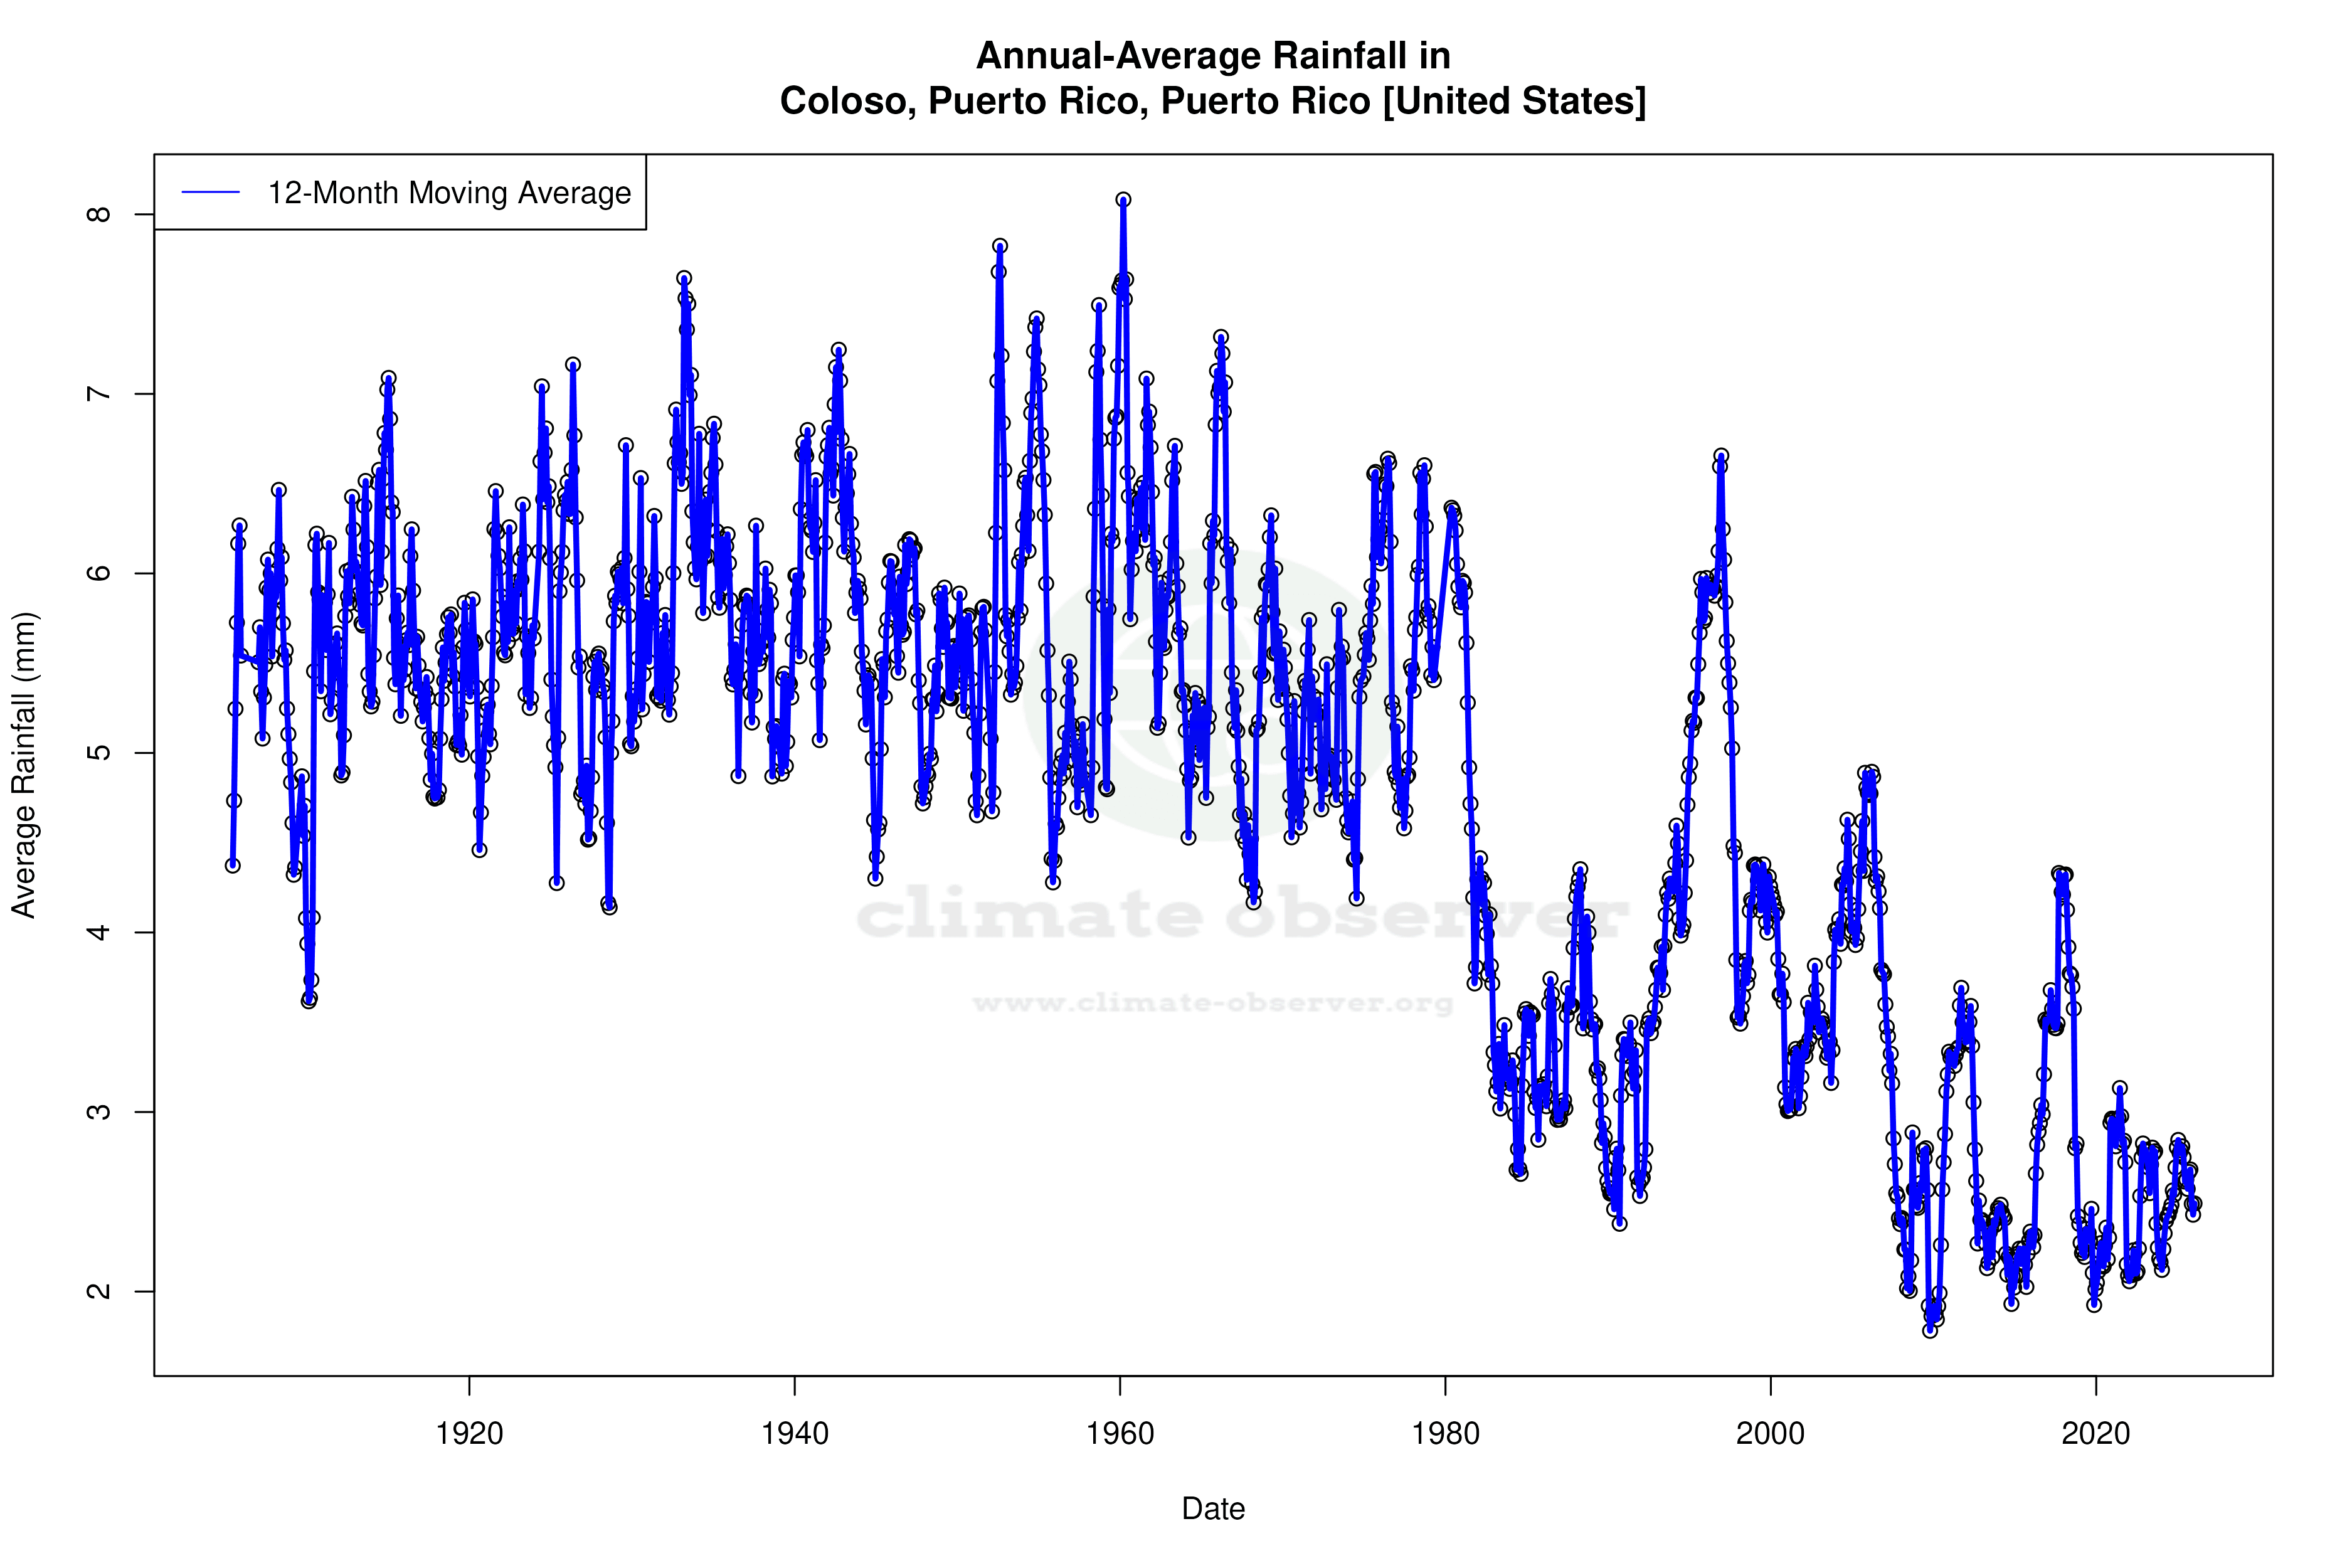
The Precipitation Concentration Index (PCI) for Guanábano has decreased from a baseline of 12.1 to a current value of 10.0, suggesting that rainfall has become more evenly distributed over time. A lower PCI indicates less concentration of precipitation in fewer events, which could lead to more consistent water availability and potentially reduce the risk of extreme weather events such as flash floods. This shift towards more evenly distributed rainfall aligns with broader regional climate goals to manage water resources effectively.
Temperature Extremes
The record temperatures for Guanábano highlight the extremes that the region can experience. The highest recorded temperature is 37.8°C (100.0°F), while the lowest is 7.2°C (45.0°F). These extremes underscore the variability inherent in a tropical climate, where occasional deviations from the norm can occur due to various atmospheric conditions.
Regional Climate Implications
These climatic shifts in Guanábano are part of a broader pattern observed across Puerto Rico, where regional climate goals focus on adapting to and mitigating the impacts of climate change. The recent warming trend in high temperatures and more evenly distributed rainfall may influence local agriculture, water management, and ecosystem health. Understanding these patterns is crucial for developing strategies to enhance resilience against future climate variability.
Station Statistics
10-Year Trend
High: +0.98 °C/decade
Low: +0.04 °C/decade
Rain: -1.01 mm/decade
25-Year Trend
High: -0.05 °C/decade
Low: +0.32 °C/decade
Rain: -0.51 mm/decade
50-Year Trend
High: -0.05 °C/decade
Low: +0.65 °C/decade
Rain: -0.46 mm/decade
All-Time Trend
High: -0.04 °C/decade
Low: +0.26 °C/decade
Rain: -0.30 mm/decade
Percentage Above-Average Days
Last 12 Months: 50.1%
This Year: 40.4%
Precipitation Concentration Index (PCI) ℹ️
Last 12 Months: 10.3
Historical Average: 11.3
Percentile Rank of Last 12 Months ℹ️
High: 47th percentile
Low: 91st percentile
Rain: 9th percentile
Change in Variance ℹ️
High: -30.3%
Low: -30.8%
Intraday: -55.8%
Data Coverage
81.4%
First Year of Data
1899
Station Location
Historical Weather Records
| Max High | Avg High | Min High | Max Avg | Avg Avg | Min Avg | Max Low | Avg Low | Min Low | Max Precipitation | Avg Precipitation | Max Snow | Avg Snow | |
|---|---|---|---|---|---|---|---|---|---|---|---|---|---|
| Record | 37.8 °C | — | 21.7 °C | 29.7 °C | — | 21.6 °C | 29.4 °C | — | 7.2 °C | 214.6 mm | — | 0.0 mm | — |
| January | 36.1 °C | 29.5 °C | 23.3 °C | 27.3 °C | 24.9 °C | 21.6 °C | 25.0 °C | 17.6 °C | 7.2 °C | 80.0 mm | 1.8 mm | 0.0 mm | 0.0 mm |
| February | 35.6 °C | 29.7 °C | 23.3 °C | 27.1 °C | 24.8 °C | 21.7 °C | 25.6 °C | 17.4 °C | 8.9 °C | 88.9 mm | 1.9 mm | 0.0 mm | 0.0 mm |
| March | 36.1 °C | 30.2 °C | 23.7 °C | 27.8 °C | 25.2 °C | 22.5 °C | 26.1 °C | 17.7 °C | 10.0 °C | 142.2 mm | 2.2 mm | 0.0 mm | 0.0 mm |
| April | 36.7 °C | 30.6 °C | 25.0 °C | 28.6 °C | 25.9 °C | 22.6 °C | 25.6 °C | 18.9 °C | 10.6 °C | 114.0 mm | 3.7 mm | 0.0 mm | 0.0 mm |
| May | 36.1 °C | 31.3 °C | 25.0 °C | 28.8 °C | 26.7 °C | 23.2 °C | 26.7 °C | 20.1 °C | 13.3 °C | 157.5 mm | 7.0 mm | 0.0 mm | 0.0 mm |
| June | 36.7 °C | 31.9 °C | 25.6 °C | 29.1 °C | 27.3 °C | 25.1 °C | 27.1 °C | 20.7 °C | 14.4 °C | 120.7 mm | 7.1 mm | 0.0 mm | 0.0 mm |
| July | 36.1 °C | 32.1 °C | 27.7 °C | 29.3 °C | 27.5 °C | 25.3 °C | 27.0 °C | 21.1 °C | 13.3 °C | 209.3 mm | 6.1 mm | 0.0 mm | 0.0 mm |
| August | 36.1 °C | 32.2 °C | 27.6 °C | 29.4 °C | 27.8 °C | 24.5 °C | 29.4 °C | 21.2 °C | 15.6 °C | 125.7 mm | 7.3 mm | 0.0 mm | 0.0 mm |
| September | 36.1 °C | 32.2 °C | 26.5 °C | 29.7 °C | 27.7 °C | 24.4 °C | 27.3 °C | 20.9 °C | 15.0 °C | 214.6 mm | 7.4 mm | 0.0 mm | 0.0 mm |
| October | 35.6 °C | 31.9 °C | 25.6 °C | 29.1 °C | 27.2 °C | 24.0 °C | 26.7 °C | 20.5 °C | 15.0 °C | 143.8 mm | 6.1 mm | 0.0 mm | 0.0 mm |
| November | 37.8 °C | 30.9 °C | 22.8 °C | 28.7 °C | 26.3 °C | 23.1 °C | 26.2 °C | 19.9 °C | 13.9 °C | 145.0 mm | 4.6 mm | 0.0 mm | 0.0 mm |
| December | 35.0 °C | 29.9 °C | 21.7 °C | 28.1 °C | 25.4 °C | 22.4 °C | 25.3 °C | 18.5 °C | 10.0 °C | 67.3 mm | 2.1 mm | 0.0 mm | 0.0 mm |
Data Visualisations
Remove WatermarksCurrent Year Climate Trends vs Historical
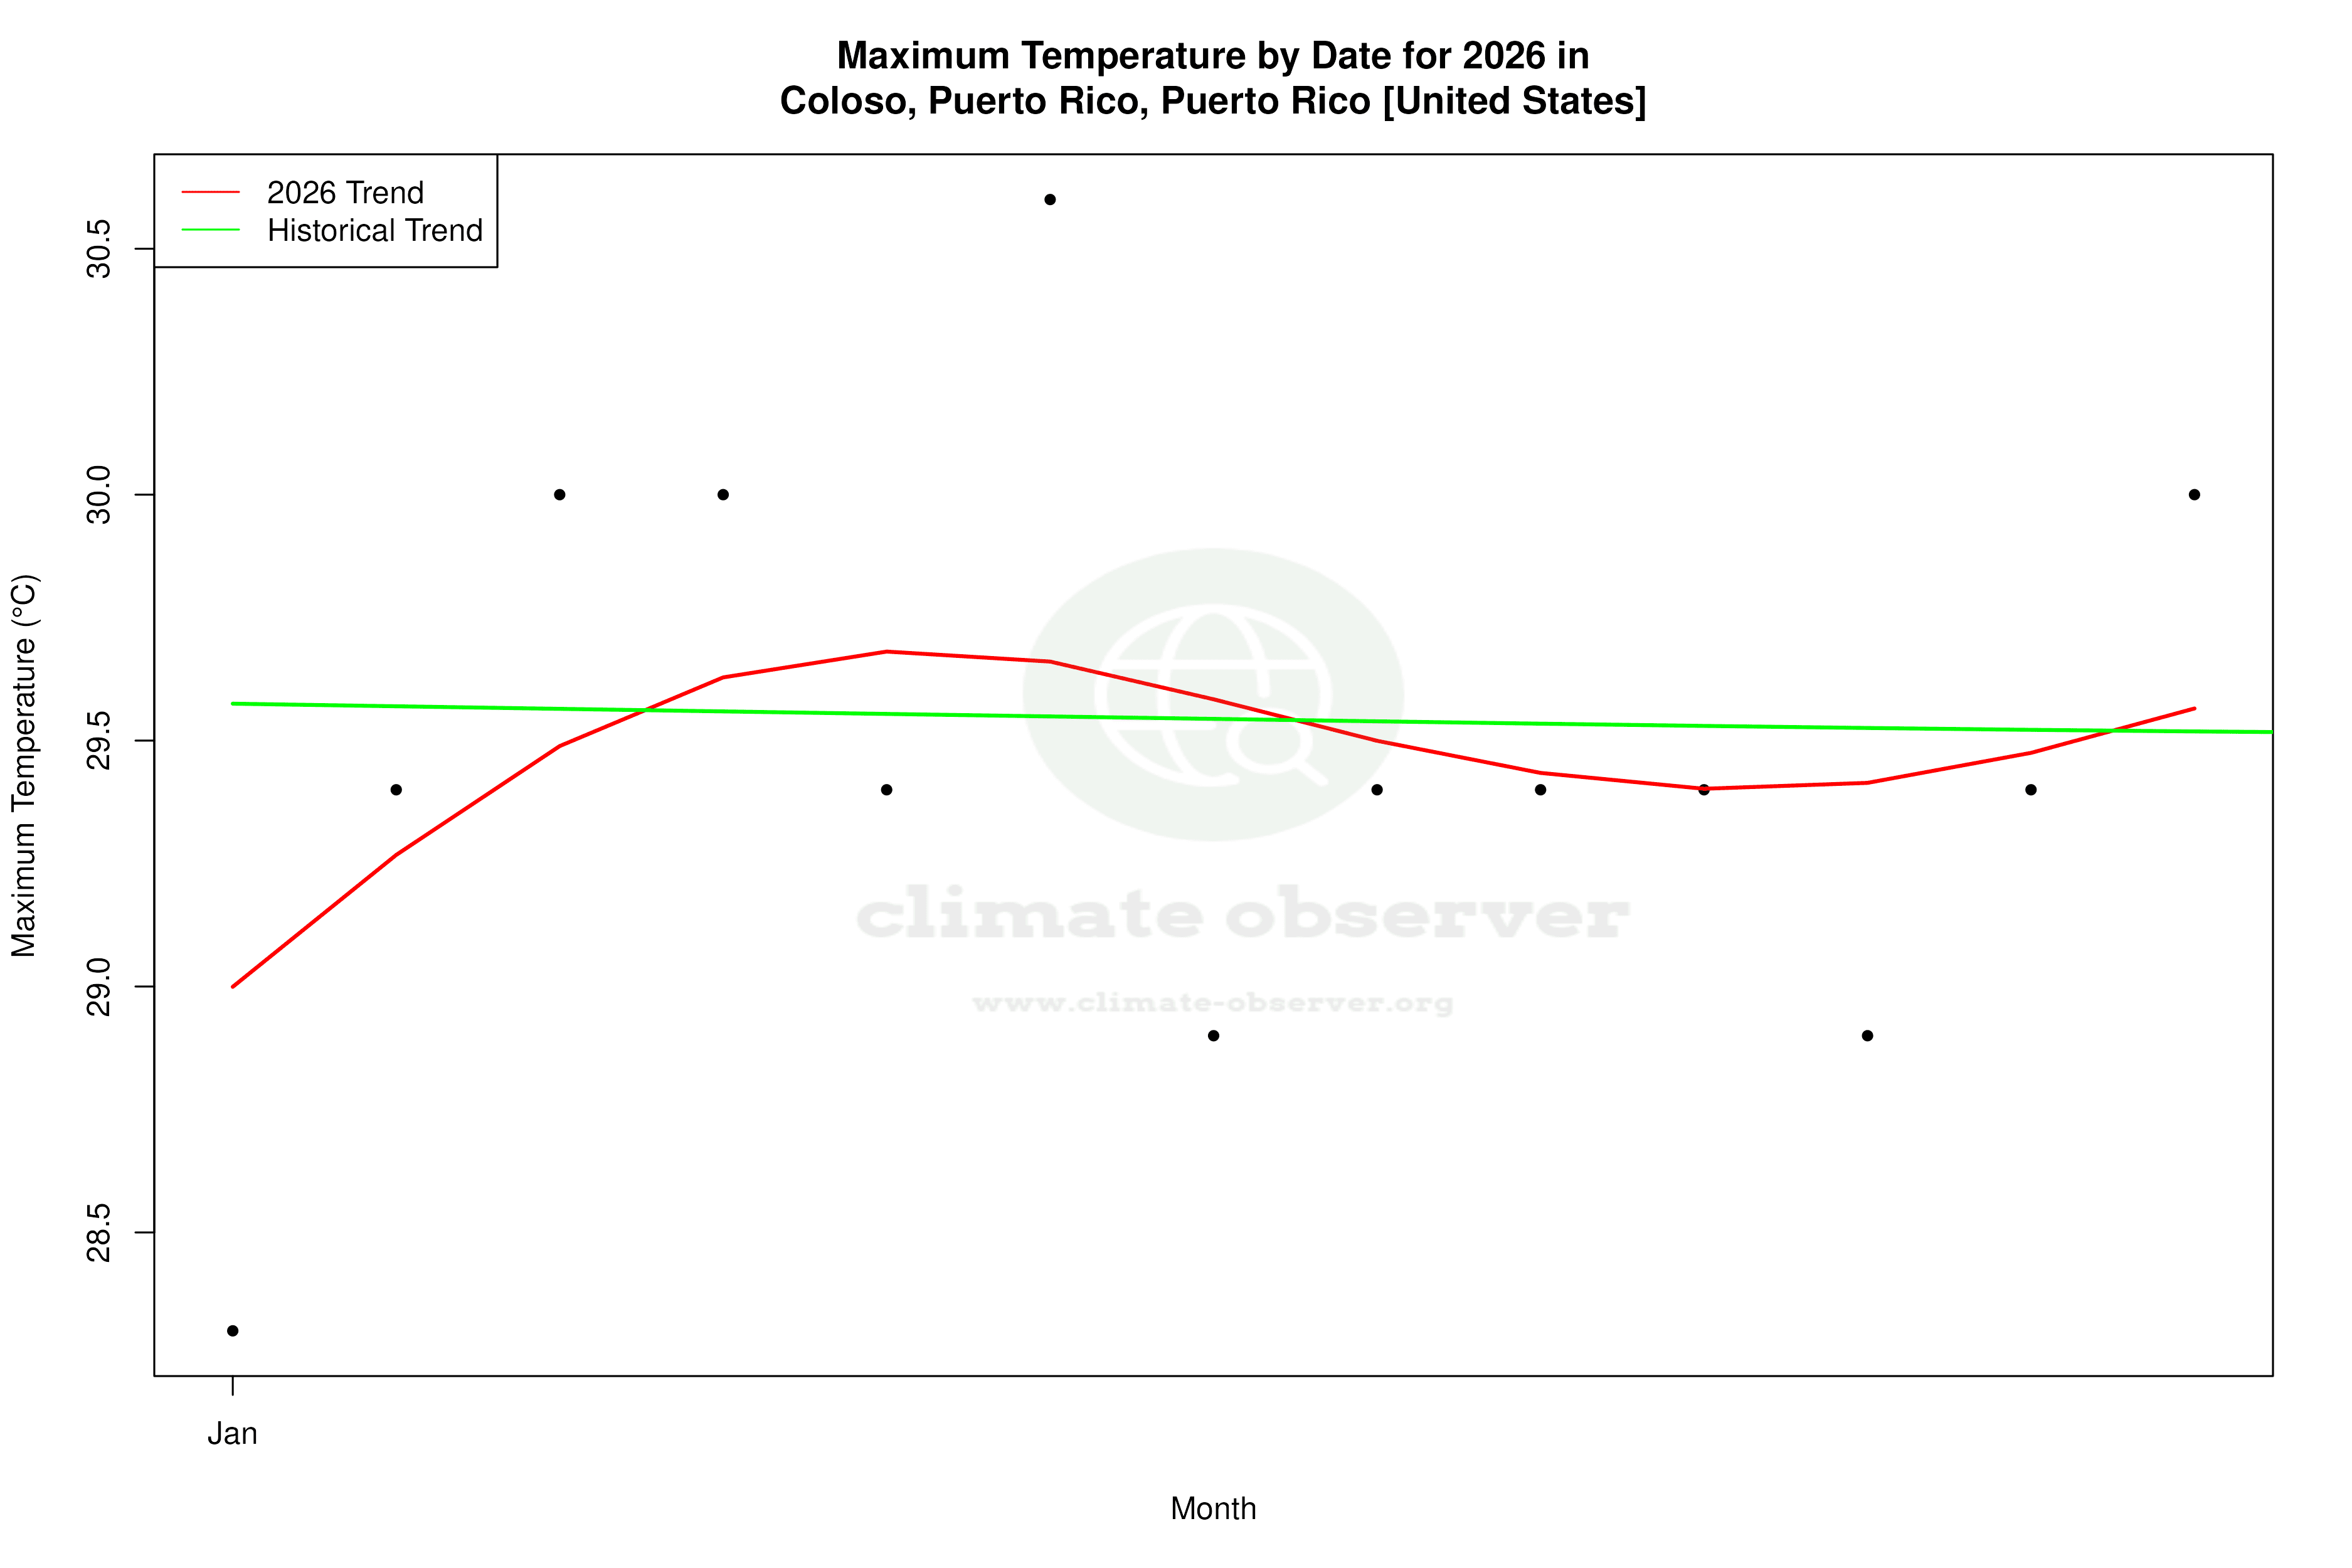


Max Temperature this Year | 1 of 6
Climate 12-Month Moving Averages


Max Temperature 12-Month MA | 1 of 6
Daily Data Points and Averages Throughout the Year
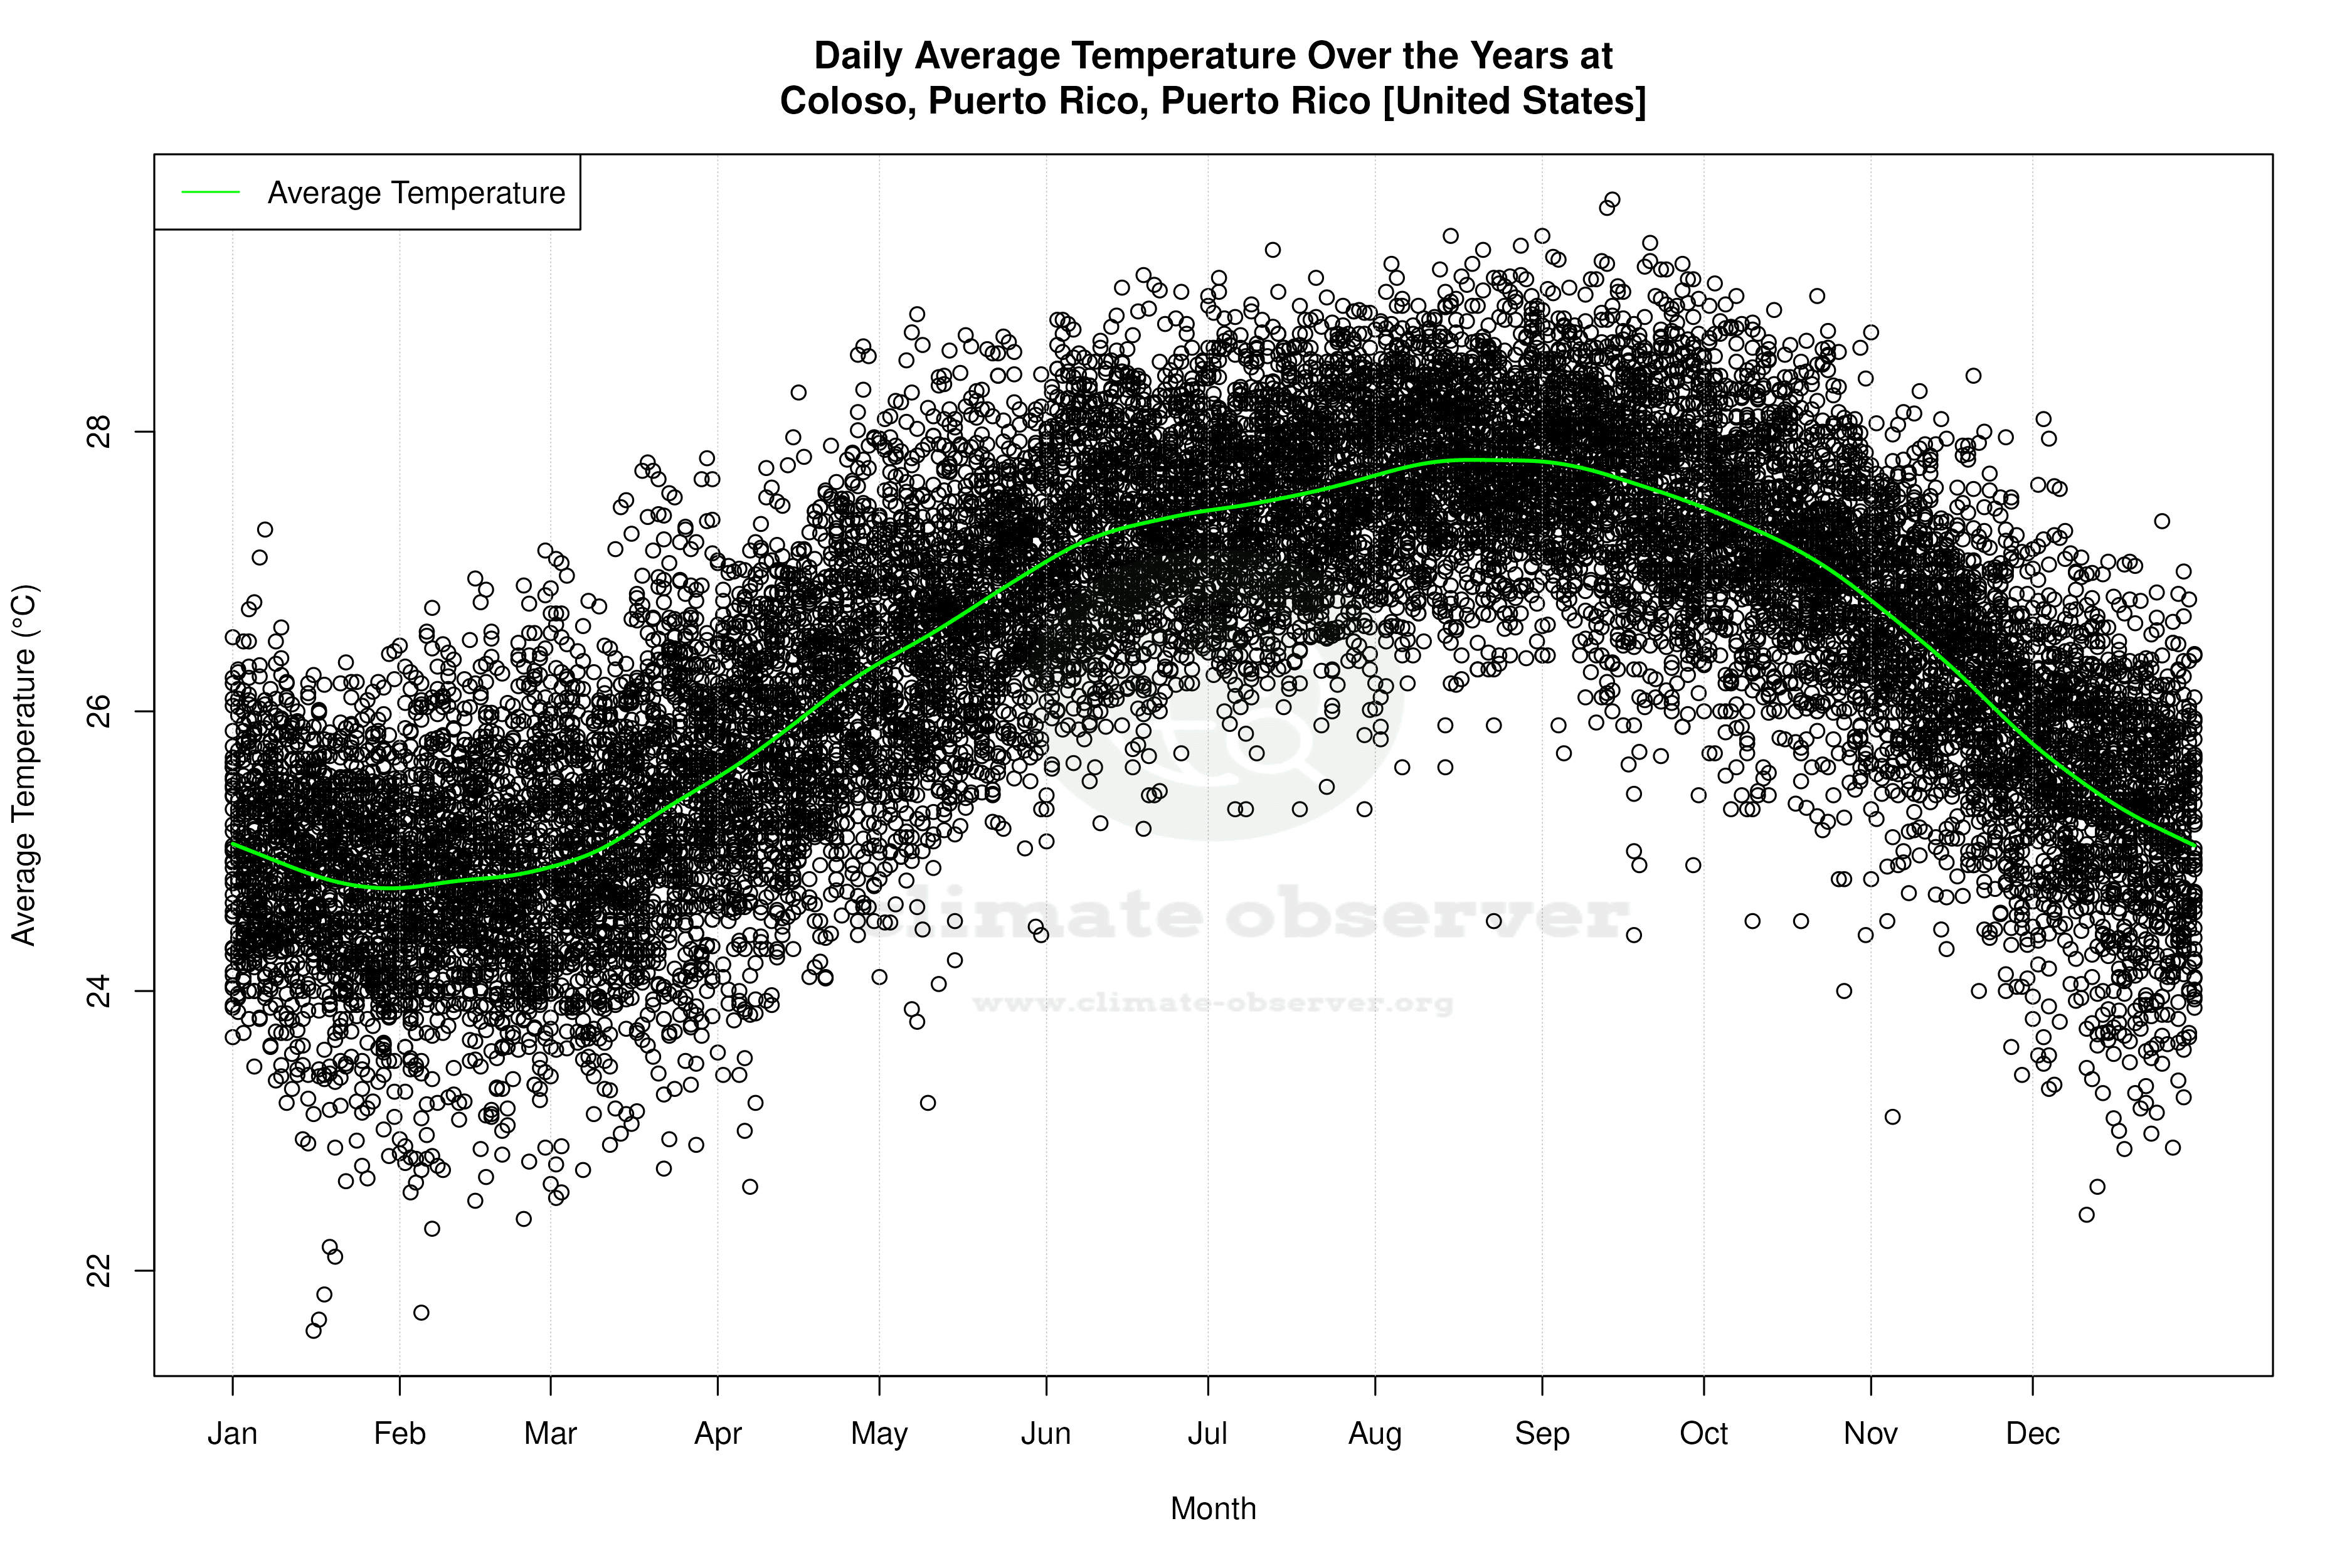
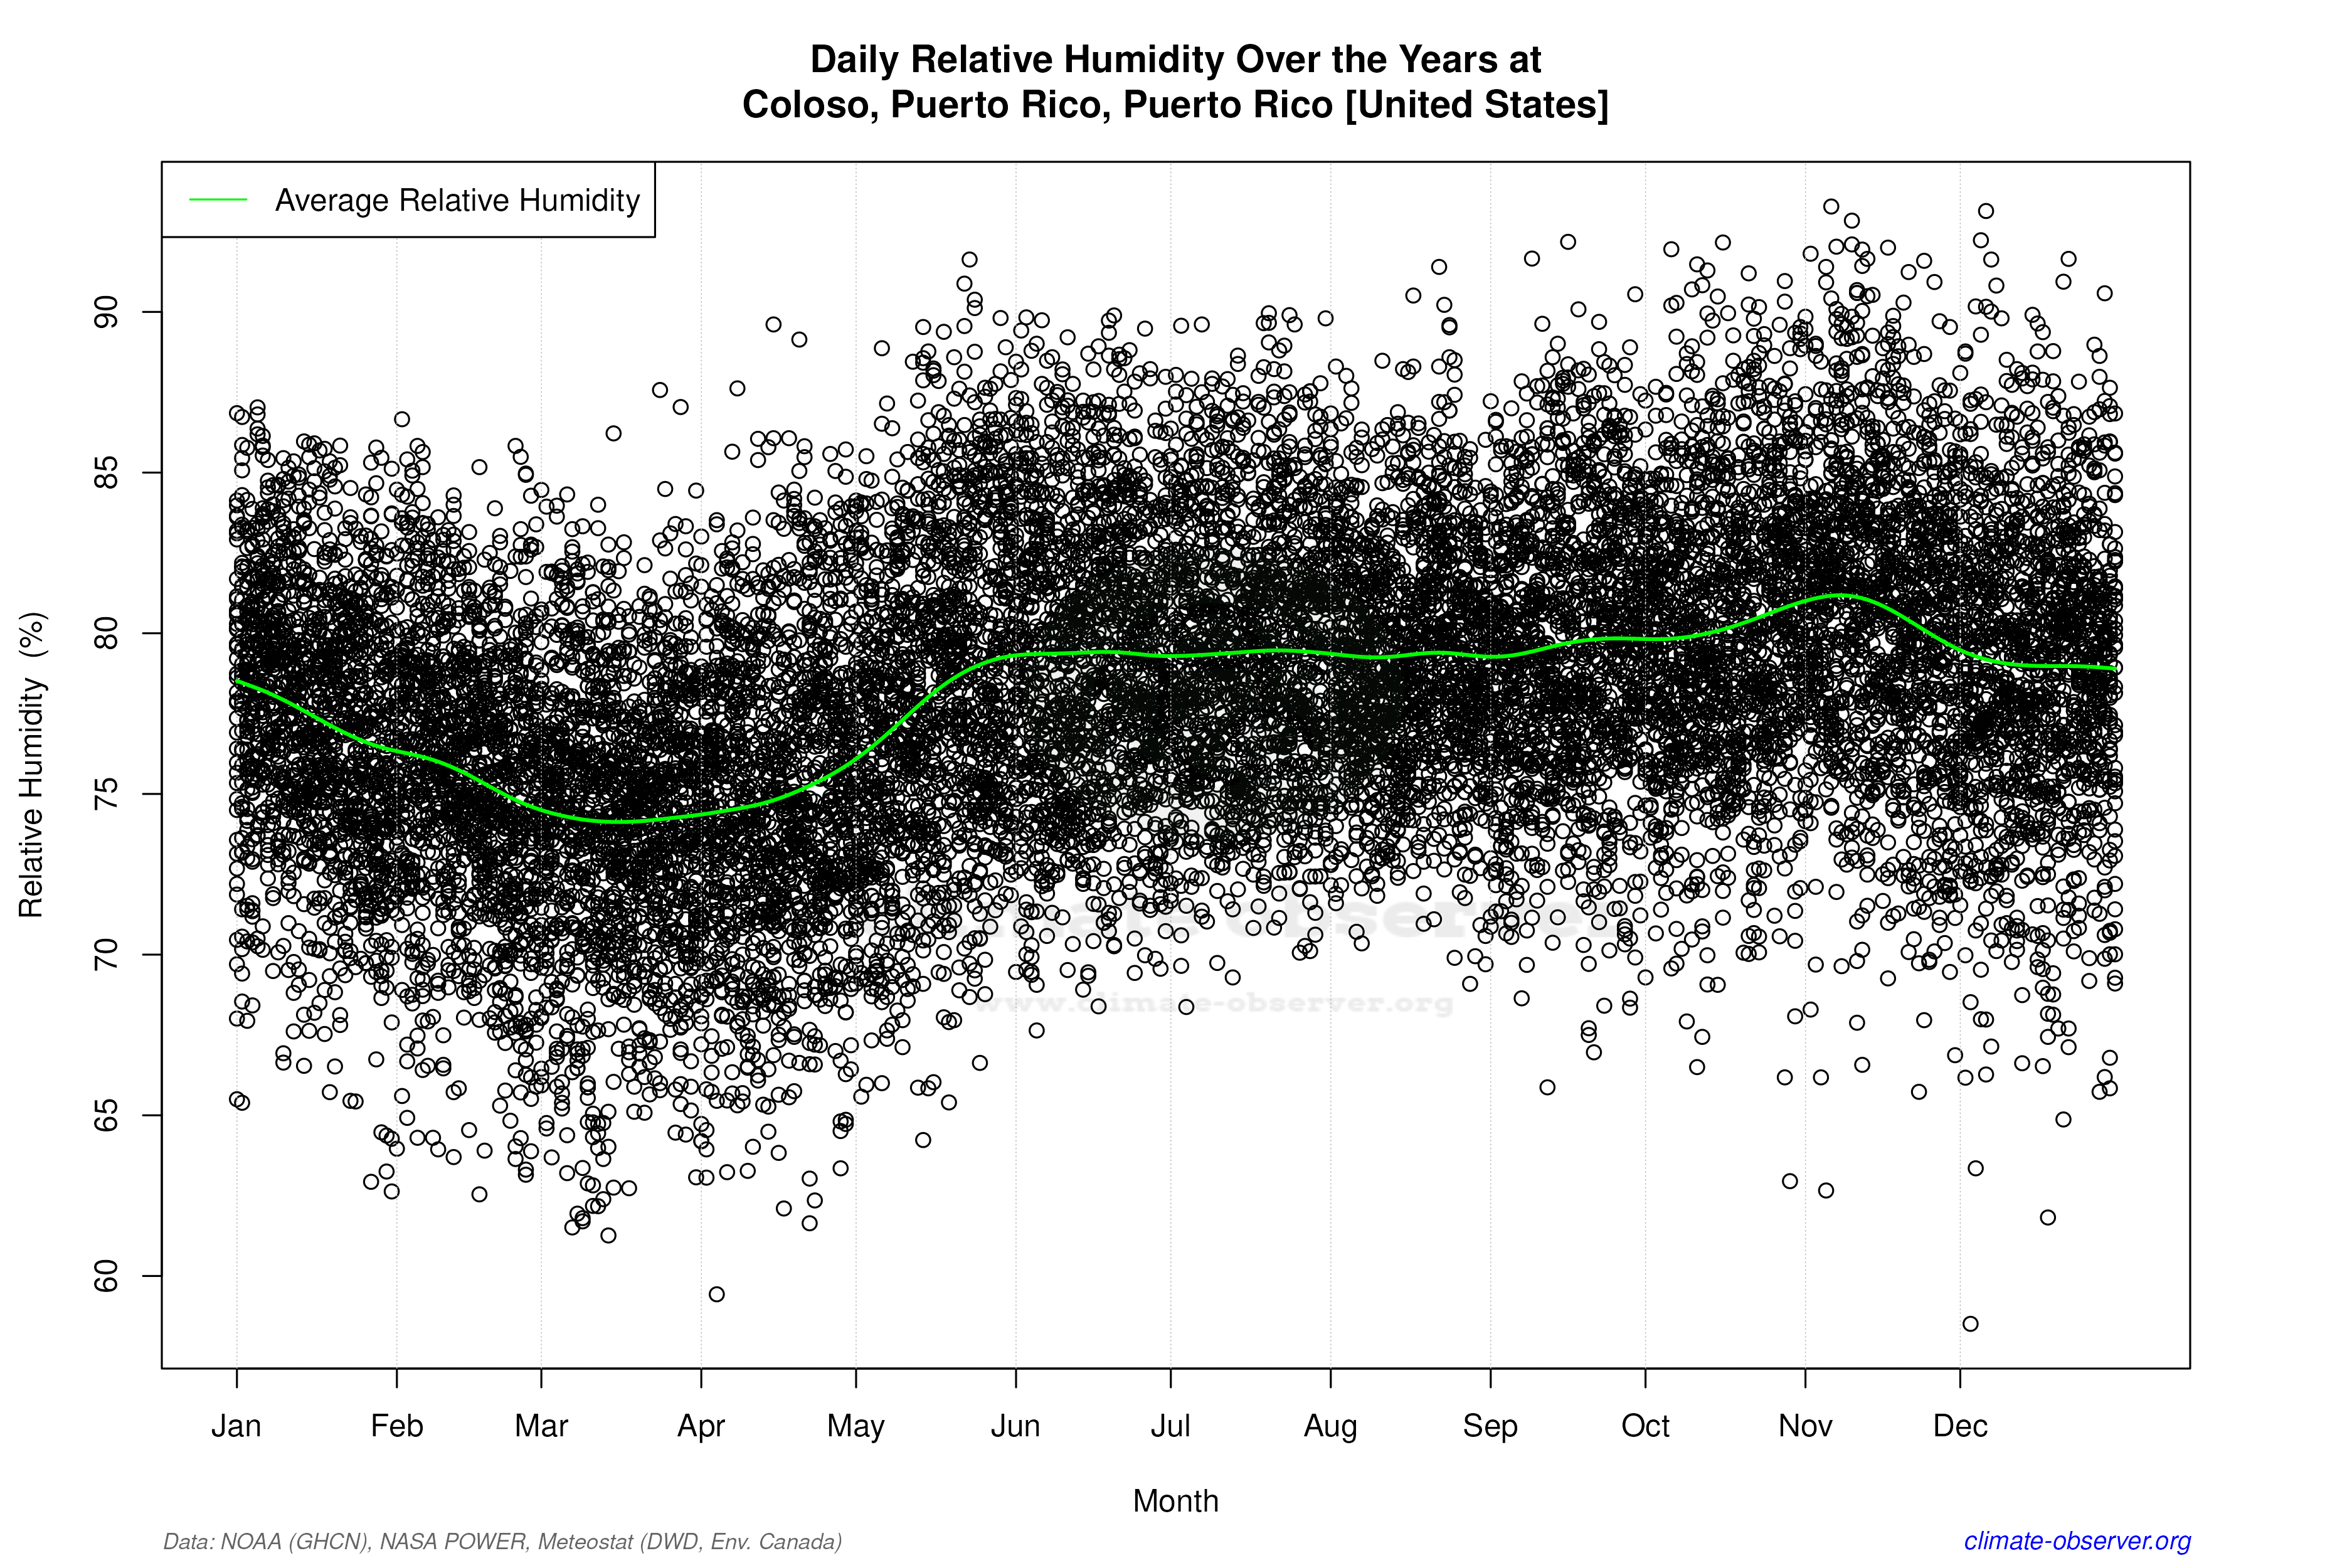

Average Max Temperature Throughout Year | 1 of 5
