Climate for Station: Ostrov Vrangelja, Chukotka Autonomous Okrug, Russia
Loading live weather...
Climate Analysis & Overview
Ostrov Vrangelja is experiencing a nuanced climate profile, with historical warming trends juxtaposed against recent cooling episodes. The island's precipitation patterns are becoming more evenly distributed, hinting at a shift in local hydrological dynamics.
Arctic Climate Context
Ostrov Vrangelja, located at 70.9831°N, 178.4833°W, falls under the Tundra climate classification (ET) according to the Köppen system. This classification is characterised by long, harsh winters and short, cool summers. The island's geographical isolation and proximity to the Arctic Ocean significantly influence its climate, with maritime effects moderating temperature extremes. The region's climate is further shaped by the surrounding sea ice, which acts as a buffer against rapid temperature fluctuations.
Temperature Trends: A Dichotomy
The all-time temperature trends on Ostrov Vrangelja indicate a warming pattern, with highs rising by 0.29°C (0.52°F) and lows by 0.42°C (0.76°F). This suggests a gradual increase in temperatures over the long term. However, the last decade tells a different story, with a notable cooling of 3.61°C (6.50°F) in high temperatures and 2.82°C (5.07°F) in low temperatures. This divergence between long-term and recent trends highlights the complexity of climate dynamics in the Arctic, where short-term variations can obscure broader climatic shifts.
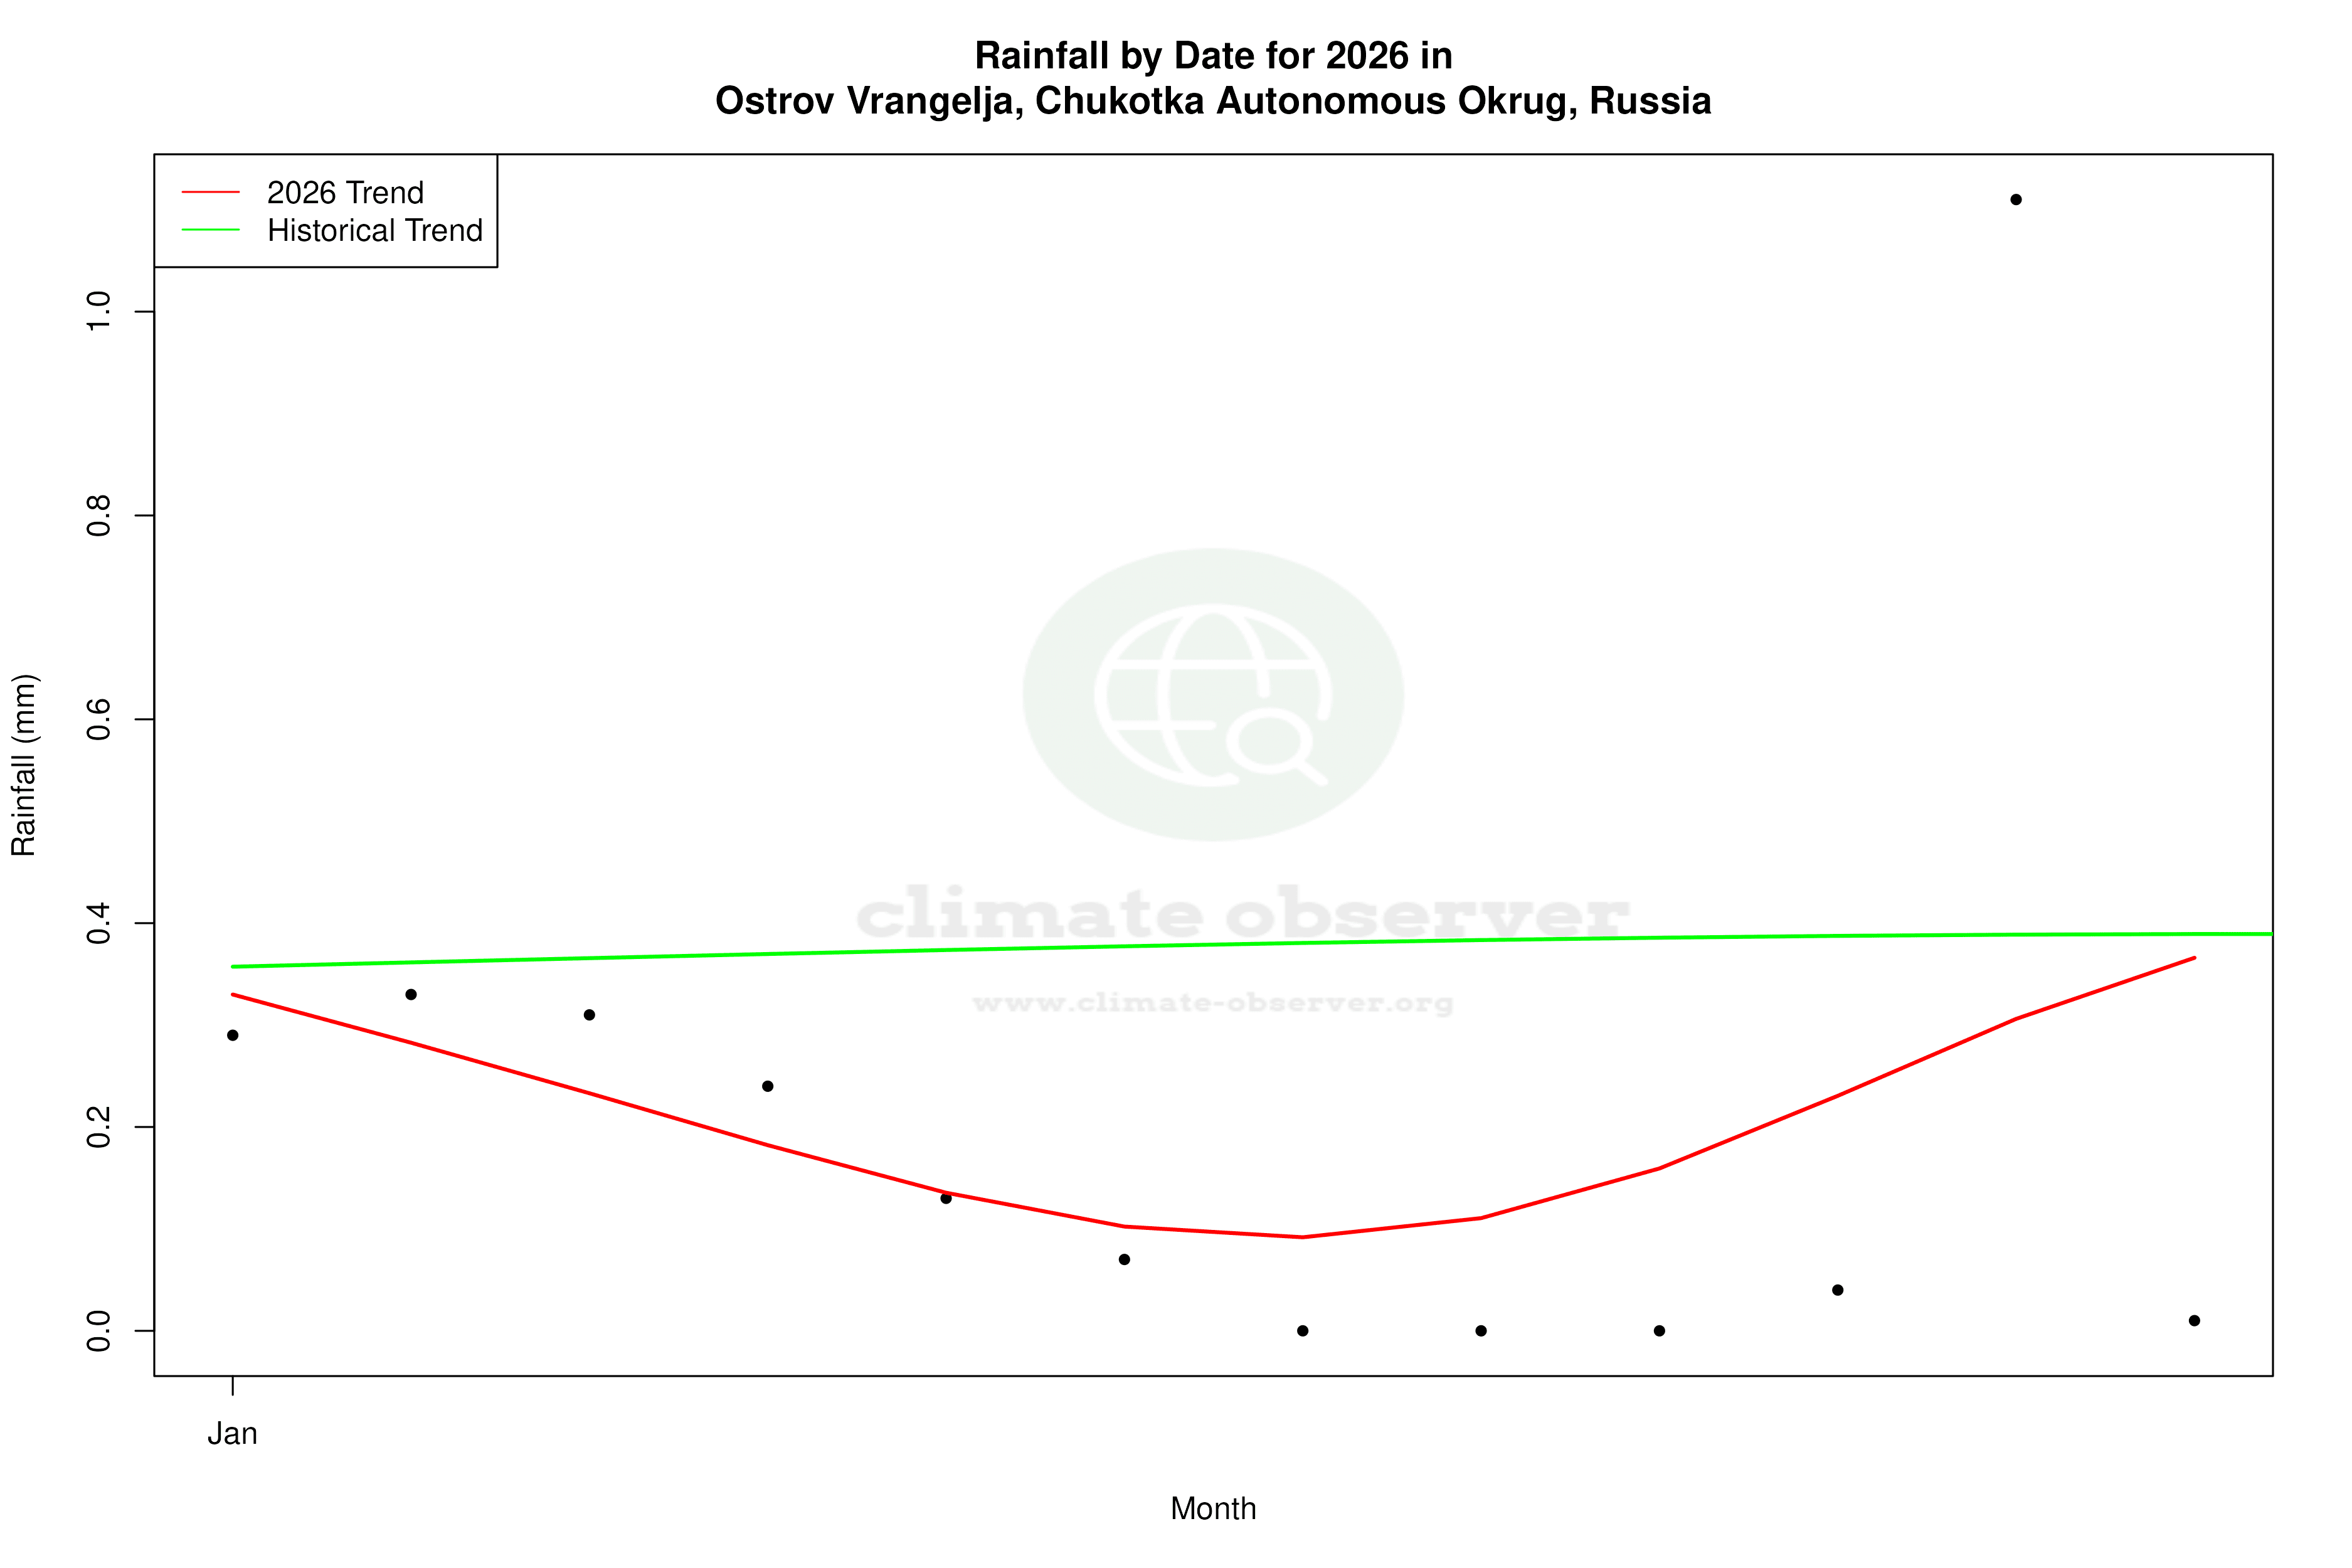
Precipitation Patterns: A Shift Towards Evenness
The Precipitation Concentration Index (PCI) for Ostrov Vrangelja has decreased from a baseline of 12.15 to a current value of 10.20. This reduction indicates that precipitation is becoming more evenly distributed throughout the year, rather than being concentrated in fewer, more intense events. This shift can have significant implications for local ecosystems and hydrology, potentially affecting water availability and the distribution of plant and animal species.
Temperature Extremes: Record Observations
The island has recorded temperature extremes with a maximum of 18.2°C (64.8°F) and a minimum of -49.7°C (-57.5°F). These records underscore the harsh and variable climate conditions that define Ostrov Vrangelja. Such extremes are critical for understanding the resilience of local flora and fauna, as well as the challenges faced by human activities in the region.
Regional Climate Goals and Implications
Russia's commitment to addressing climate change includes efforts to monitor and mitigate the impacts of warming in the Arctic. The trends observed on Ostrov Vrangelja are emblematic of the broader challenges faced by the region, where warming can lead to permafrost thaw and altered ecosystems. The recent cooling trend may offer a temporary reprieve, but it does not negate the overarching warming trajectory that poses long-term risks to the Arctic environment.
Station Statistics
10-Year Trend
High: -3.62 °C/decade
Low: -2.83 °C/decade
Rain: +0.11 mm/decade
25-Year Trend
High: +0.28 °C/decade
Low: +0.71 °C/decade
Rain: +0.10 mm/decade
50-Year Trend
High: +0.68 °C/decade
Low: +0.94 °C/decade
Rain: +0.02 mm/decade
All-Time Trend
High: +0.29 °C/decade
Low: +0.42 °C/decade
Rain: +0.00 mm/decade
Percentage Above-Average Days
Last 12 Months: 54.2%
This Year: 76.3%
Precipitation Concentration Index (PCI) ℹ️
Last 12 Months: 11.2
Historical Average: 14.8
Percentile Rank of Last 12 Months ℹ️
High: 71st percentile
Low: 83rd percentile
Rain: 62nd percentile
Change in Variance ℹ️
High: -11.5%
Low: -21.0%
Intraday: -13.3%
Data Coverage
99.7%
First Year of Data
1926
Station Location
Historical Weather Records
| Max High | Avg High | Min High | Max Avg | Avg Avg | Min Avg | Max Low | Avg Low | Min Low | Max Precipitation | Avg Precipitation | Max Snow | Avg Snow | |
|---|---|---|---|---|---|---|---|---|---|---|---|---|---|
| Record | 18.2 °C | — | -41.3 °C | 12.8 °C | — | -45.9 °C | 10.7 °C | — | -52.5 °C | 34.7 mm | — | — | — |
| January | 1.5 °C | -19.0 °C | -37.7 °C | -1.3 °C | -22.5 °C | -39.7 °C | -2.6 °C | -26.1 °C | -42.0 °C | 13.1 mm | 0.4 mm | — | — |
| February | -0.2 °C | -20.5 °C | -41.3 °C | -2.7 °C | -24.1 °C | -42.8 °C | -4.5 °C | -27.7 °C | -44.6 °C | 34.7 mm | 0.3 mm | — | — |
| March | 0.2 °C | -18.8 °C | -35.0 °C | -1.7 °C | -22.6 °C | -38.3 °C | -3.7 °C | -26.3 °C | -45.0 °C | 31.5 mm | 0.3 mm | — | — |
| April | 2.5 °C | -12.8 °C | -27.3 °C | 1.1 °C | -16.5 °C | -32.4 °C | -0.9 °C | -20.4 °C | -38.2 °C | 12.9 mm | 0.2 mm | — | — |
| May | 9.6 °C | -3.6 °C | -18.6 °C | 6.4 °C | -6.3 °C | -23.0 °C | 3.1 °C | -9.1 °C | -31.5 °C | 8.7 mm | 0.3 mm | — | — |
| June | 17.6 °C | 3.2 °C | -6.4 °C | 10.3 °C | 0.7 °C | -8.4 °C | 6.2 °C | -1.2 °C | -12.3 °C | 31.1 mm | 0.4 mm | — | — |
| July | 18.2 °C | 5.7 °C | -0.2 °C | 11.1 °C | 2.8 °C | -2.2 °C | 8.4 °C | 0.8 °C | -4.9 °C | 21.8 mm | 0.7 mm | — | — |
| August | 16.7 °C | 4.8 °C | -2.6 °C | 12.8 °C | 2.4 °C | -4.3 °C | 10.7 °C | 0.6 °C | -6.5 °C | 27.4 mm | 0.8 mm | — | — |
| September | 12.7 °C | 1.4 °C | -10.3 °C | 10.5 °C | -0.4 °C | -12.1 °C | 9.1 °C | -2.2 °C | -14.6 °C | 22.9 mm | 0.6 mm | — | — |
| October | 9.3 °C | -4.4 °C | -20.6 °C | 6.6 °C | -6.5 °C | -24.8 °C | 5.4 °C | -8.9 °C | -29.8 °C | 19.4 mm | 0.5 mm | — | — |
| November | 5.4 °C | -10.8 °C | -27.6 °C | 0.9 °C | -13.6 °C | -31.4 °C | 0.0 °C | -16.5 °C | -34.9 °C | 16.5 mm | 0.4 mm | — | — |
| December | 2.0 °C | -17.2 °C | -33.6 °C | 0.6 °C | -20.3 °C | -45.9 °C | -1.3 °C | -23.4 °C | -52.5 °C | 29.0 mm | 0.3 mm | — | — |
Data Visualisations
Remove WatermarksCurrent Year Climate Trends vs Historical


Max Temperature this Year | 1 of 6
Climate 12-Month Moving Averages


Max Temperature 12-Month MA | 1 of 6
Daily Data Points and Averages Throughout the Year


Average Max Temperature Throughout Year | 1 of 5
