Climate for Station: Teriberka, Murmansk Oblast, Russia
Loading live weather...
Climate Analysis & Overview
Teriberka, located on the rugged coast of the Barents Sea, is experiencing a warming trend, with a notable rise in both high and low temperatures over the past decade. The precipitation pattern has shifted towards a more even distribution, suggesting changes in local climate dynamics.
Arctic Coastal Climate
Teriberka, situated at 69.2°N, 35.1°E, is classified under the Köppen climate system as having a subarctic climate (Dfc), characterized by cold, snowy winters and cool, short summers. The proximity to the Barents Sea influences its climate, providing relatively milder conditions compared to more inland areas at similar latitudes. The sea acts as a thermal buffer, moderating extreme temperatures. This maritime influence is evident in the area's historical temperature records, with an all-time high of 38.4°C (101.1°F) and a chilling low of -32.0°C (-25.6°F).
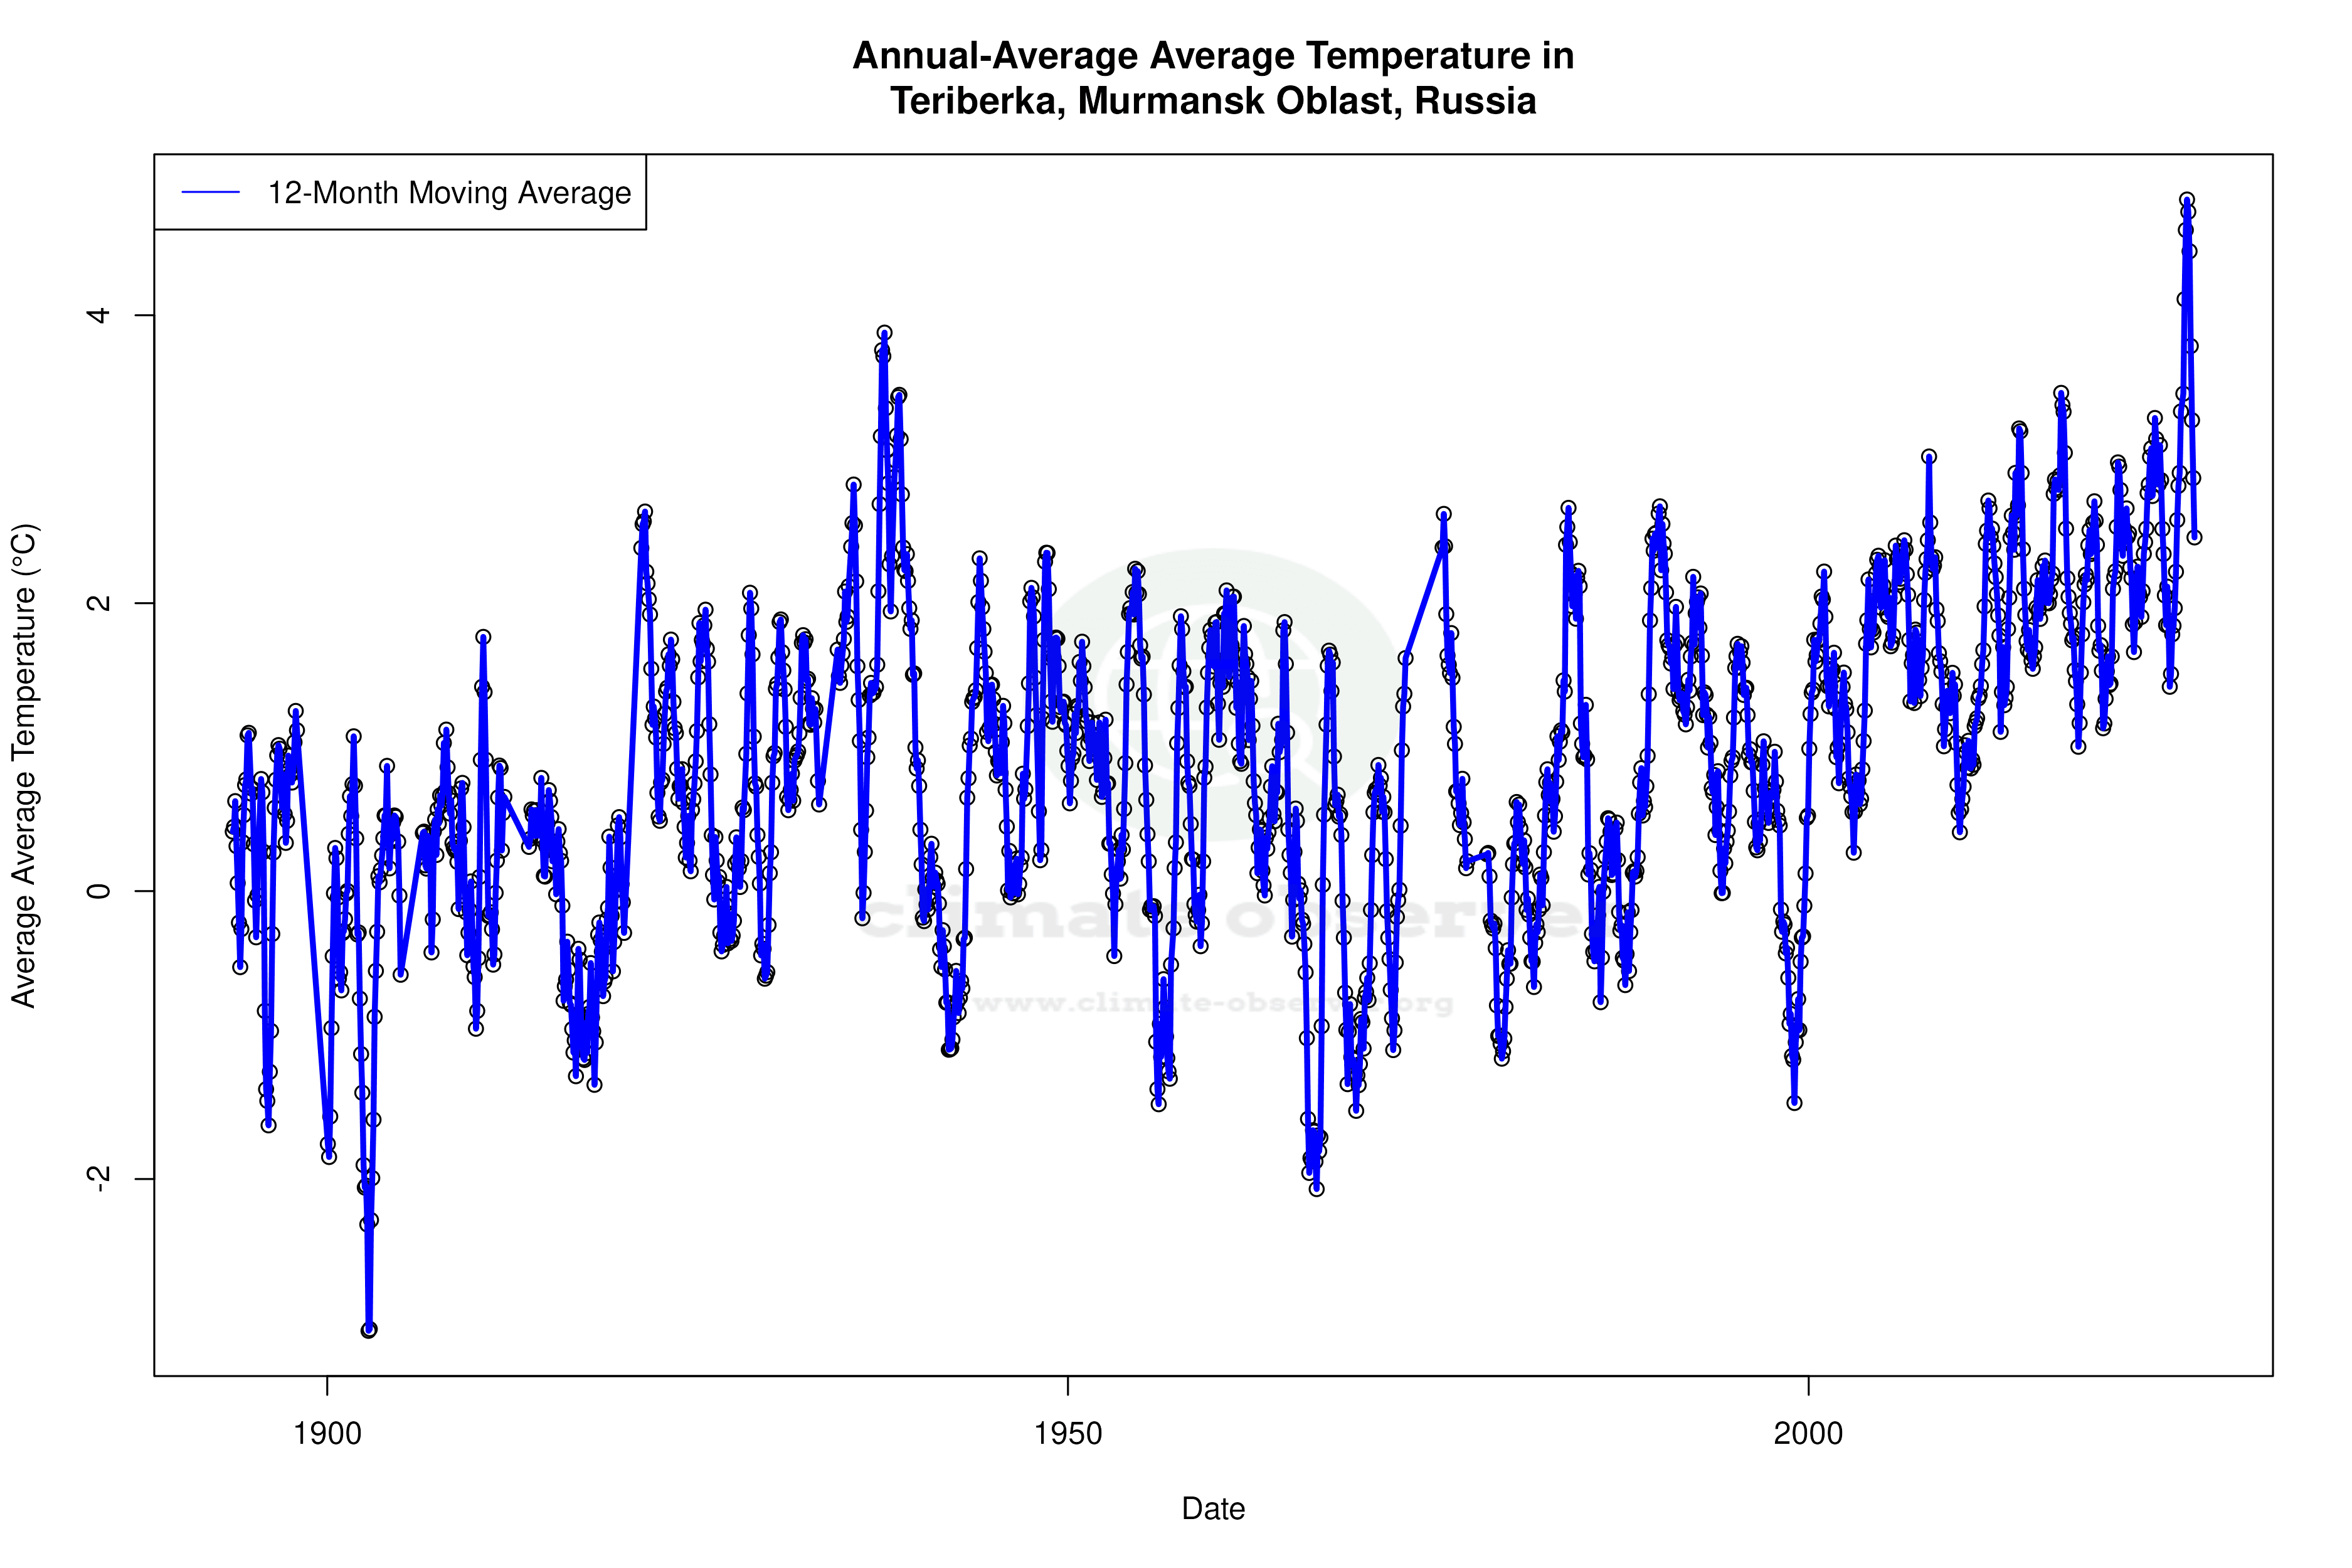
Warming Trends in the North
Over the past decade, Teriberka has experienced a warming trend, with average high temperatures increasing by 0.27°C (0.49°F) and lows by 0.60°C (1.08°F). These trends are more pronounced than the all-time trends, where highs have risen by 0.09°C (0.16°F) and lows by 0.20°C (0.36°F). This suggests an accelerated warming in recent years, aligning with broader patterns observed across the Arctic region, where climate change impacts are amplified. The increase in low temperatures is particularly significant, indicating milder winter nights and potentially altering local ecosystems and human activities.
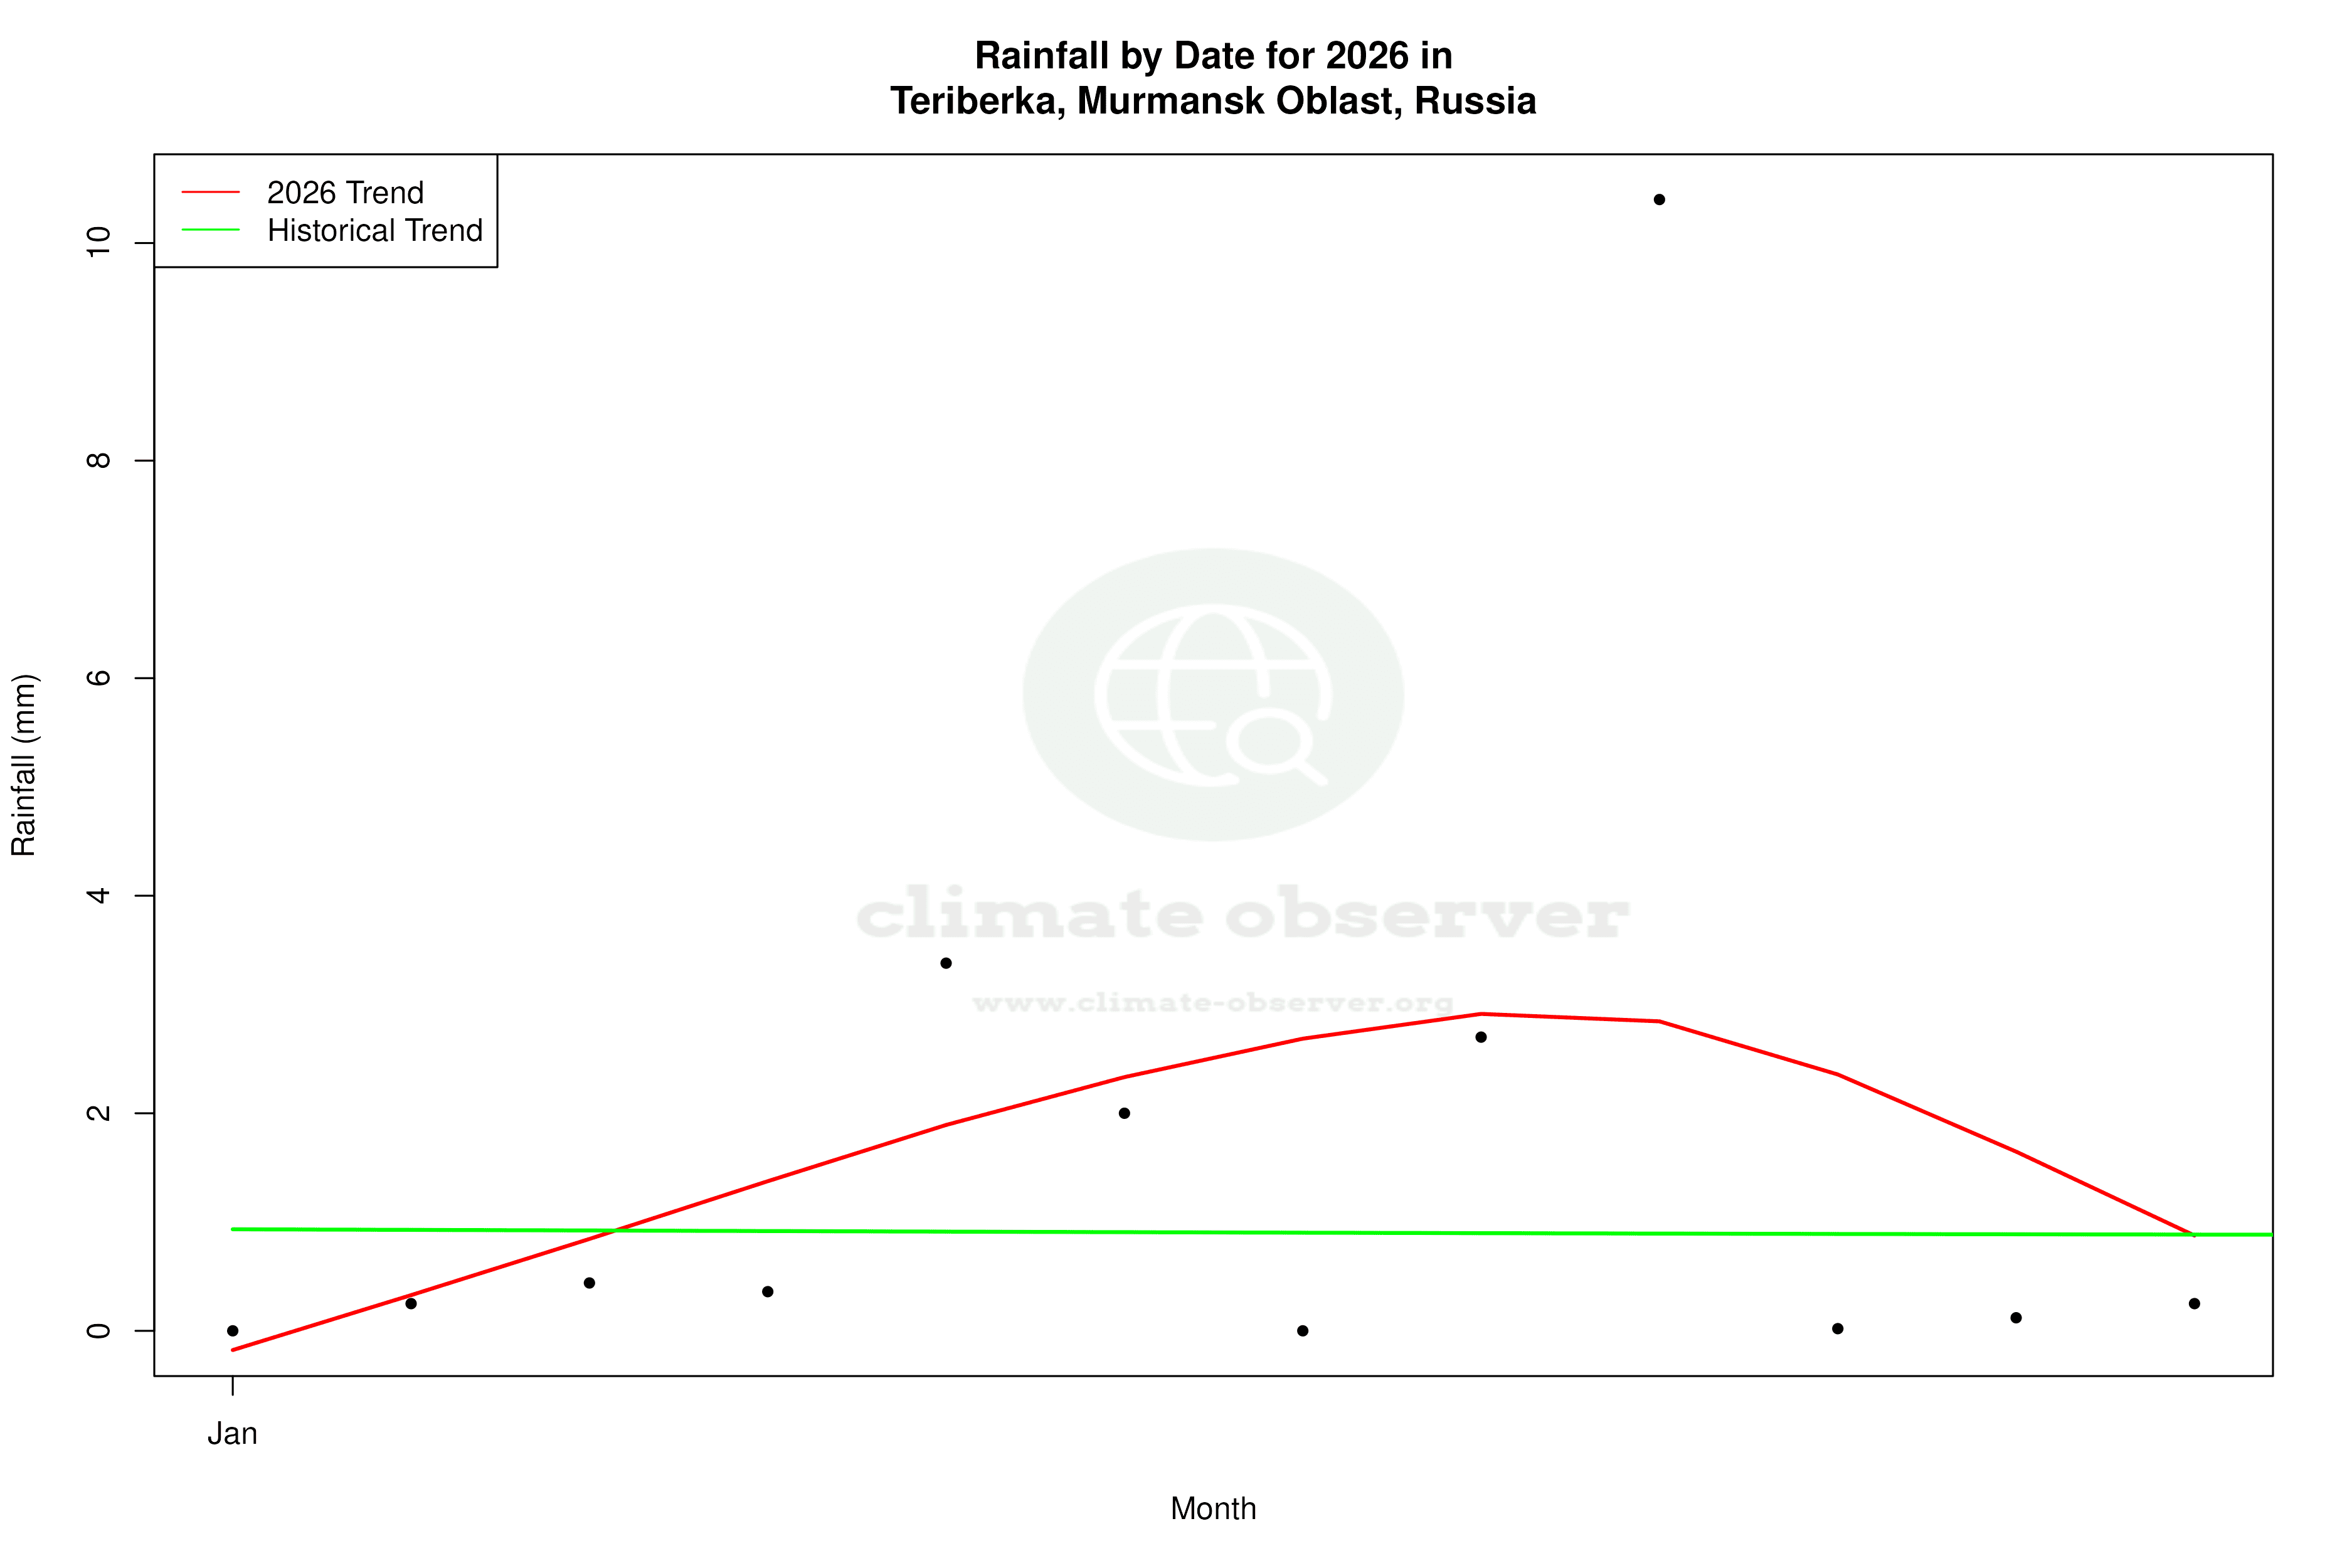
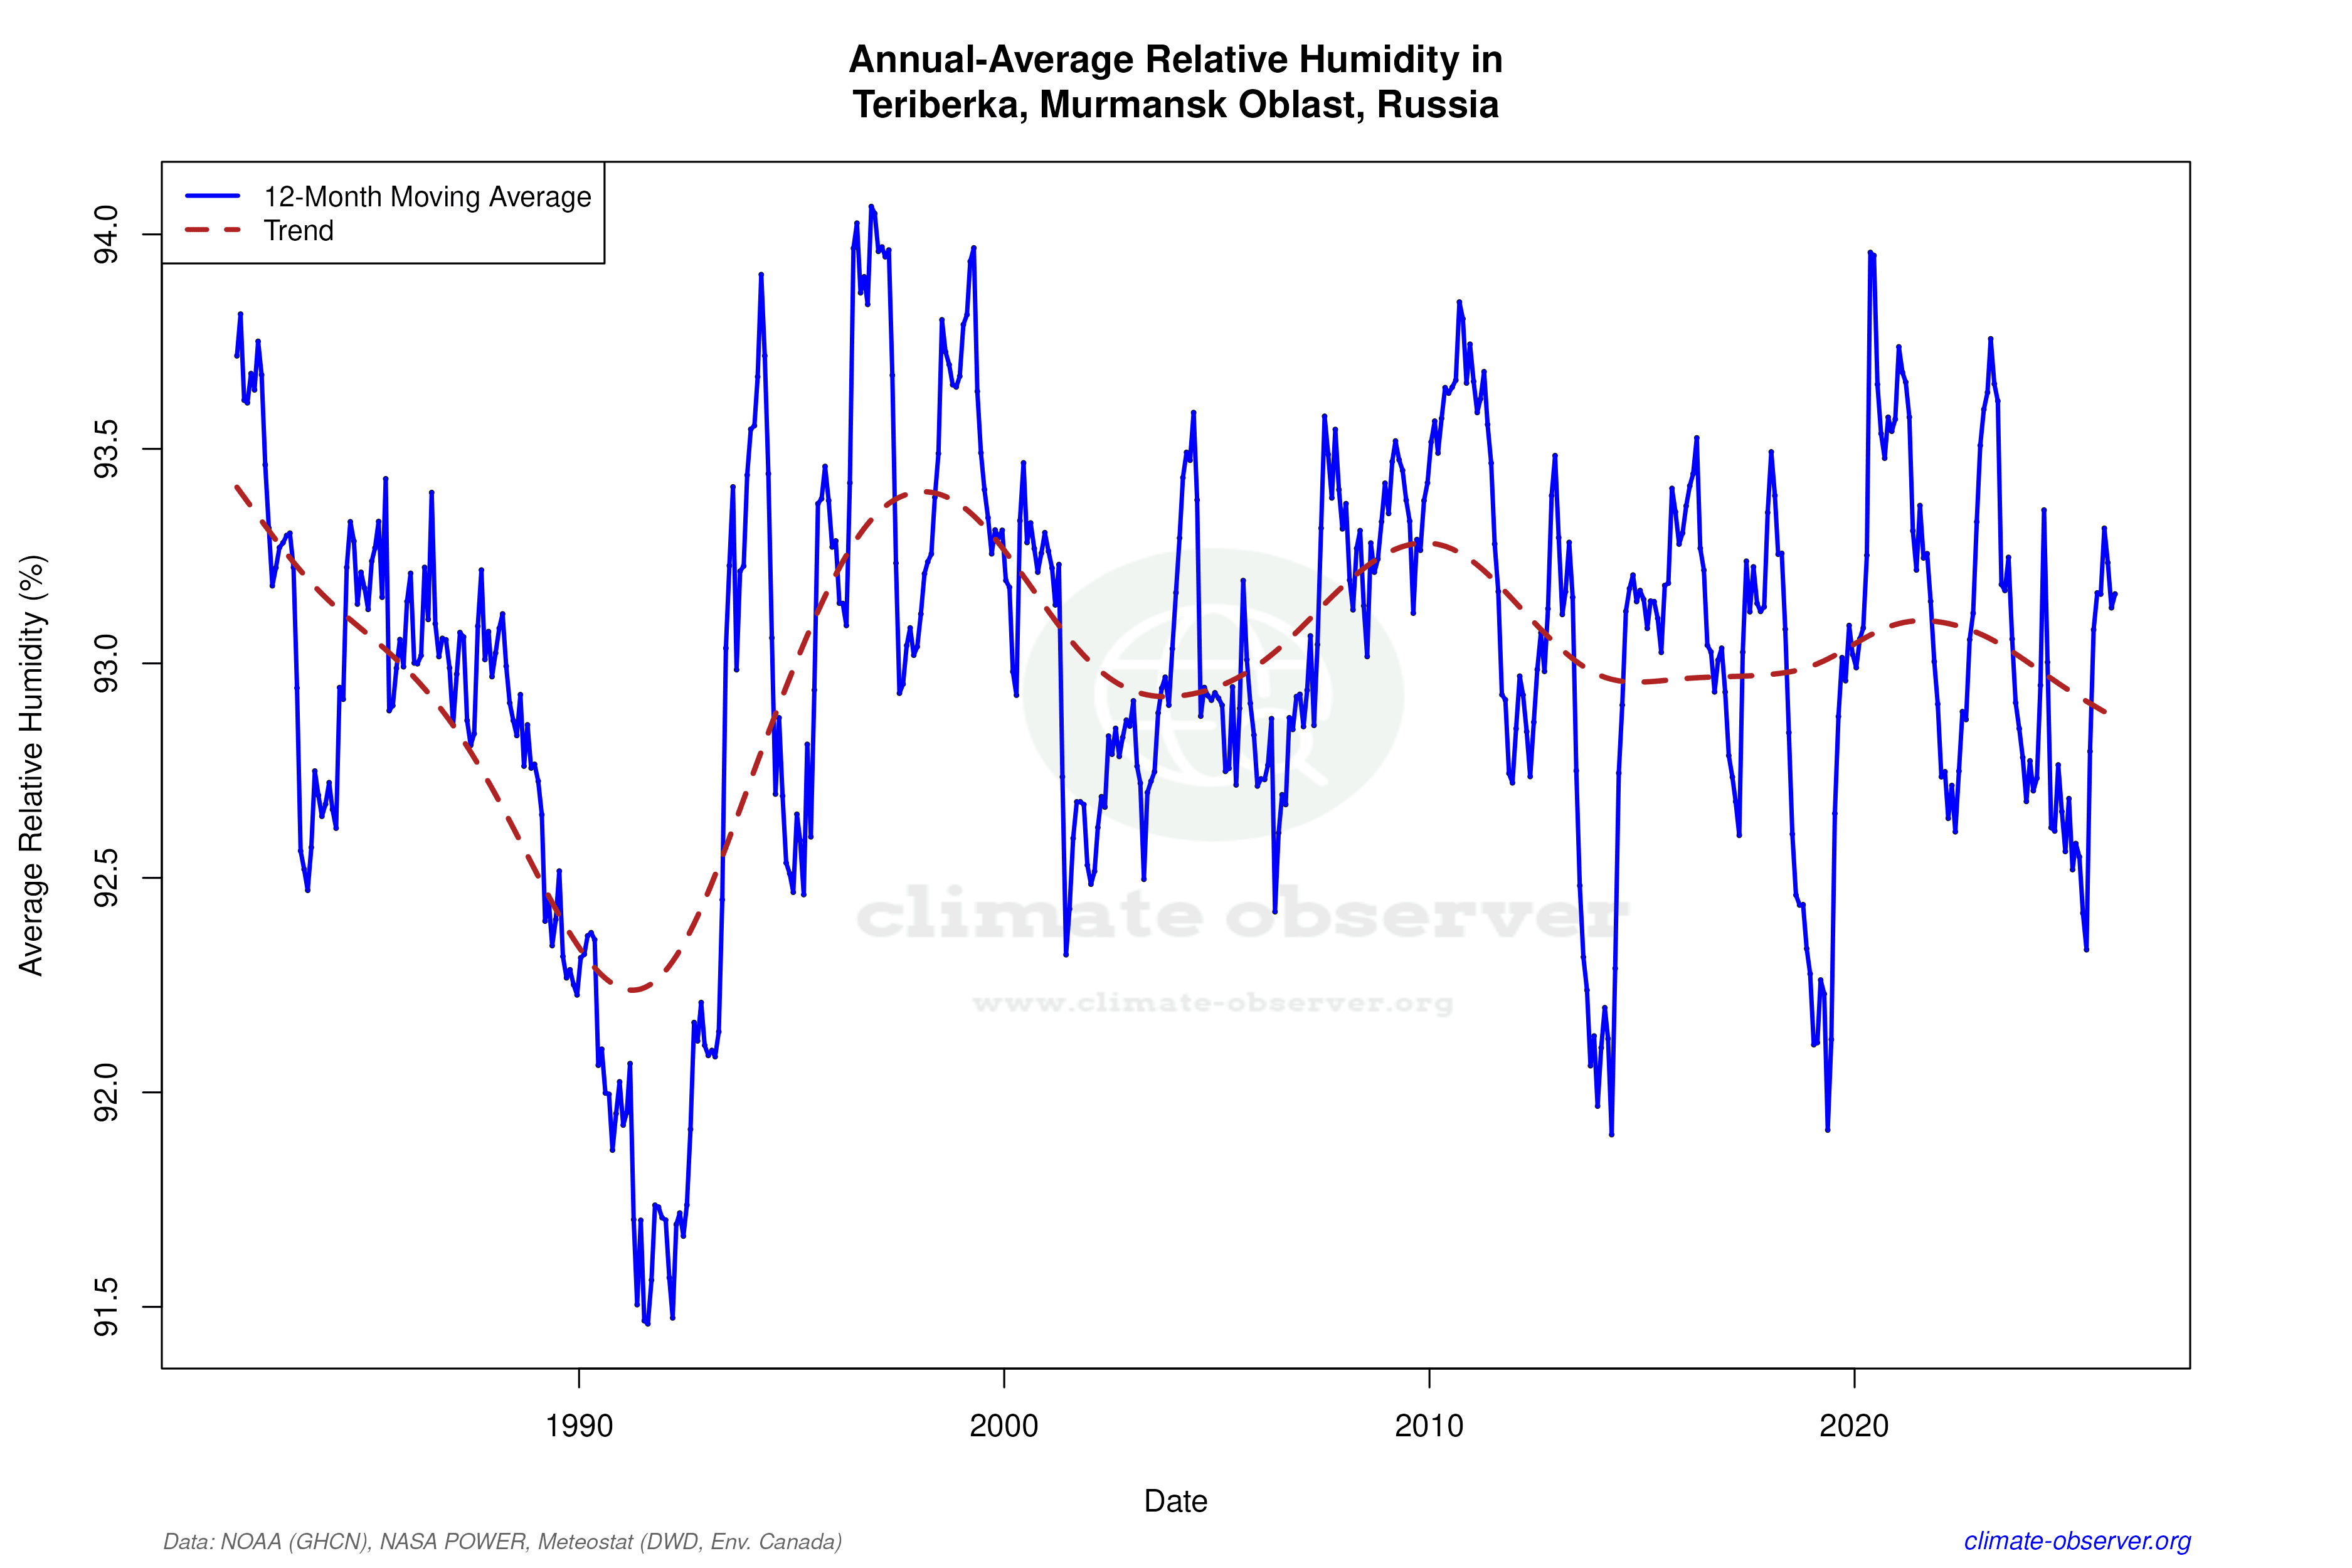
Precipitation Patterns and Distribution
The Precipitation Concentration Index (PCI) for Teriberka has decreased from a baseline of 10.8 to a current value of 9.2. This shift indicates that precipitation is now more evenly distributed throughout the year, rather than being concentrated in a few intense events. Such a change can have profound implications for local water management, agriculture, and natural habitats, as more consistent rainfall patterns may reduce the risk of both droughts and floods.
Regional Climate Goals and Implications
Russia's commitment to addressing climate change includes efforts to monitor and adapt to these evolving climate patterns. The warming trends observed in Teriberka are consistent with the broader regional objectives of understanding and mitigating the impacts of climate change. These observations provide valuable insights into the local manifestations of global climate dynamics, offering a crucial perspective for policymakers and scientists alike.
The Changing Face of Teriberka's Climate
The data from Teriberka paints a picture of a region in transition, with warming temperatures and more evenly distributed precipitation patterns. These changes are emblematic of the broader shifts occurring in the Arctic, where climate change is reshaping the environment at an unprecedented pace. As these trends continue, they will undoubtedly influence both the natural landscape and the communities that call this remote part of the world home.
Station Statistics
10-Year Trend
High: +0.16 °C/decade
Low: +0.76 °C/decade
Rain: +1.07 mm/decade
25-Year Trend
High: +0.34 °C/decade
Low: +0.51 °C/decade
Rain: +0.21 mm/decade
50-Year Trend
High: +0.39 °C/decade
Low: +0.56 °C/decade
Rain: +0.07 mm/decade
All-Time Trend
High: +0.09 °C/decade
Low: +0.21 °C/decade
Rain: +0.02 mm/decade
Percentage Above-Average Days
Last 12 Months: 48.8%
This Year: 52.9%
Precipitation Concentration Index (PCI) ℹ️
Last 12 Months: 8.9
Historical Average: 11.0
Percentile Rank of Last 12 Months ℹ️
High: 83rd percentile
Low: 99th percentile
Rain: 99th percentile
Change in Variance ℹ️
High: +2.1%
Low: -4.8%
Intraday: +0.2%
Data Coverage
93.7%
First Year of Data
1893
Station Location
Historical Weather Records
| Max High | Avg High | Min High | Max Avg | Avg Avg | Min Avg | Max Low | Avg Low | Min Low | Max Precipitation | Avg Precipitation | Max Snow | Avg Snow | |
|---|---|---|---|---|---|---|---|---|---|---|---|---|---|
| Record | 38.4 °C | — | -26.1 °C | 29.6 °C | — | -28.2 °C | 22.7 °C | — | -32.0 °C | 81.4 mm | — | — | — |
| January | 9.8 °C | -4.5 °C | -26.1 °C | 5.2 °C | -7.6 °C | -28.2 °C | 4.3 °C | -10.8 °C | -29.6 °C | 16.4 mm | 0.9 mm | — | — |
| February | 6.4 °C | -5.1 °C | -24.6 °C | 4.9 °C | -8.1 °C | -28.2 °C | 3.3 °C | -11.3 °C | -31.2 °C | 18.2 mm | 0.8 mm | — | — |
| March | 7.3 °C | -2.9 °C | -21.4 °C | 5.0 °C | -5.8 °C | -25.5 °C | 3.9 °C | -8.8 °C | -32.0 °C | 15.6 mm | 0.8 mm | — | — |
| April | 13.6 °C | 0.8 °C | -13.6 °C | 9.8 °C | -1.7 °C | -17.2 °C | 7.2 °C | -4.4 °C | -24.0 °C | 14.3 mm | 0.7 mm | — | — |
| May | 28.0 °C | 5.6 °C | -6.6 °C | 20.0 °C | 2.8 °C | -8.9 °C | 14.8 °C | 0.1 °C | -11.9 °C | 34.4 mm | 1.0 mm | — | — |
| June | 30.4 °C | 11.4 °C | 0.7 °C | 25.7 °C | 7.7 °C | -0.7 °C | 20.7 °C | 4.5 °C | -4.4 °C | 49.2 mm | 1.5 mm | — | — |
| July | 34.5 °C | 15.4 °C | 4.1 °C | 27.2 °C | 11.5 °C | 2.6 °C | 22.7 °C | 8.1 °C | -0.5 °C | 62.2 mm | 1.6 mm | — | — |
| August | 38.4 °C | 14.3 °C | 5.4 °C | 29.6 °C | 10.9 °C | 3.7 °C | 20.7 °C | 8.0 °C | -0.8 °C | 81.4 mm | 1.8 mm | — | — |
| September | 25.8 °C | 9.8 °C | -2.0 °C | 19.6 °C | 7.2 °C | -4.6 °C | 15.7 °C | 4.8 °C | -7.5 °C | 41.0 mm | 2.0 mm | — | — |
| October | 14.2 °C | 3.9 °C | -9.9 °C | 11.8 °C | 1.6 °C | -14.4 °C | 10.7 °C | -0.6 °C | -20.7 °C | 36.0 mm | 1.8 mm | — | — |
| November | 11.2 °C | -0.1 °C | -18.0 °C | 7.8 °C | -2.8 °C | -20.0 °C | 5.9 °C | -5.6 °C | -23.5 °C | 27.7 mm | 1.2 mm | — | — |
| December | 9.1 °C | -2.7 °C | -21.7 °C | 5.1 °C | -5.6 °C | -24.3 °C | 3.4 °C | -8.7 °C | -28.4 °C | 16.8 mm | 0.9 mm | — | — |
Data Visualisations
Remove WatermarksCurrent Year Climate Trends vs Historical


Max Temperature this Year | 1 of 6
Climate 12-Month Moving Averages


Max Temperature 12-Month MA | 1 of 6
Daily Data Points and Averages Throughout the Year

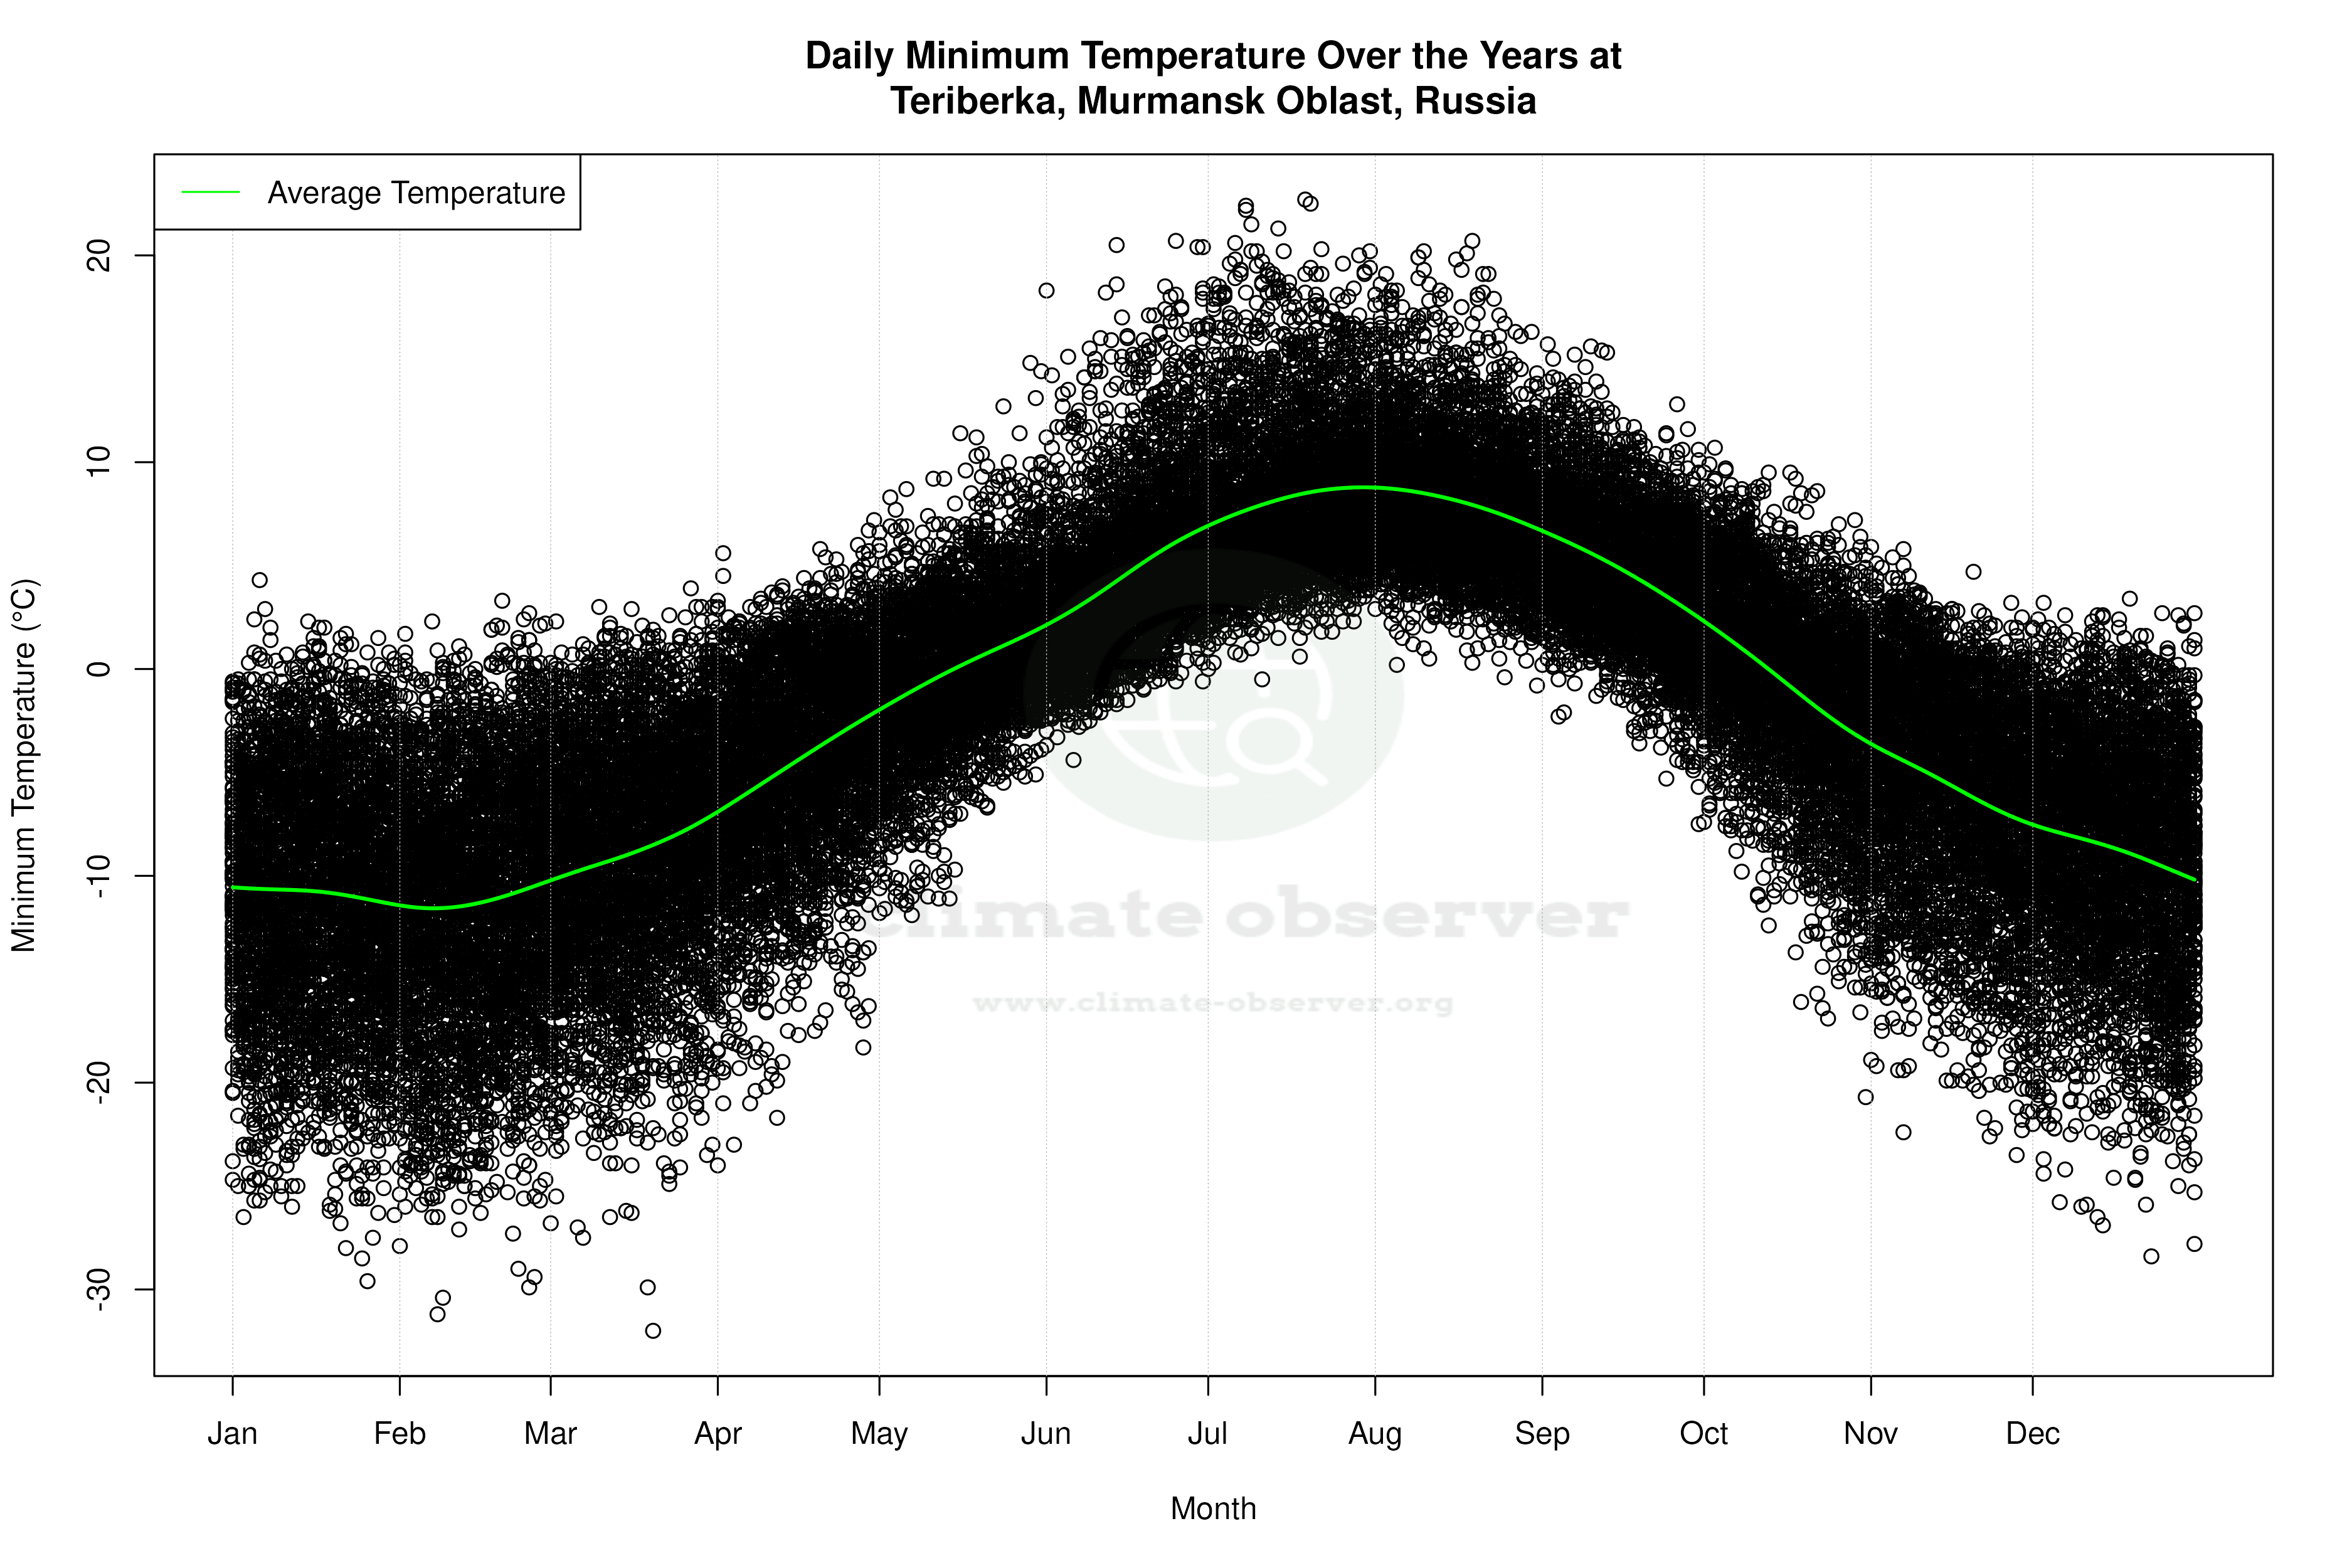


Average Max Temperature Throughout Year | 1 of 5
