Climate for Station: Arhangelsk, Arkhangelsk Oblast, Russia
Loading live weather...
Climate Analysis & Overview
Arhangelsk, a city steeped in history and nestled in the northwestern part of Russia, is experiencing a subtle warming trend, with highs rising over time. The precipitation pattern has become more evenly distributed, indicating a shift in the region's climatic behaviour. These changes align with broader regional climate goals aimed at understanding and adapting to evolving weather patterns.
Subtle Warming in the North
Arhangelsk, lying within the Dfb classification of the Köppen climate system, experiences a humid continental climate with cold winters and mild summers. The all-time temperature trends reveal a warming pattern, with high temperatures increasing by 0.18°C (0.32°F) over the years. This warming is more pronounced over the past decade, with a rise of 0.22°C (0.40°F) in high temperatures. Conversely, the lows have shown a slight cooling trend of 0.18°C (0.32°F) in the last ten years, despite an all-time warming of 0.07°C (0.13°F). These trends suggest a complex interplay of climatic factors, possibly influenced by the White Sea's moderating effects and regional climate initiatives.
Temperature Extremes: A Historical Perspective
Arhangelsk's temperature records highlight the region's climatic extremes, with an all-time high of 34.4°C (93.9°F) and a chilling low of -45.2°C (-49.4°F). These figures underscore the city's capacity for significant temperature variability, a characteristic feature of its continental climate. Such extremes are vital for understanding the potential impacts of climate change on local ecosystems and infrastructure.
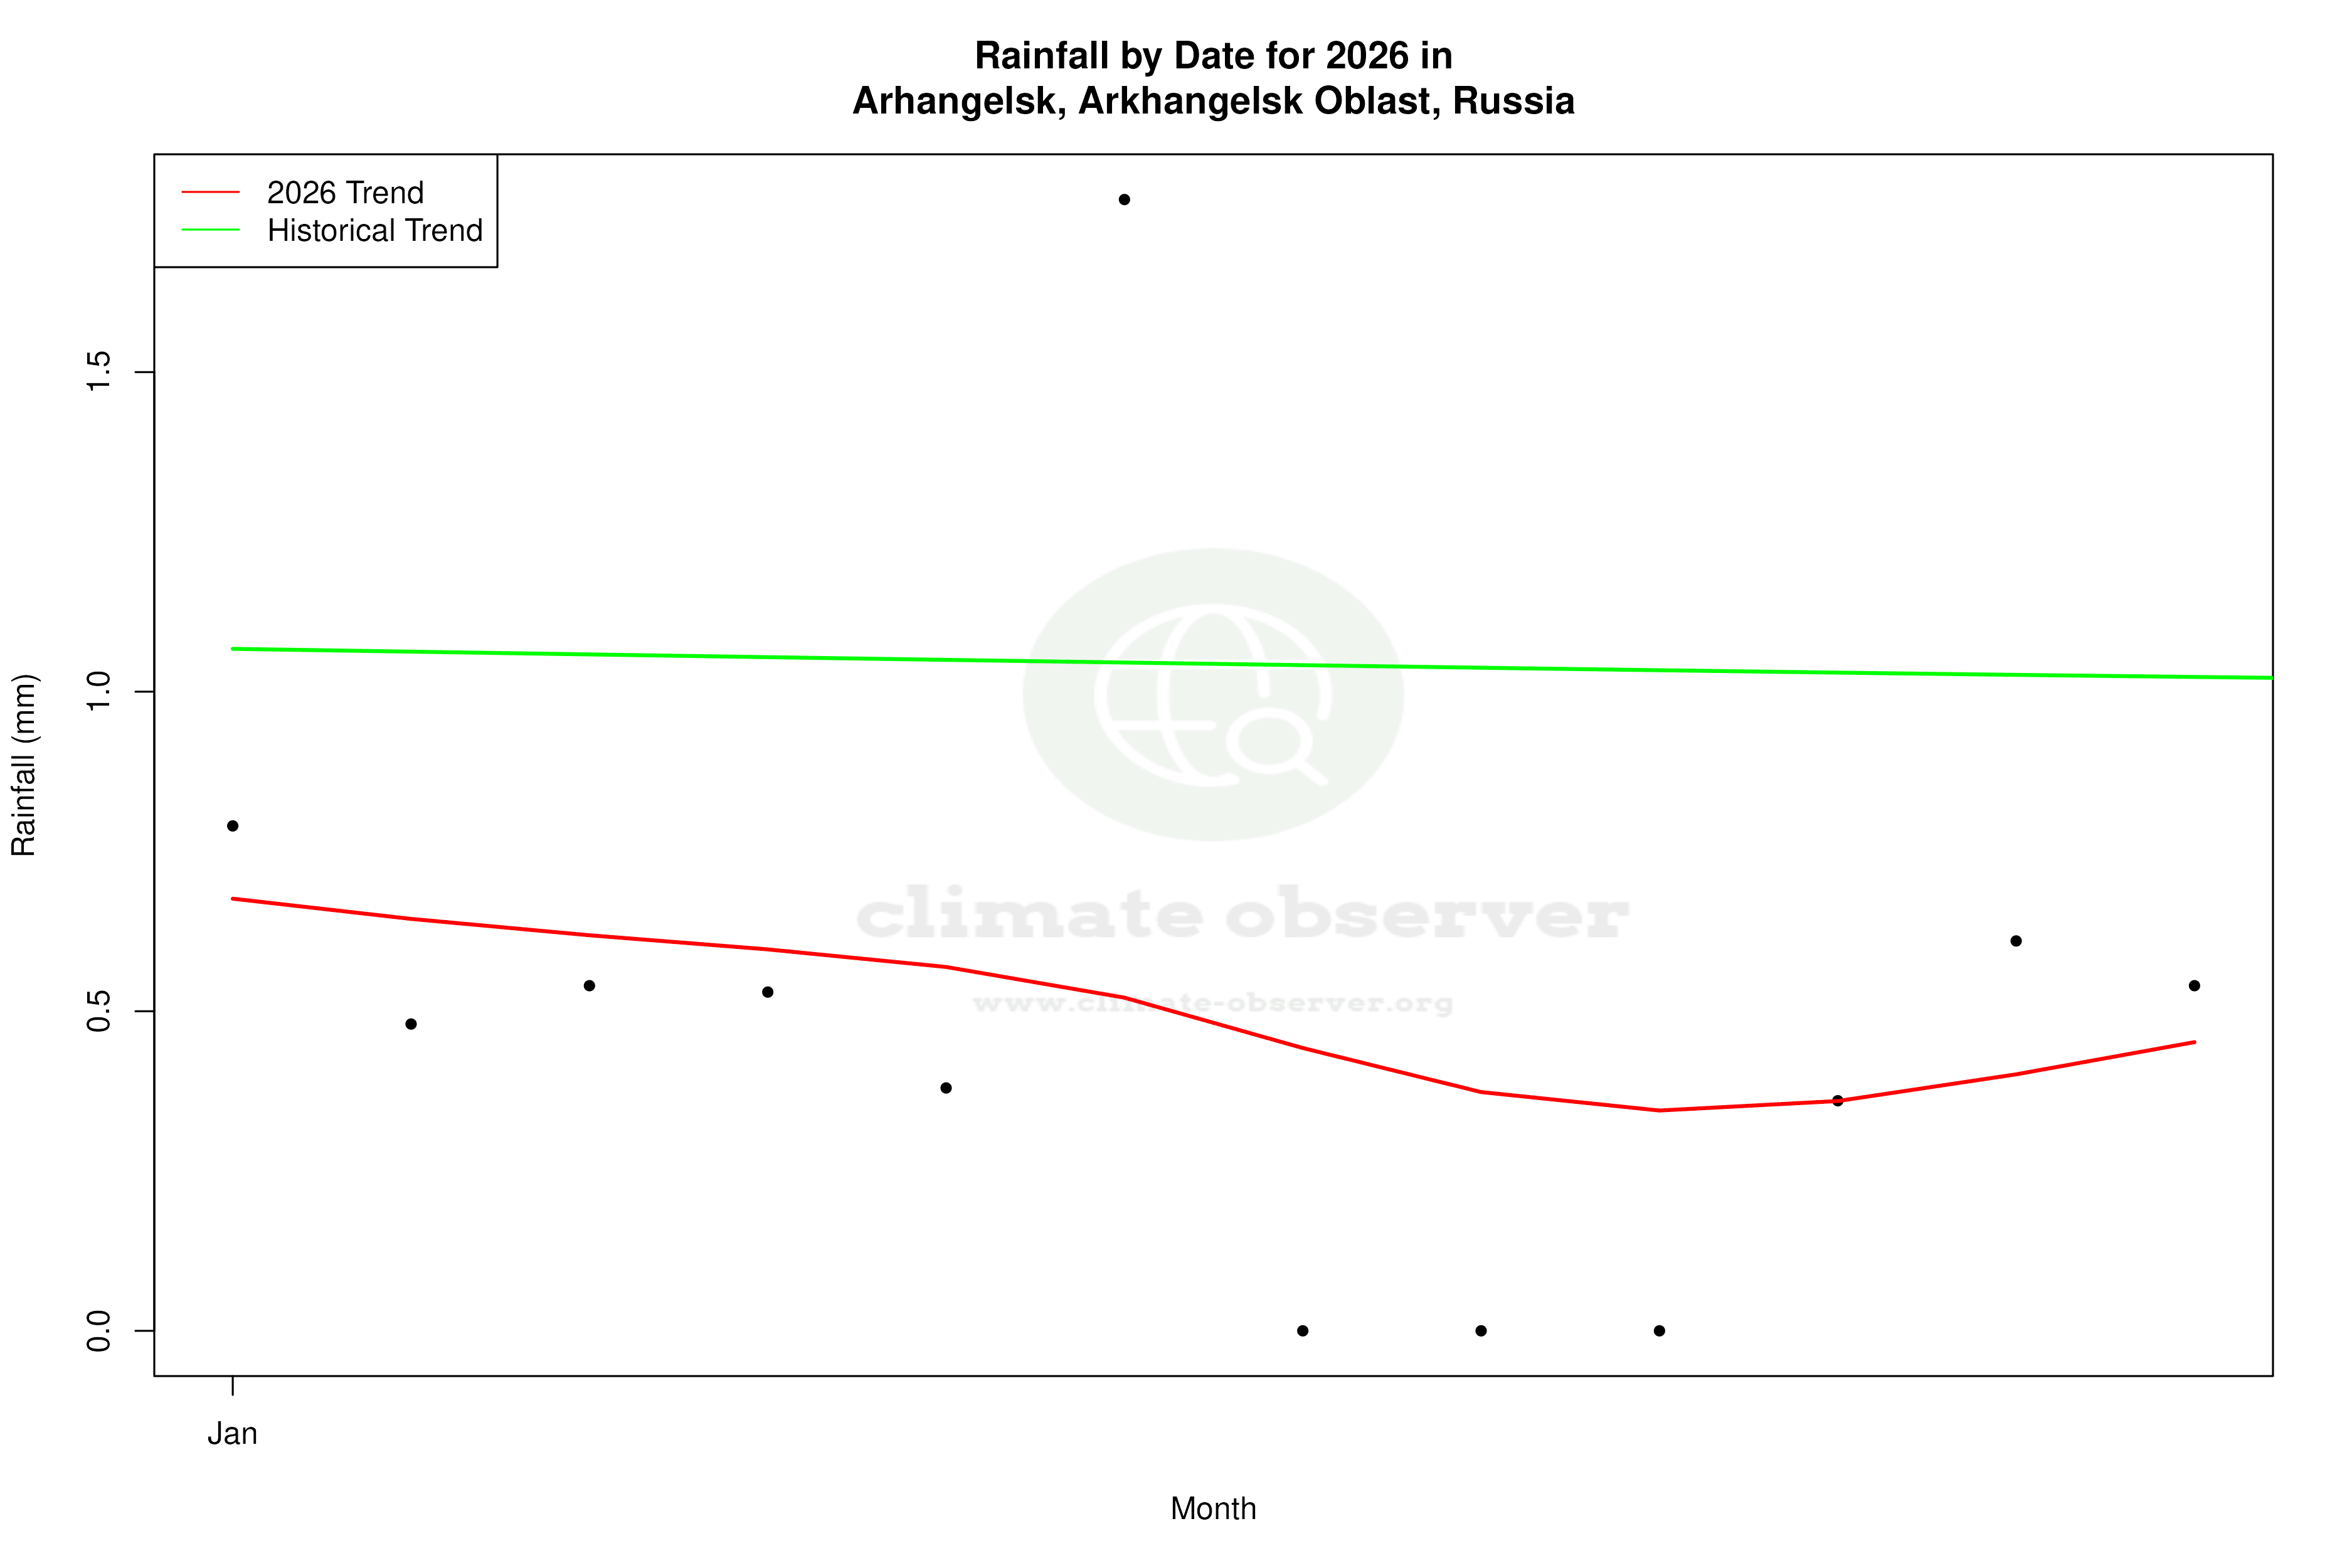
Precipitation Patterns: A Shift Towards Evenness
The Precipitation Concentration Index (PCI) for Arhangelsk has seen a decrease from a baseline of 11.2 to a current value of 9.5, indicating a more even distribution of rainfall throughout the year. This shift suggests a reduction in the concentration of precipitation events, which could lead to more consistent water availability and reduced flood risks. The PCI is a crucial metric for assessing how precipitation patterns evolve, impacting agriculture and water management strategies.
Regional Climate Goals and Implications
Russia's regional climate goals focus on adapting to and mitigating the impacts of climate change. The observed warming trend in Arhangelsk aligns with these objectives, highlighting the importance of monitoring and understanding local climatic shifts. Recent weather events, such as unseasonably warm winters, emphasize the need for adaptive strategies in urban planning and natural resource management. As Arhangelsk continues to navigate these changes, the integration of scientific insights into policy-making will be essential for fostering resilience in the face of a warming climate.
Station Statistics
10-Year Trend
High: -0.16 °C/decade
Low: -0.32 °C/decade
Rain: -0.05 mm/decade
25-Year Trend
High: +0.49 °C/decade
Low: +0.56 °C/decade
Rain: +0.11 mm/decade
50-Year Trend
High: +0.40 °C/decade
Low: +0.47 °C/decade
Rain: +0.07 mm/decade
All-Time Trend
High: +0.19 °C/decade
Low: +0.07 °C/decade
Rain: +0.05 mm/decade
Percentage Above-Average Days
Last 12 Months: 52.3%
This Year: 70.0%
Precipitation Concentration Index (PCI) ℹ️
Last 12 Months: 9.6
Historical Average: 11.8
Percentile Rank of Last 12 Months ℹ️
High: 93rd percentile
Low: 90th percentile
Rain: 82nd percentile
Change in Variance ℹ️
High: -5.8%
Low: -12.8%
Intraday: +23.5%
Data Coverage
96.0%
First Year of Data
1881
Station Location
Historical Weather Records
| Max High | Avg High | Min High | Max Avg | Avg Avg | Min Avg | Max Low | Avg Low | Min Low | Max Precipitation | Avg Precipitation | Max Snow | Avg Snow | |
|---|---|---|---|---|---|---|---|---|---|---|---|---|---|
| Record | 34.4 °C | — | -43.1 °C | 28.4 °C | — | -44.2 °C | 23.0 °C | — | -45.2 °C | 62.6 mm | — | — | — |
| January | 5.0 °C | -9.3 °C | -43.1 °C | 3.2 °C | -12.6 °C | -44.2 °C | 2.5 °C | -16.3 °C | -45.2 °C | 20.9 mm | 1.0 mm | — | — |
| February | 5.2 °C | -8.0 °C | -31.8 °C | 3.8 °C | -11.7 °C | -37.6 °C | 2.5 °C | -15.4 °C | -41.2 °C | 15.7 mm | 0.9 mm | — | — |
| March | 12.3 °C | -2.5 °C | -21.6 °C | 6.6 °C | -6.9 °C | -29.2 °C | 4.0 °C | -11.3 °C | -37.1 °C | 16.2 mm | 0.8 mm | — | — |
| April | 25.3 °C | 4.4 °C | -11.7 °C | 16.9 °C | -0.1 °C | -18.2 °C | 10.9 °C | -4.4 °C | -27.3 °C | 22.4 mm | 0.9 mm | — | — |
| May | 33.0 °C | 11.4 °C | -5.8 °C | 25.9 °C | 6.5 °C | -10.2 °C | 20.0 °C | 2.0 °C | -13.7 °C | 43.4 mm | 1.3 mm | — | — |
| June | 33.0 °C | 17.9 °C | 0.0 °C | 26.1 °C | 12.8 °C | -1.5 °C | 20.2 °C | 7.8 °C | -3.9 °C | 54.2 mm | 1.9 mm | — | — |
| July | 34.4 °C | 21.3 °C | 7.0 °C | 28.4 °C | 16.2 °C | 5.0 °C | 23.0 °C | 11.4 °C | -0.5 °C | 57.0 mm | 2.1 mm | — | — |
| August | 33.4 °C | 18.5 °C | 6.4 °C | 26.3 °C | 13.8 °C | 3.1 °C | 21.3 °C | 9.7 °C | -4.1 °C | 62.6 mm | 2.1 mm | — | — |
| September | 27.7 °C | 12.0 °C | 0.2 °C | 20.5 °C | 8.3 °C | -2.1 °C | 16.0 °C | 5.3 °C | -7.5 °C | 49.2 mm | 2.0 mm | — | — |
| October | 18.3 °C | 4.3 °C | -11.4 °C | 14.7 °C | 1.8 °C | -17.4 °C | 11.7 °C | -0.3 °C | -21.1 °C | 25.0 mm | 1.8 mm | — | — |
| November | 10.0 °C | -2.0 °C | -27.5 °C | 9.0 °C | -4.5 °C | -34.1 °C | 7.0 °C | -7.0 °C | -36.5 °C | 26.7 mm | 1.4 mm | — | — |
| December | 5.8 °C | -6.3 °C | -39.2 °C | 5.2 °C | -9.5 °C | -41.2 °C | 4.1 °C | -12.8 °C | -43.2 °C | 22.3 mm | 1.2 mm | — | — |
Data Visualisations
Remove WatermarksCurrent Year Climate Trends vs Historical


Max Temperature this Year | 1 of 6
Climate 12-Month Moving Averages


Max Temperature 12-Month MA | 1 of 6
Daily Data Points and Averages Throughout the Year


Average Max Temperature Throughout Year | 1 of 5
