Climate for Station: Salekhard, Yamalo-Nenets Autonomous Okrug, Russia
Loading live weather...
Climate Analysis & Overview
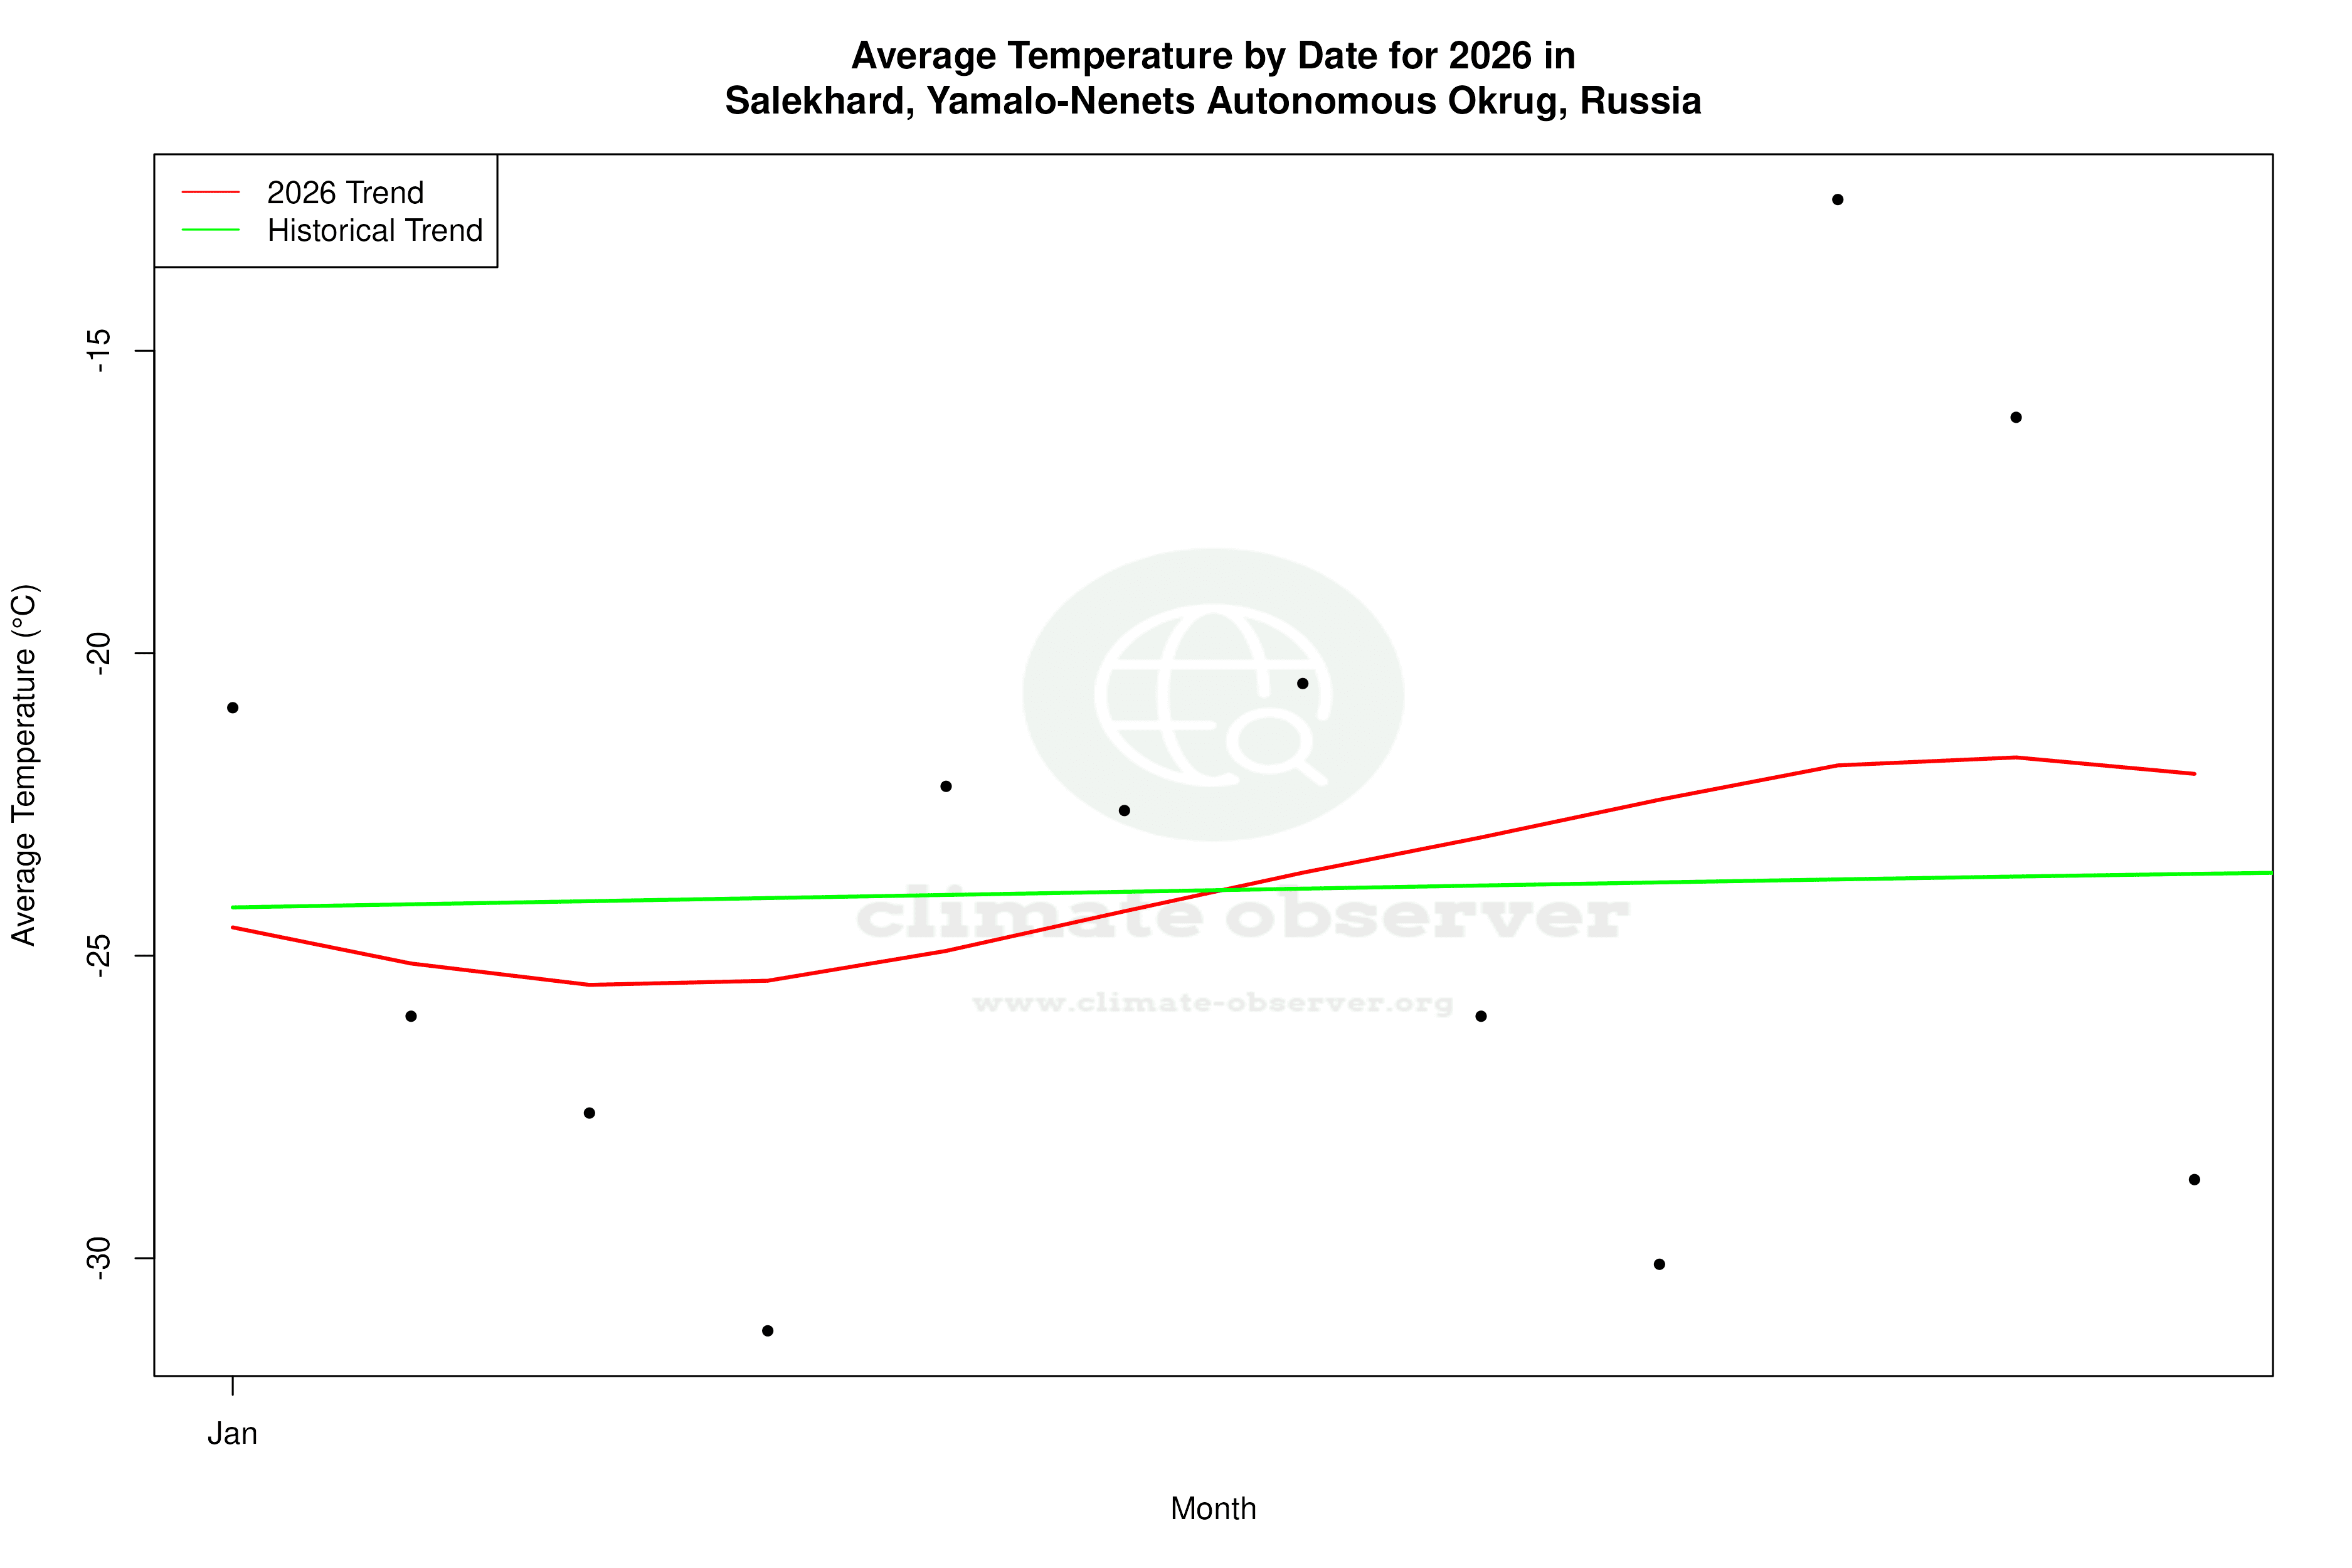
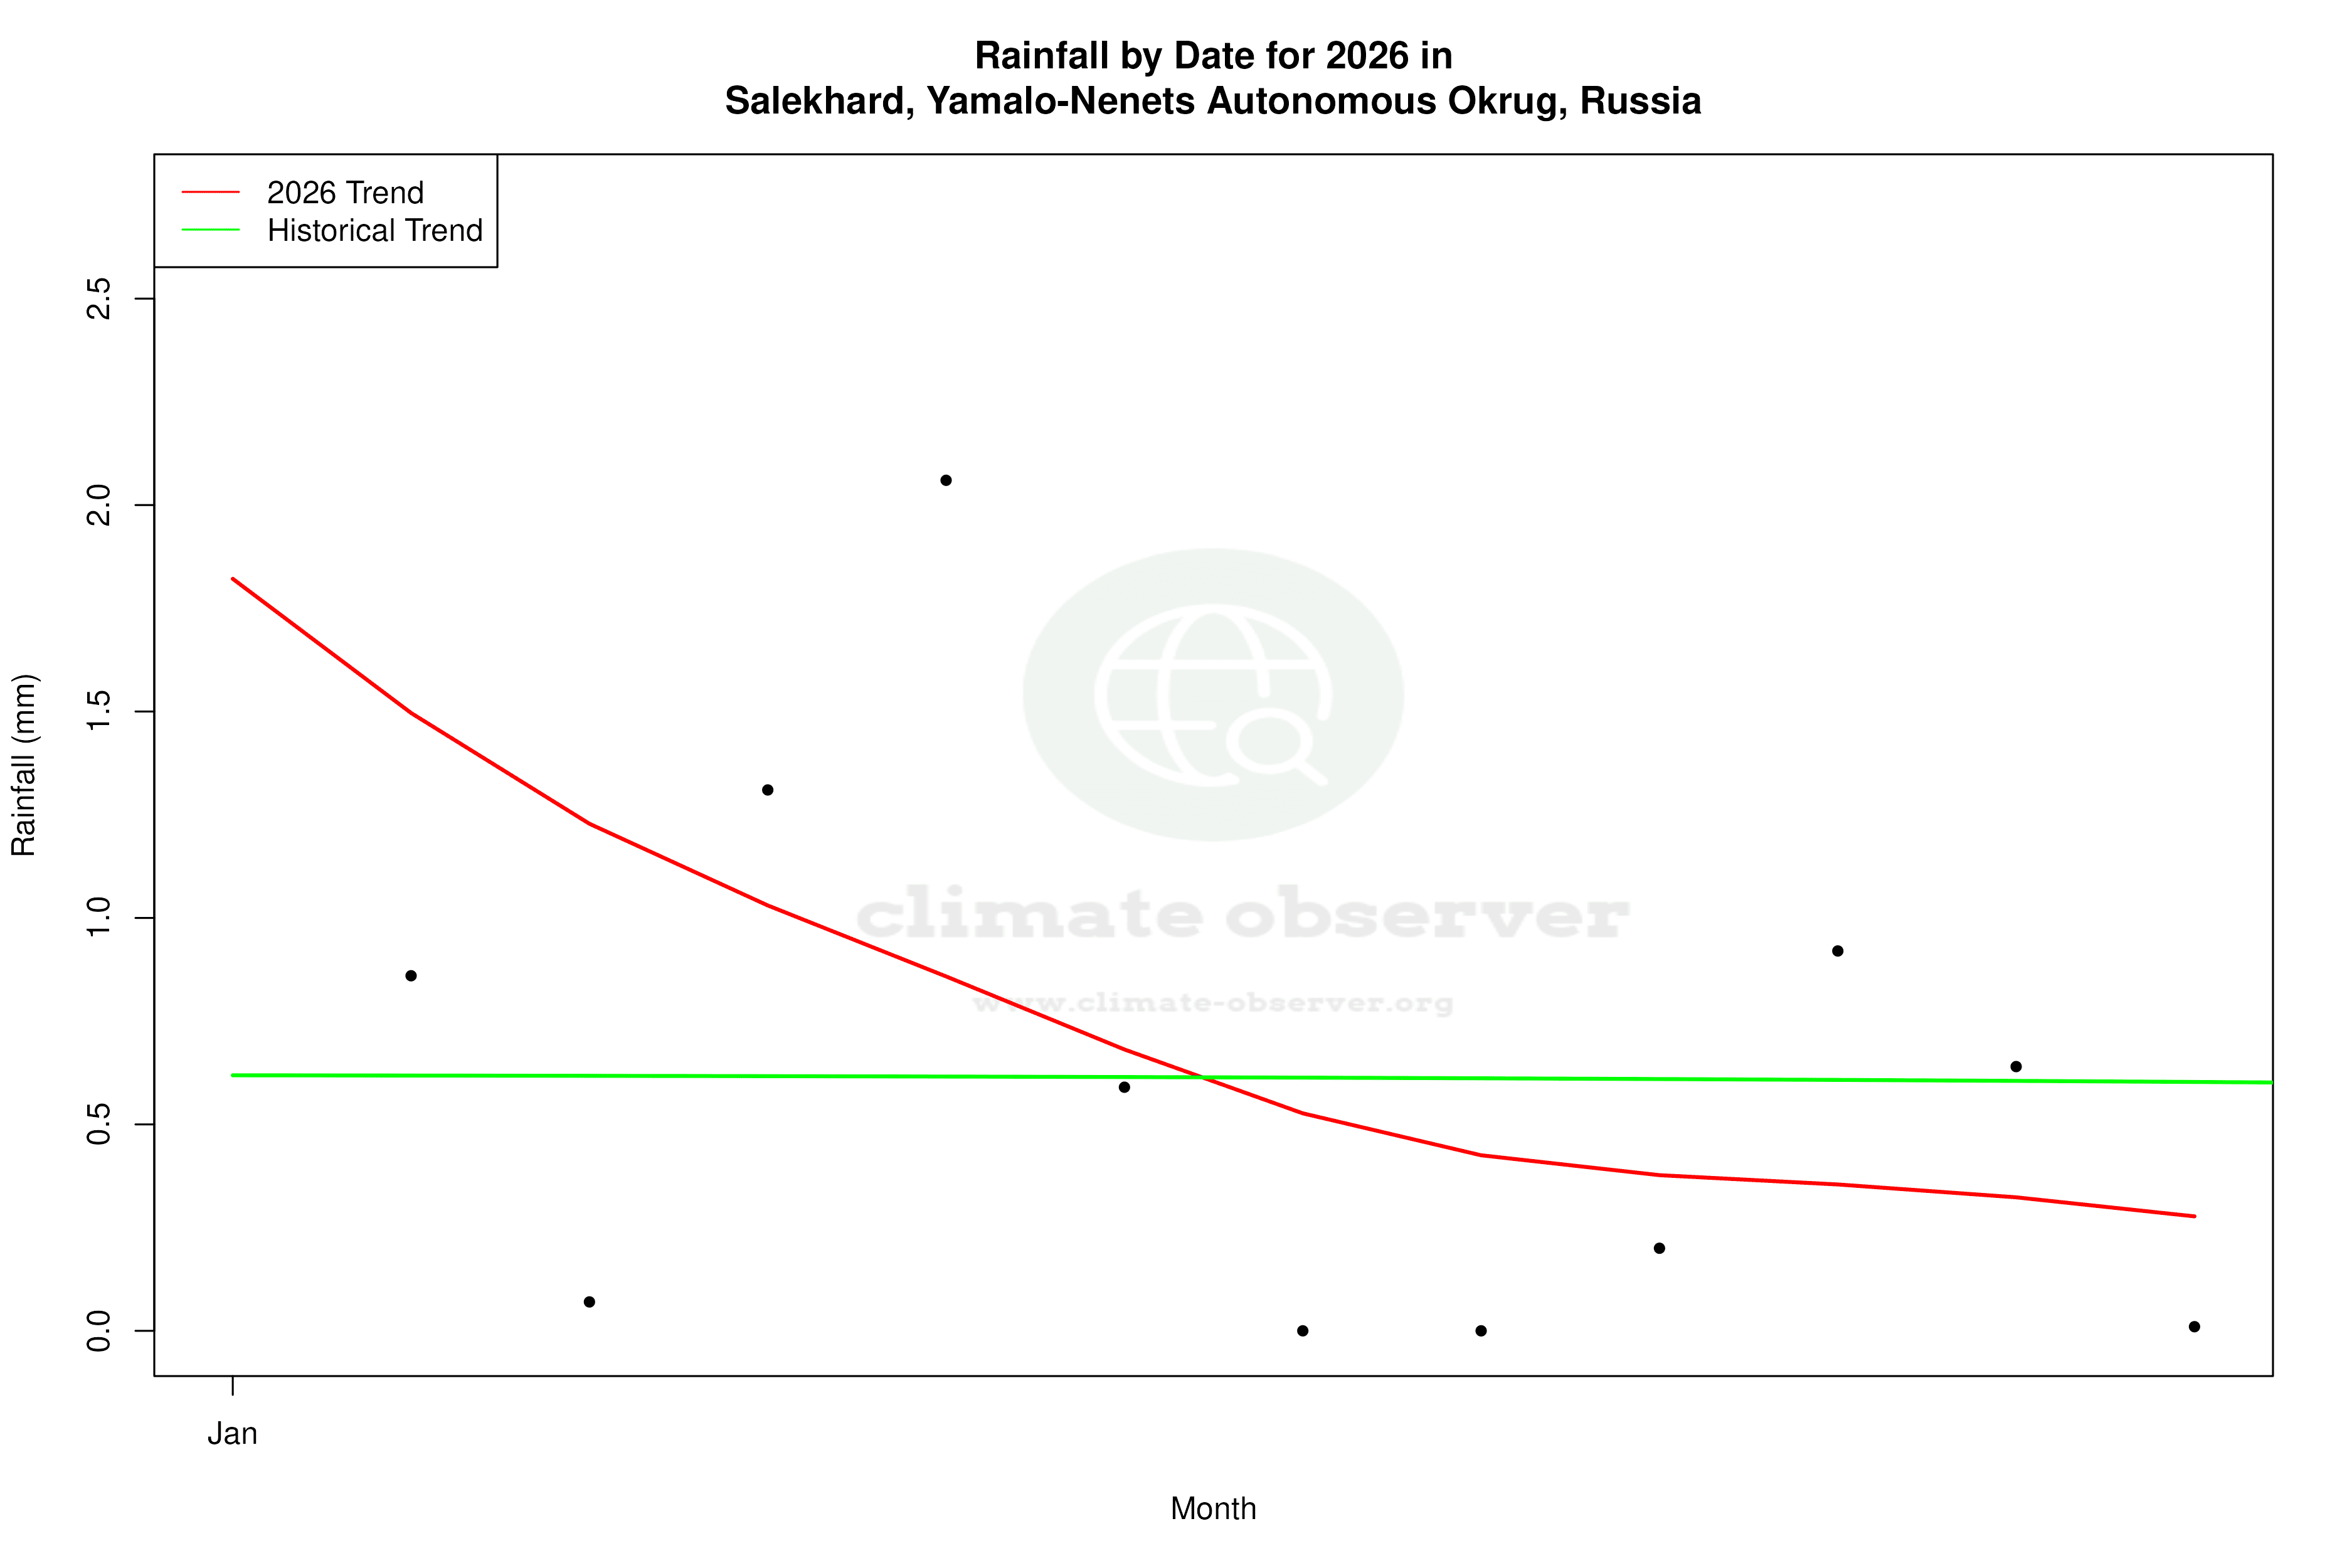
Salekhard, located in the Arctic Circle, is experiencing contrasting climate trends with a warming of low temperatures by 1.39°C (2.50°F) over the past decade, while high temperatures have shown a cooling trend of 0.26°C (0.47°F). The Precipitation Concentration Index has decreased, suggesting a more even distribution of rainfall.
Arctic Climate Dynamics
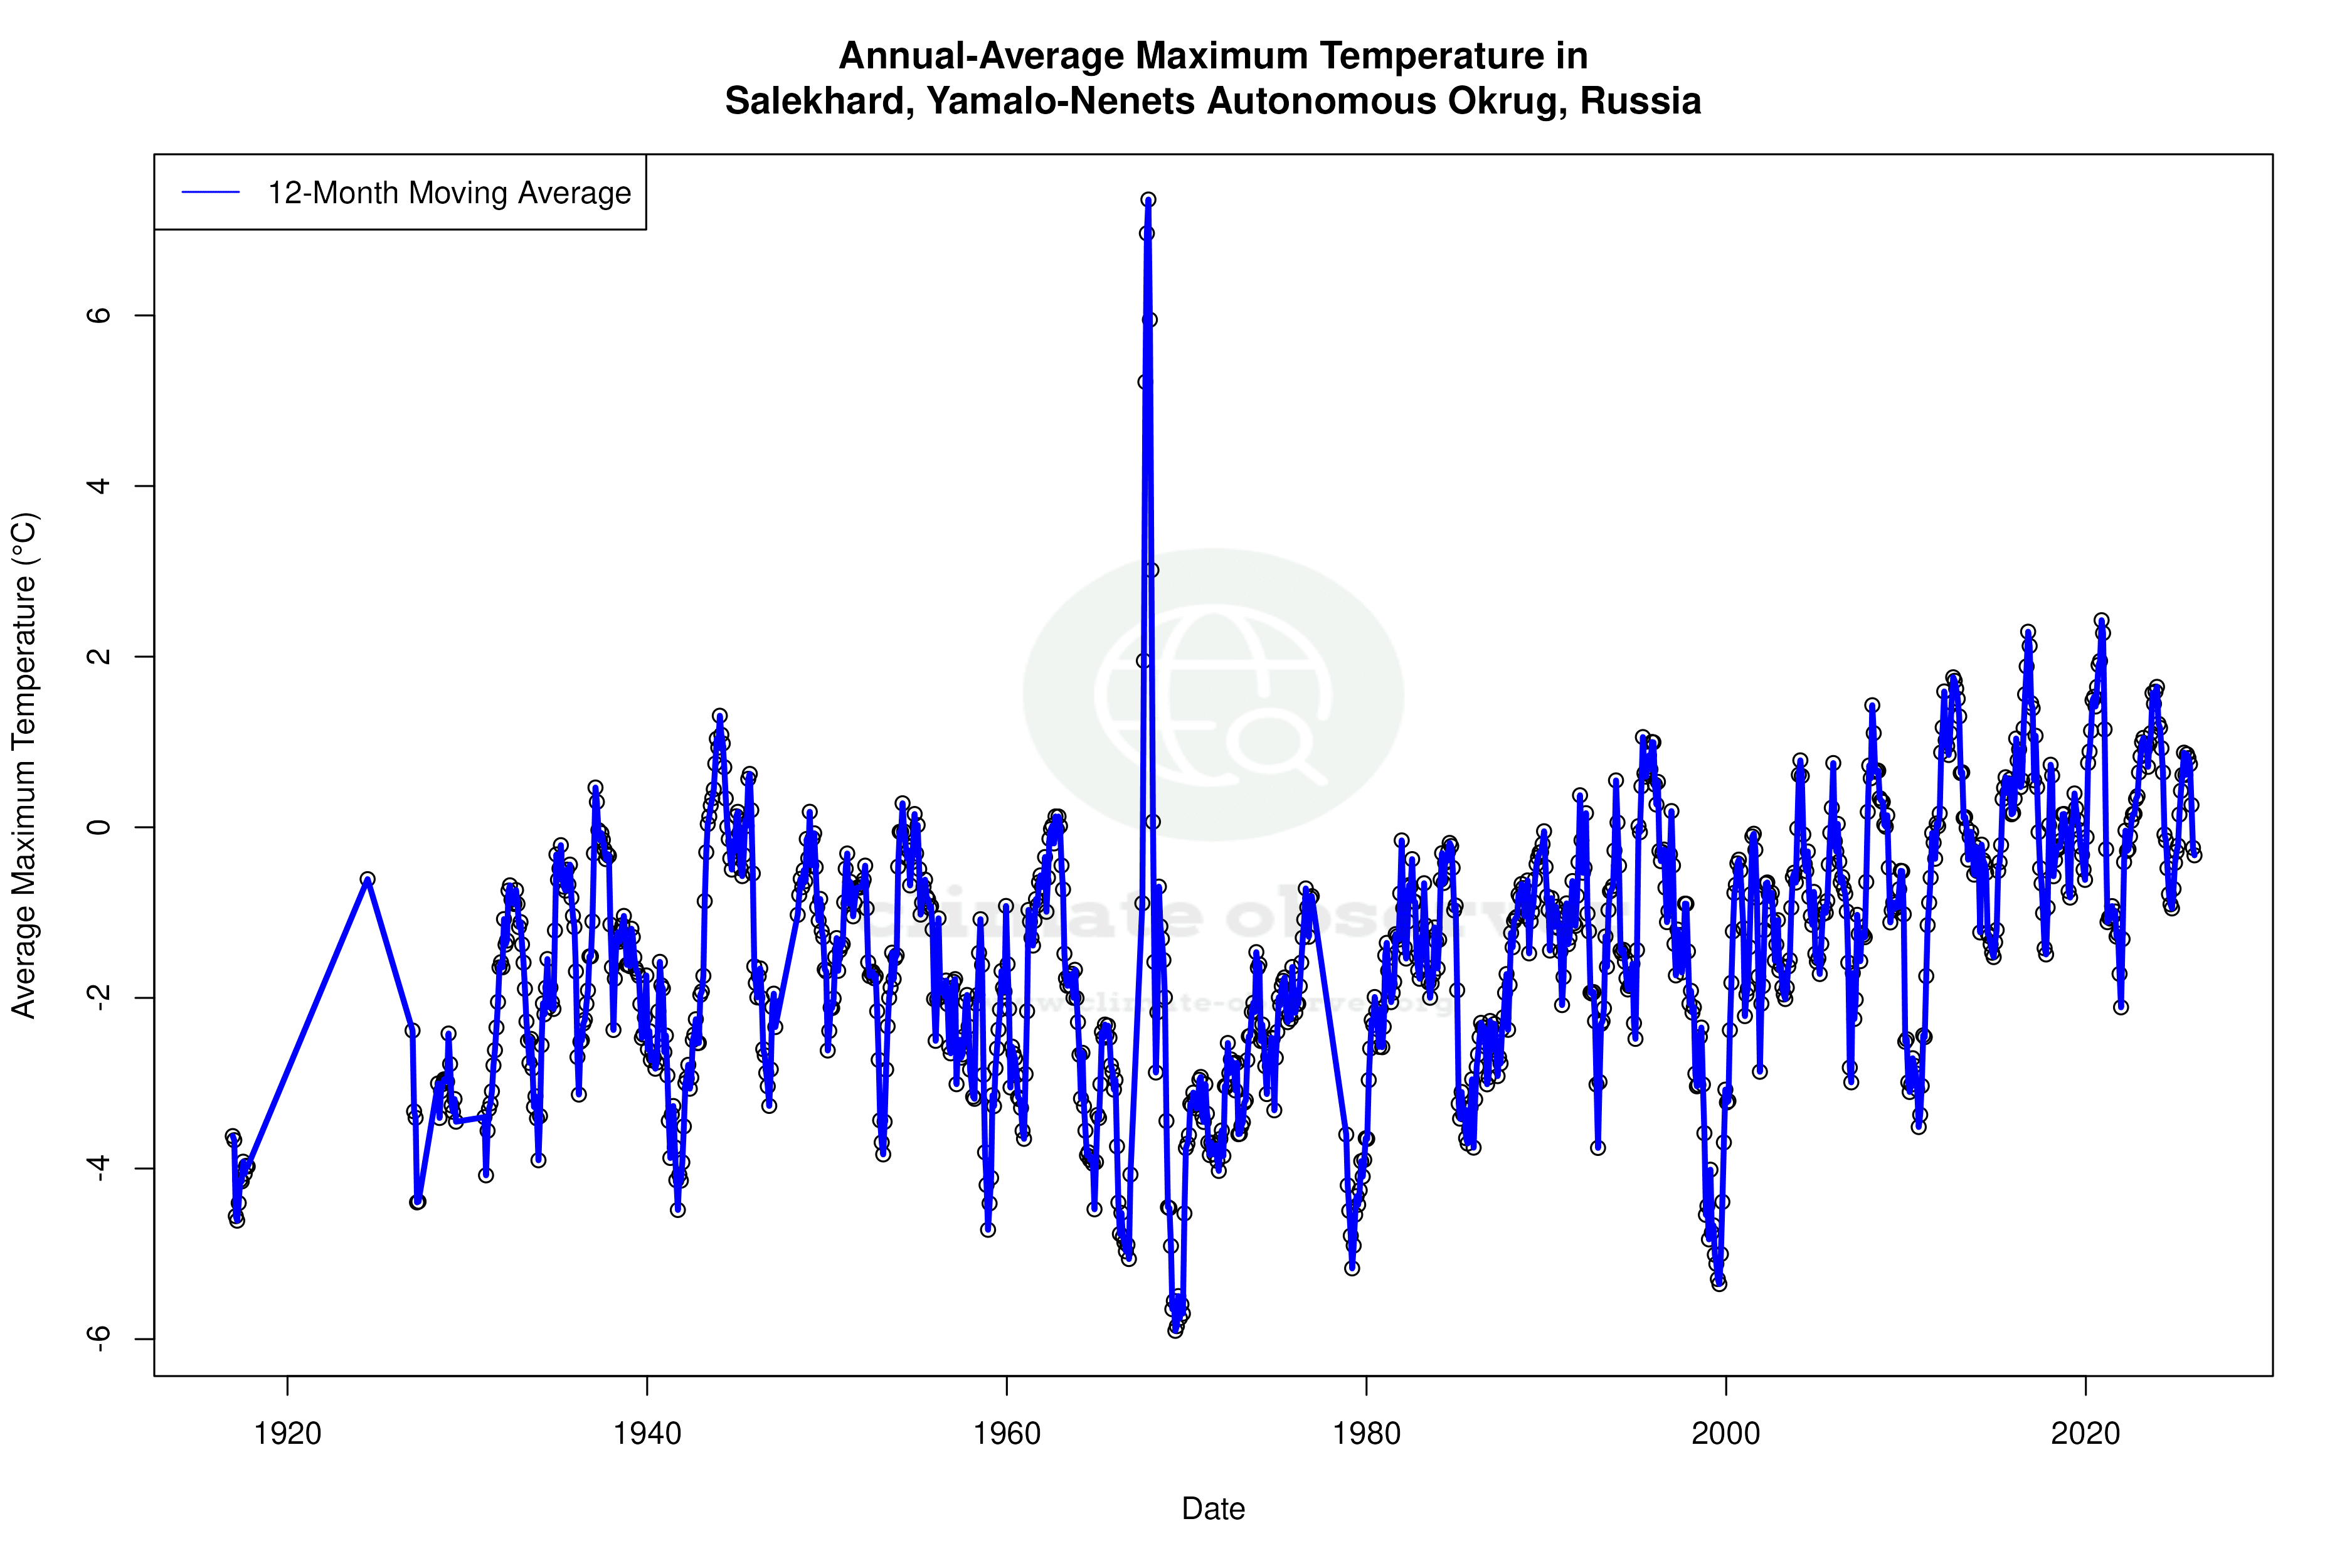
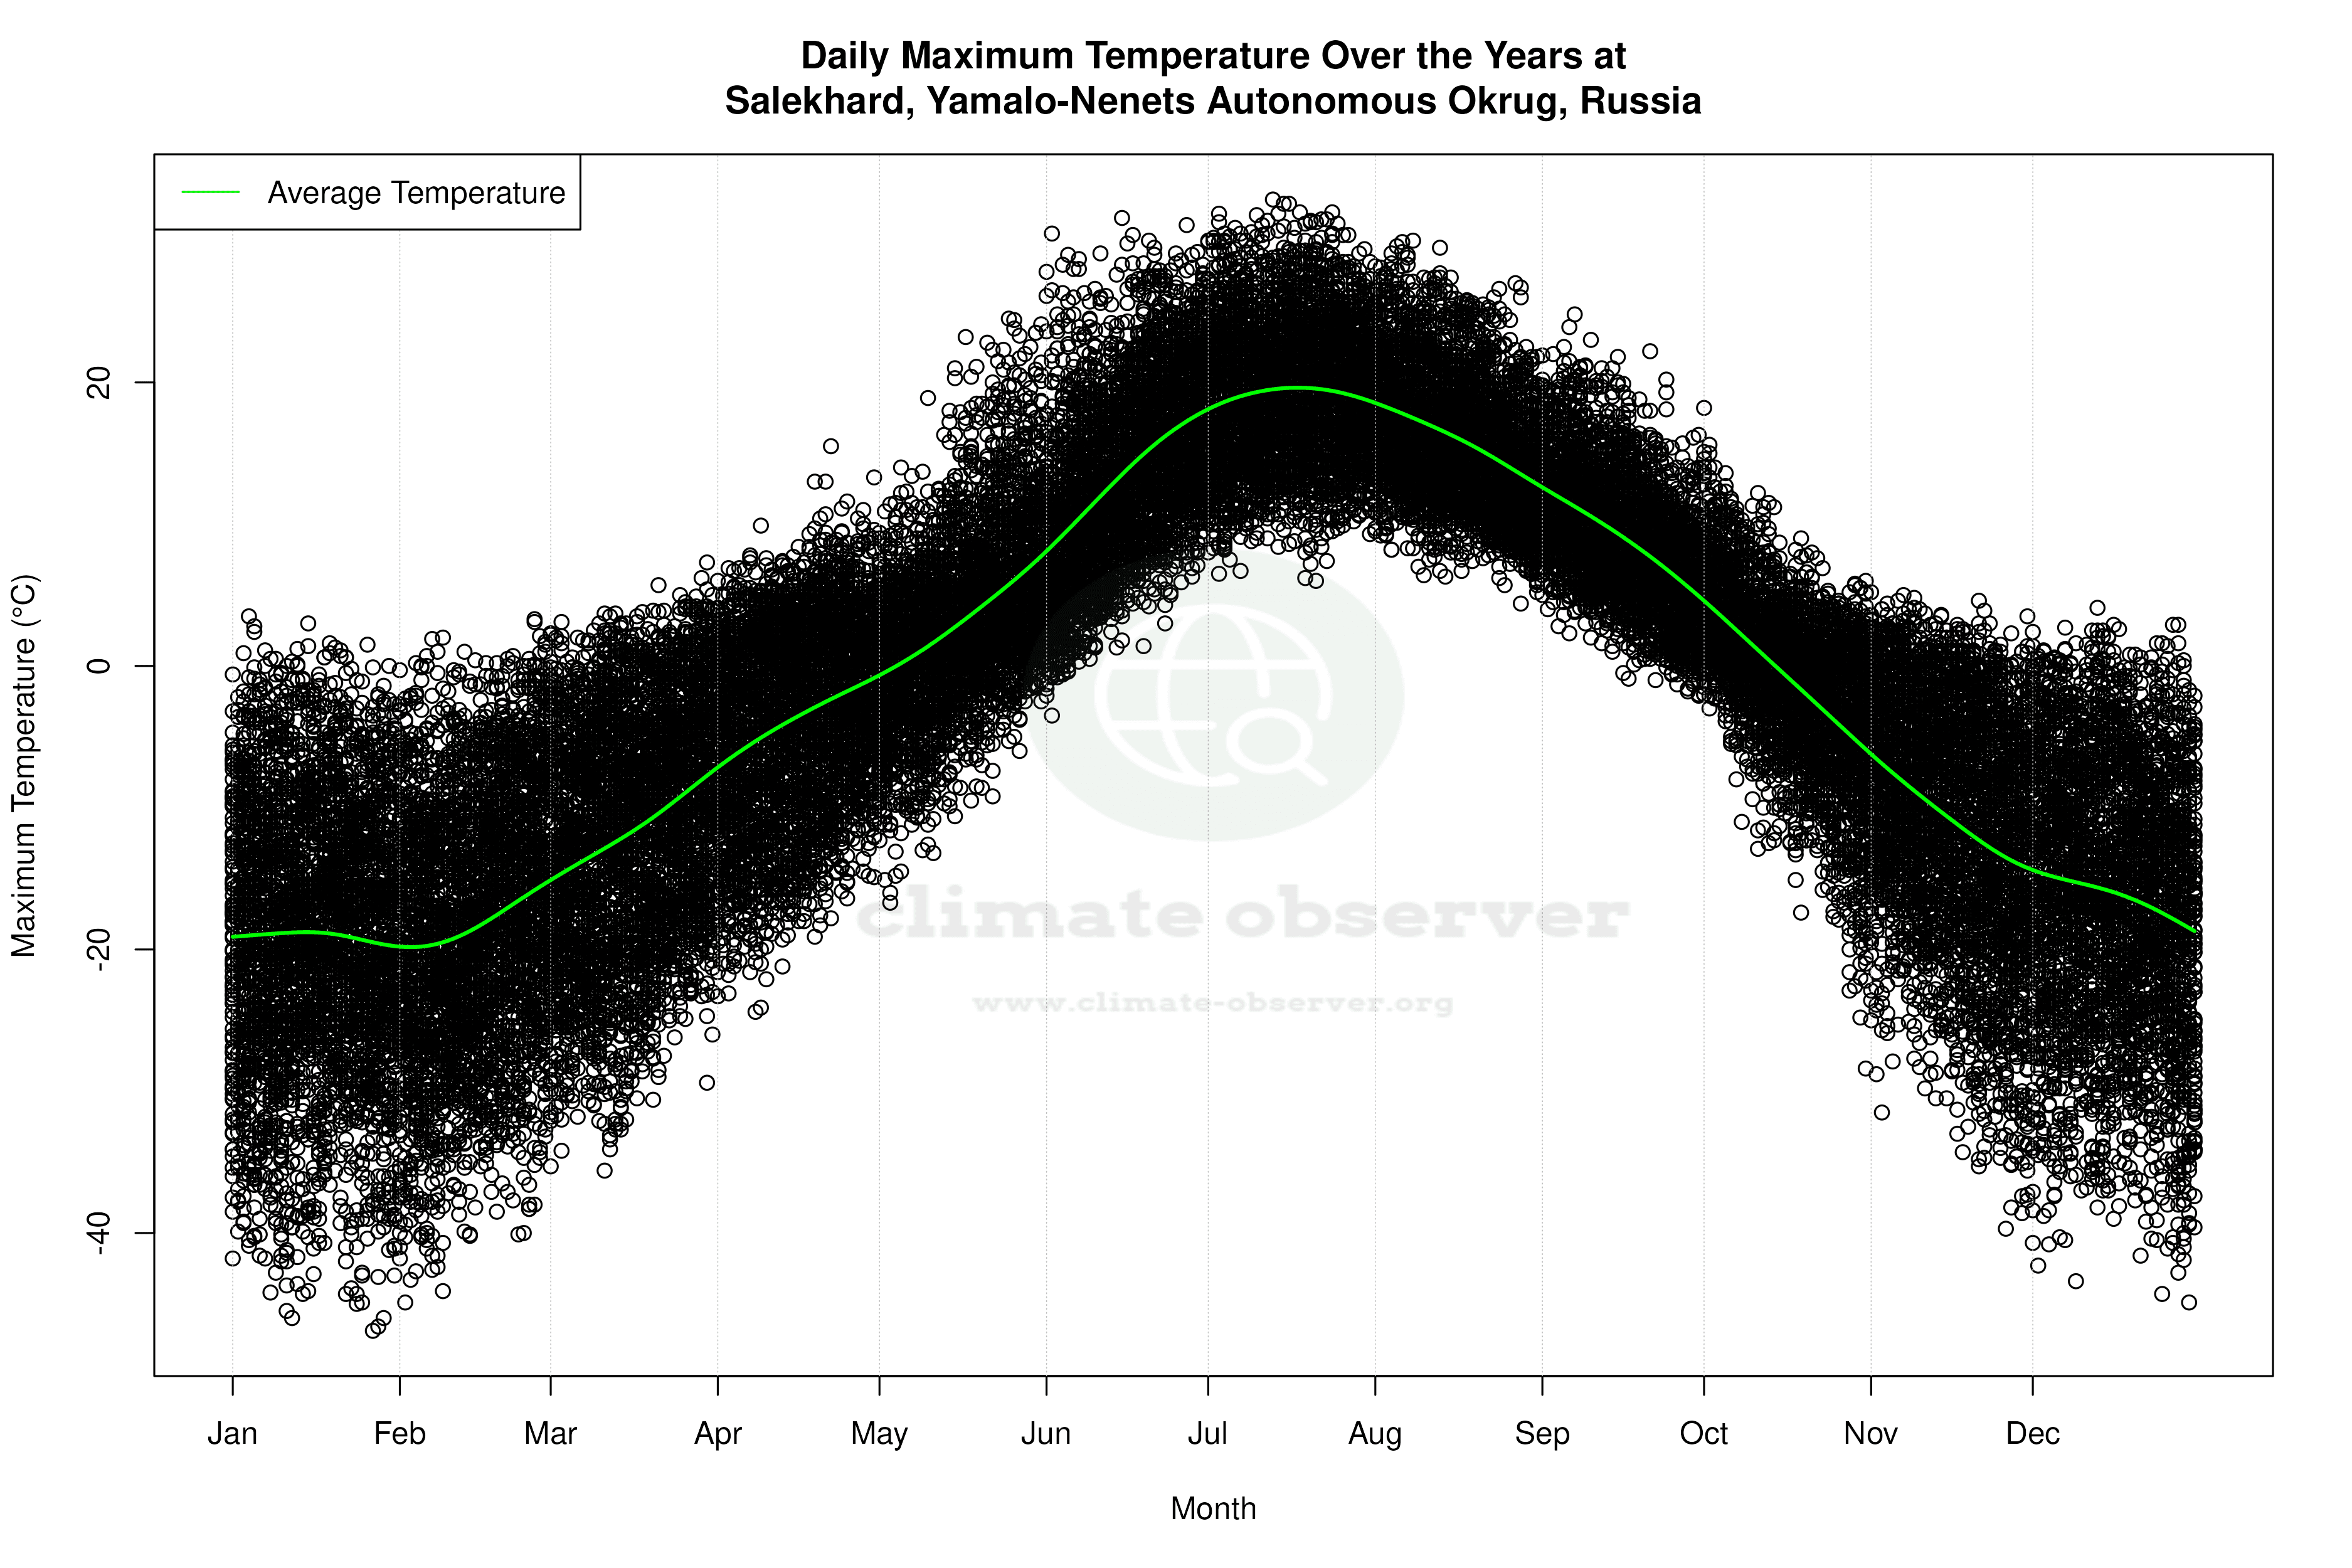
Salekhard, situated at the confluence of the Ob River and within the Arctic Circle, is classified under the Köppen climate classification as having a subarctic climate. This region is characterised by long, extremely cold winters and short, mild summers. The local geography, with its expansive tundra and proximity to large water bodies, significantly influences the climatic patterns observed here. Over the all-time scale, Salekhard has experienced a warming trend in both high and low temperatures, with highs rising by 0.20°C (0.36°F) and lows by 0.13°C (0.23°F). This gradual warming reflects broader trends observed across the Arctic, where climate change impacts are more pronounced.
Temperature Trends: A Tale of Two Extremes
In the past decade, Salekhard's climate has shown divergent temperature trends. The high temperatures have experienced a cooling of 0.26°C (0.47°F), contrasting with the warming of low temperatures by 1.39°C (2.50°F). This disparity suggests a narrowing of the temperature range, potentially impacting local ecosystems and human activities. The record high of 32.9°C (91.2°F) and record low of -53.7°C (-64.7°F) highlight the extreme temperature variability that characterises this region.
Precipitation Patterns: Towards Even Distribution
The Precipitation Concentration Index (PCI), which measures how rainfall is distributed over time, has decreased from a baseline of 12.13 to a current value of 10.55. This change indicates that precipitation events are becoming more evenly distributed throughout the year. Such a shift could mitigate the risk of flooding and droughts, offering a more stable water supply for the local environment and communities.
Implications for Regional Climate Goals
Russia's regional climate goals include adapting to and mitigating the impacts of climate change, particularly in vulnerable Arctic regions like Salekhard. The observed warming of low temperatures and more evenly distributed precipitation align with these goals by potentially reducing the severity of extreme weather events. However, the cooling of high temperatures may pose challenges for energy consumption and infrastructure resilience during the colder months.
Local Climate in a Global Context
Salekhard's climate profile is a microcosm of the broader changes occurring in the Arctic. The region's warming trends, particularly in low temperatures, are consistent with global patterns driven by anthropogenic climate change. As the world continues to grapple with these changes, understanding localised climate dynamics becomes crucial for developing effective adaptation and mitigation strategies.
Station Statistics
10-Year Trend
High: -0.69 °C/decade
Low: +1.24 °C/decade
Rain: +0.01 mm/decade
25-Year Trend
High: +0.63 °C/decade
Low: +1.12 °C/decade
Rain: +0.13 mm/decade
50-Year Trend
High: +0.53 °C/decade
Low: +0.55 °C/decade
Rain: +0.06 mm/decade
All-Time Trend
High: +0.20 °C/decade
Low: +0.14 °C/decade
Rain: +0.05 mm/decade
Percentage Above-Average Days
Last 12 Months: 54.5%
This Year: 65.8%
Precipitation Concentration Index (PCI) ℹ️
Last 12 Months: 10.9
Historical Average: 11.8
Percentile Rank of Last 12 Months ℹ️
High: 69th percentile
Low: 97th percentile
Rain: 84th percentile
Change in Variance ℹ️
High: -0.2%
Low: -2.0%
Intraday: +11.5%
Data Coverage
89.4%
First Year of Data
1882
Station Location
Historical Weather Records
| Max High | Avg High | Min High | Max Avg | Avg Avg | Min Avg | Max Low | Avg Low | Min Low | Max Precipitation | Avg Precipitation | Max Snow | Avg Snow | |
|---|---|---|---|---|---|---|---|---|---|---|---|---|---|
| Record | 32.9 °C | — | -46.9 °C | 27.2 °C | — | -51.9 °C | 21.2 °C | — | -53.7 °C | 72.7 mm | — | — | — |
| January | 3.5 °C | -19.0 °C | -46.9 °C | -0.3 °C | -23.7 °C | -51.9 °C | -4.1 °C | -28.2 °C | -51.3 °C | 11.0 mm | 0.6 mm | — | — |
| February | 3.3 °C | -18.3 °C | -44.9 °C | 0.5 °C | -22.4 °C | -50.4 °C | -1.3 °C | -27.1 °C | -53.7 °C | 22.3 mm | 0.5 mm | — | — |
| March | 7.3 °C | -11.6 °C | -35.6 °C | 3.0 °C | -16.9 °C | -42.3 °C | 2.0 °C | -21.9 °C | -47.4 °C | 16.0 mm | 0.5 mm | — | — |
| April | 15.5 °C | -3.6 °C | -24.4 °C | 9.0 °C | -8.8 °C | -28.1 °C | 3.5 °C | -13.8 °C | -38.7 °C | 54.1 mm | 0.7 mm | — | — |
| May | 24.5 °C | 3.2 °C | -16.7 °C | 23.5 °C | -0.9 °C | -20.9 °C | 14.5 °C | -4.7 °C | -30.8 °C | 34.6 mm | 1.0 mm | — | — |
| June | 31.6 °C | 13.5 °C | -3.5 °C | 24.2 °C | 8.7 °C | -5.7 °C | 18.7 °C | 4.6 °C | -11.0 °C | 46.9 mm | 1.6 mm | — | — |
| July | 32.9 °C | 19.2 °C | 6.0 °C | 27.2 °C | 14.4 °C | 2.5 °C | 21.2 °C | 9.7 °C | -1.0 °C | 72.7 mm | 1.9 mm | — | — |
| August | 30.0 °C | 15.9 °C | 4.4 °C | 24.2 °C | 11.6 °C | 2.0 °C | 19.9 °C | 7.6 °C | -5.5 °C | 52.5 mm | 1.9 mm | — | — |
| September | 24.8 °C | 9.1 °C | -2.1 °C | 17.6 °C | 5.5 °C | -6.9 °C | 14.4 °C | 2.6 °C | -9.6 °C | 44.1 mm | 1.6 mm | — | — |
| October | 18.2 °C | -0.6 °C | -24.8 °C | 12.2 °C | -3.6 °C | -31.1 °C | 9.8 °C | -6.4 °C | -35.7 °C | 34.0 mm | 1.1 mm | — | — |
| November | 5.2 °C | -10.7 °C | -39.7 °C | 2.9 °C | -15.0 °C | -45.5 °C | 1.3 °C | -19.0 °C | -47.1 °C | 18.2 mm | 0.8 mm | — | — |
| December | 4.1 °C | -16.1 °C | -44.9 °C | 0.9 °C | -20.7 °C | -49.0 °C | -1.2 °C | -25.1 °C | -51.5 °C | 18.0 mm | 0.7 mm | — | — |
Data Visualisations
Remove WatermarksCurrent Year Climate Trends vs Historical


Max Temperature this Year | 1 of 6
Climate 12-Month Moving Averages


Max Temperature 12-Month MA | 1 of 6
Daily Data Points and Averages Throughout the Year

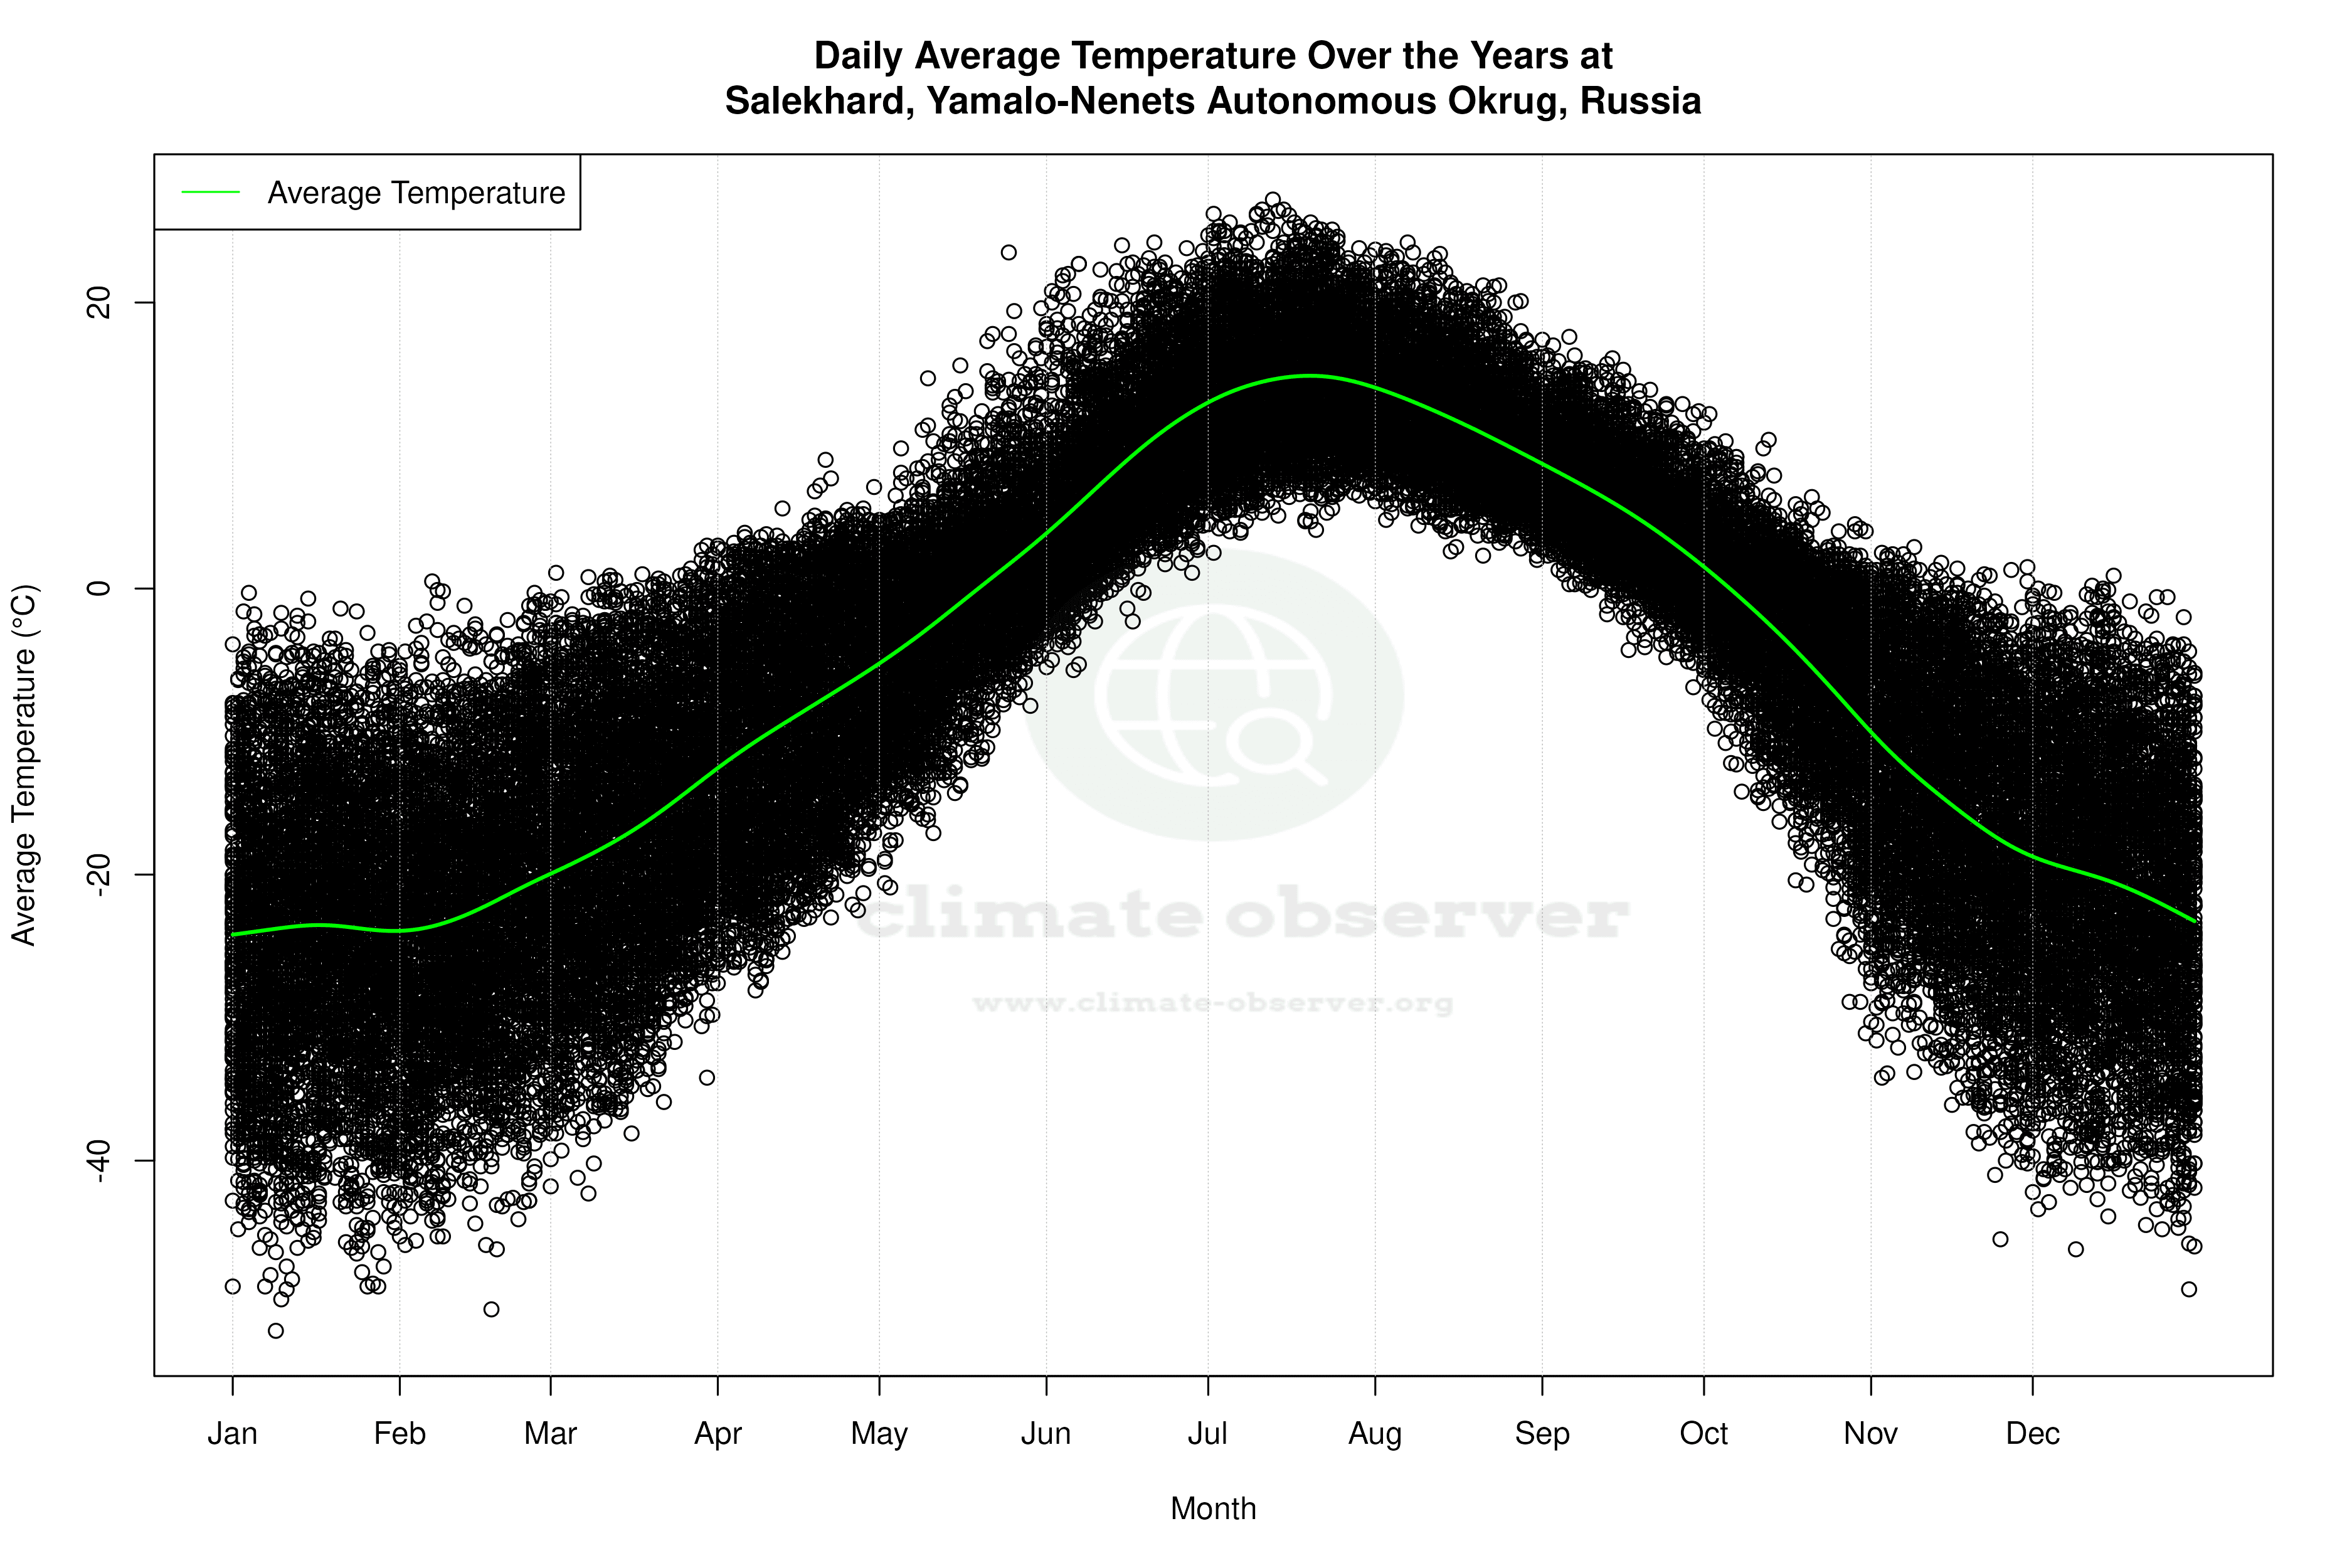


Average Max Temperature Throughout Year | 1 of 5
