Climate for Station: Verhojansk, Sakha (Yakutia) Republic, Russia
Loading live weather...
Climate Analysis & Overview
Verhojansk, situated in the heart of Siberia, presents a complex climate profile marked by a historical warming trend, juxtaposed with recent cooling. The region's precipitation is becoming increasingly concentrated, hinting at more intense weather events.
Siberian Climate Extremes
Verhojansk, located at 67.5667°N, 133.4°E in the Sakha Republic, Russia, is known for its extreme temperatures. Classified under the Köppen climate system as Dfd, it experiences a subarctic climate with very cold winters and mild summers. The area's geography, characterized by its expansive flatlands and proximity to the Arctic Circle, contributes to its wide temperature range. The record high of 37.3°C (99.1°F) and the record low of -69.8°C (-93.6°F) underscore the climatic extremes typical of this region.
Temperature Trends: A Tale of Two Periods
When examining temperature trends, Verhojansk reveals a nuanced picture. Over the past decade, there has been a cooling trend, with highs decreasing by 0.61°C (1.10°F) and lows by 0.84°C (1.51°F). However, the all-time data tells a different story, with a warming trend observed: highs have risen by 0.27°C (0.49°F) and lows by 0.25°C (0.45°F). This divergence suggests that while recent years have seen a cooling, the long-term trajectory remains one of warming, a critical insight for understanding regional climate dynamics.
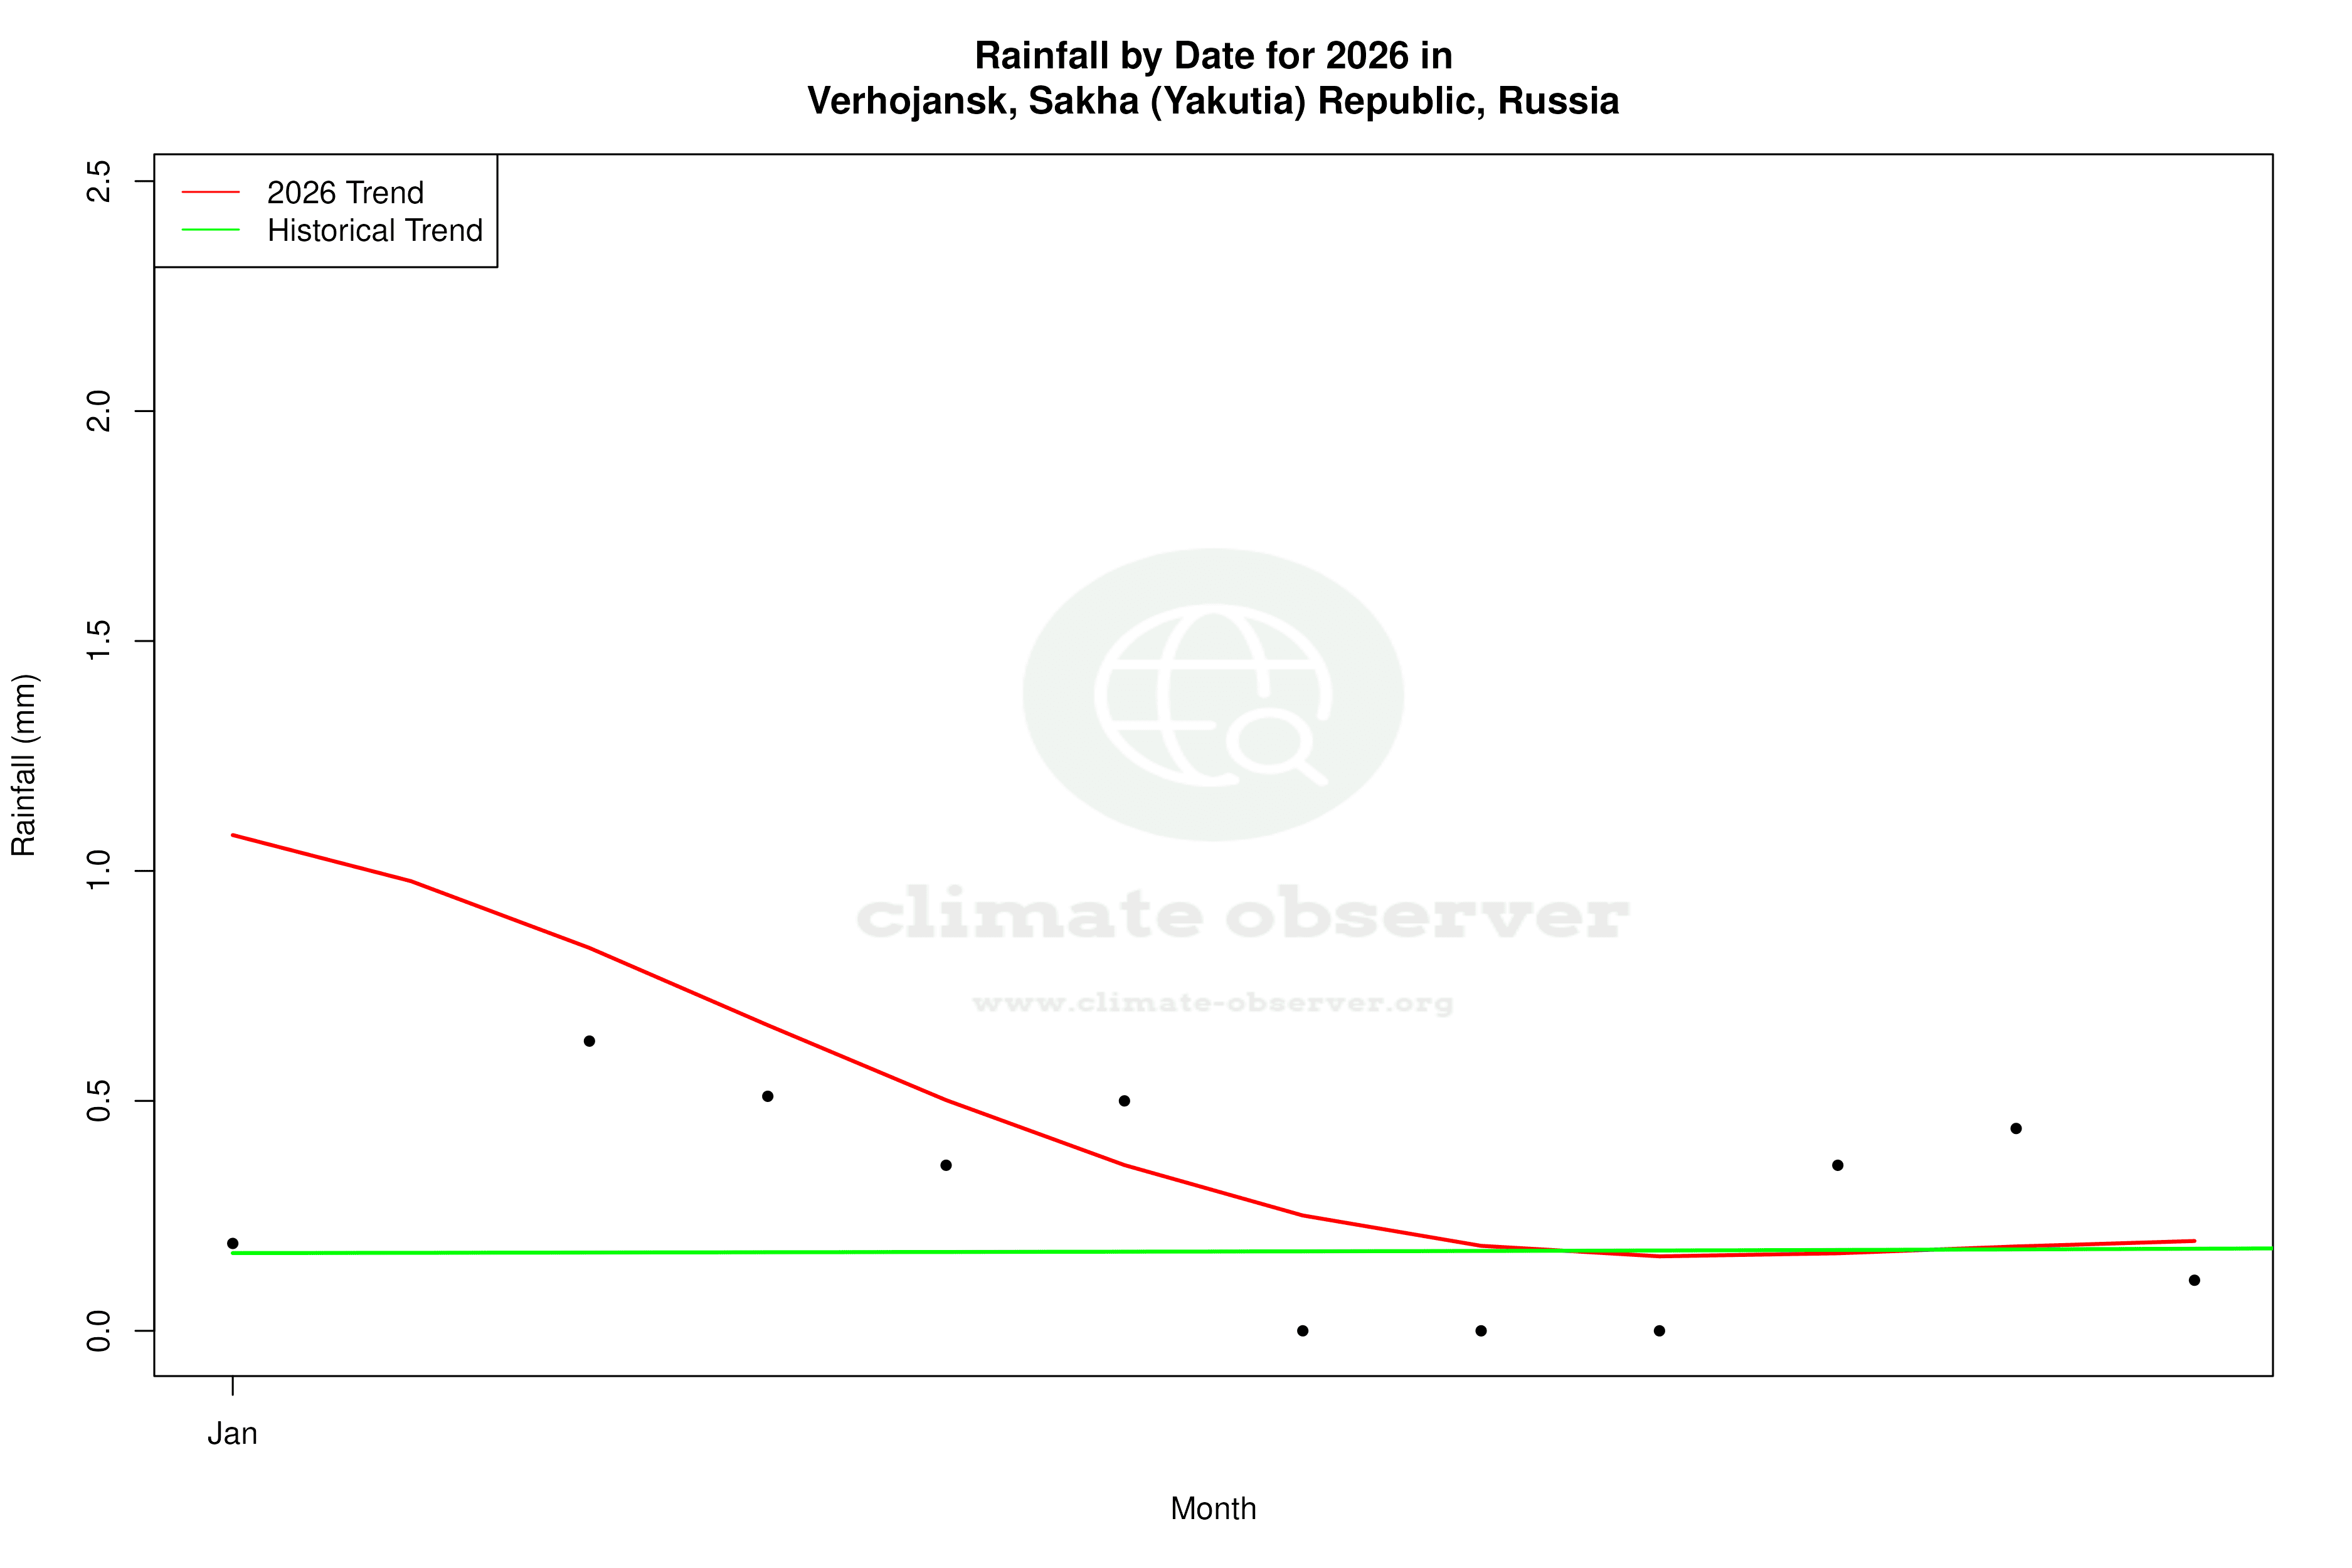
Precipitation Patterns: Intensifying Events
The Precipitation Concentration Index (PCI) for Verhojansk has shown a slight increase from a baseline of 15.6 to a current value of 17.3. This indicates that precipitation is becoming more concentrated in fewer events, potentially leading to more intense rainfall or snowfall periods. Such changes in precipitation patterns could have significant implications for local ecosystems and human activities, necessitating adaptive strategies to manage water resources effectively.
Regional Climate Context
Russia's commitment to addressing climate change is reflected in its national goals to reduce greenhouse gas emissions and enhance resilience to climate impacts. Verhojansk's climate data provides valuable insights into the broader regional trends, illustrating the challenges of balancing short-term cooling with long-term warming. Recent weather events, such as the unprecedented heatwaves in Siberia, highlight the urgency of understanding and mitigating climate impacts in this sensitive region.
Station Statistics
10-Year Trend
High: -1.15 °C/decade
Low: -1.19 °C/decade
Rain: -0.15 mm/decade
25-Year Trend
High: +1.13 °C/decade
Low: +0.86 °C/decade
Rain: +0.00 mm/decade
50-Year Trend
High: +0.49 °C/decade
Low: +0.53 °C/decade
Rain: +0.01 mm/decade
All-Time Trend
High: +0.25 °C/decade
Low: +0.24 °C/decade
Rain: +0.01 mm/decade
Percentage Above-Average Days
Last 12 Months: 55.9%
This Year: 30.0%
Precipitation Concentration Index (PCI) ℹ️
Last 12 Months: 18.1
Historical Average: 17.2
Percentile Rank of Last 12 Months ℹ️
High: 56th percentile
Low: 63rd percentile
Rain: 42nd percentile
Change in Variance ℹ️
High: -10.1%
Low: -5.0%
Intraday: -1.4%
Data Coverage
87.0%
First Year of Data
1885
Station Location
Historical Weather Records
| Max High | Avg High | Min High | Max Avg | Avg Avg | Min Avg | Max Low | Avg Low | Min Low | Max Precipitation | Avg Precipitation | Max Snow | Avg Snow | |
|---|---|---|---|---|---|---|---|---|---|---|---|---|---|
| Record | 37.3 °C | — | -63.4 °C | 28.9 °C | — | -66.1 °C | 24.4 °C | — | -69.8 °C | 44.0 mm | — | — | — |
| January | -9.5 °C | -44.1 °C | -63.4 °C | -15.1 °C | -47.1 °C | -65.9 °C | -24.5 °C | -50.1 °C | -67.8 °C | 12.6 mm | 0.2 mm | — | — |
| February | -0.3 °C | -38.6 °C | -61.0 °C | -11.4 °C | -43.0 °C | -66.1 °C | -17.6 °C | -47.6 °C | -69.8 °C | 9.0 mm | 0.2 mm | — | — |
| March | 4.5 °C | -20.2 °C | -49.5 °C | -0.2 °C | -29.8 °C | -54.6 °C | -3.2 °C | -38.7 °C | -60.3 °C | 3.0 mm | 0.1 mm | — | — |
| April | 14.3 °C | -3.3 °C | -26.5 °C | 8.9 °C | -12.2 °C | -42.6 °C | 5.4 °C | -22.6 °C | -57.2 °C | 15.5 mm | 0.2 mm | — | — |
| May | 28.1 °C | 9.3 °C | -11.0 °C | 20.4 °C | 3.2 °C | -17.8 °C | 12.5 °C | -3.9 °C | -34.2 °C | 28.1 mm | 0.3 mm | — | — |
| June | 34.8 °C | 19.8 °C | 1.0 °C | 28.3 °C | 13.5 °C | -3.0 °C | 21.4 °C | 6.4 °C | -7.9 °C | 29.7 mm | 0.9 mm | — | — |
| July | 37.3 °C | 22.5 °C | 5.0 °C | 28.9 °C | 15.9 °C | 3.2 °C | 24.4 °C | 8.8 °C | -3.2 °C | 33.4 mm | 1.0 mm | — | — |
| August | 33.7 °C | 18.7 °C | 0.9 °C | 25.1 °C | 11.5 °C | -1.0 °C | 19.1 °C | 4.7 °C | -9.9 °C | 33.2 mm | 0.9 mm | — | — |
| September | 25.1 °C | 8.5 °C | -5.5 °C | 17.3 °C | 2.5 °C | -12.6 °C | 14.1 °C | -2.6 °C | -21.7 °C | 44.0 mm | 0.6 mm | — | — |
| October | 14.5 °C | -9.1 °C | -36.8 °C | 8.5 °C | -14.2 °C | -40.8 °C | 6.0 °C | -19.1 °C | -48.7 °C | 19.6 mm | 0.4 mm | — | — |
| November | 1.1 °C | -32.3 °C | -55.6 °C | -3.8 °C | -35.5 °C | -56.5 °C | -6.4 °C | -39.3 °C | -57.2 °C | 9.5 mm | 0.3 mm | — | — |
| December | -5.3 °C | -41.4 °C | -62.6 °C | -11.1 °C | -44.4 °C | -63.8 °C | -16.5 °C | -47.4 °C | -64.5 °C | 5.2 mm | 0.2 mm | — | — |
Data Visualisations
Remove WatermarksCurrent Year Climate Trends vs Historical


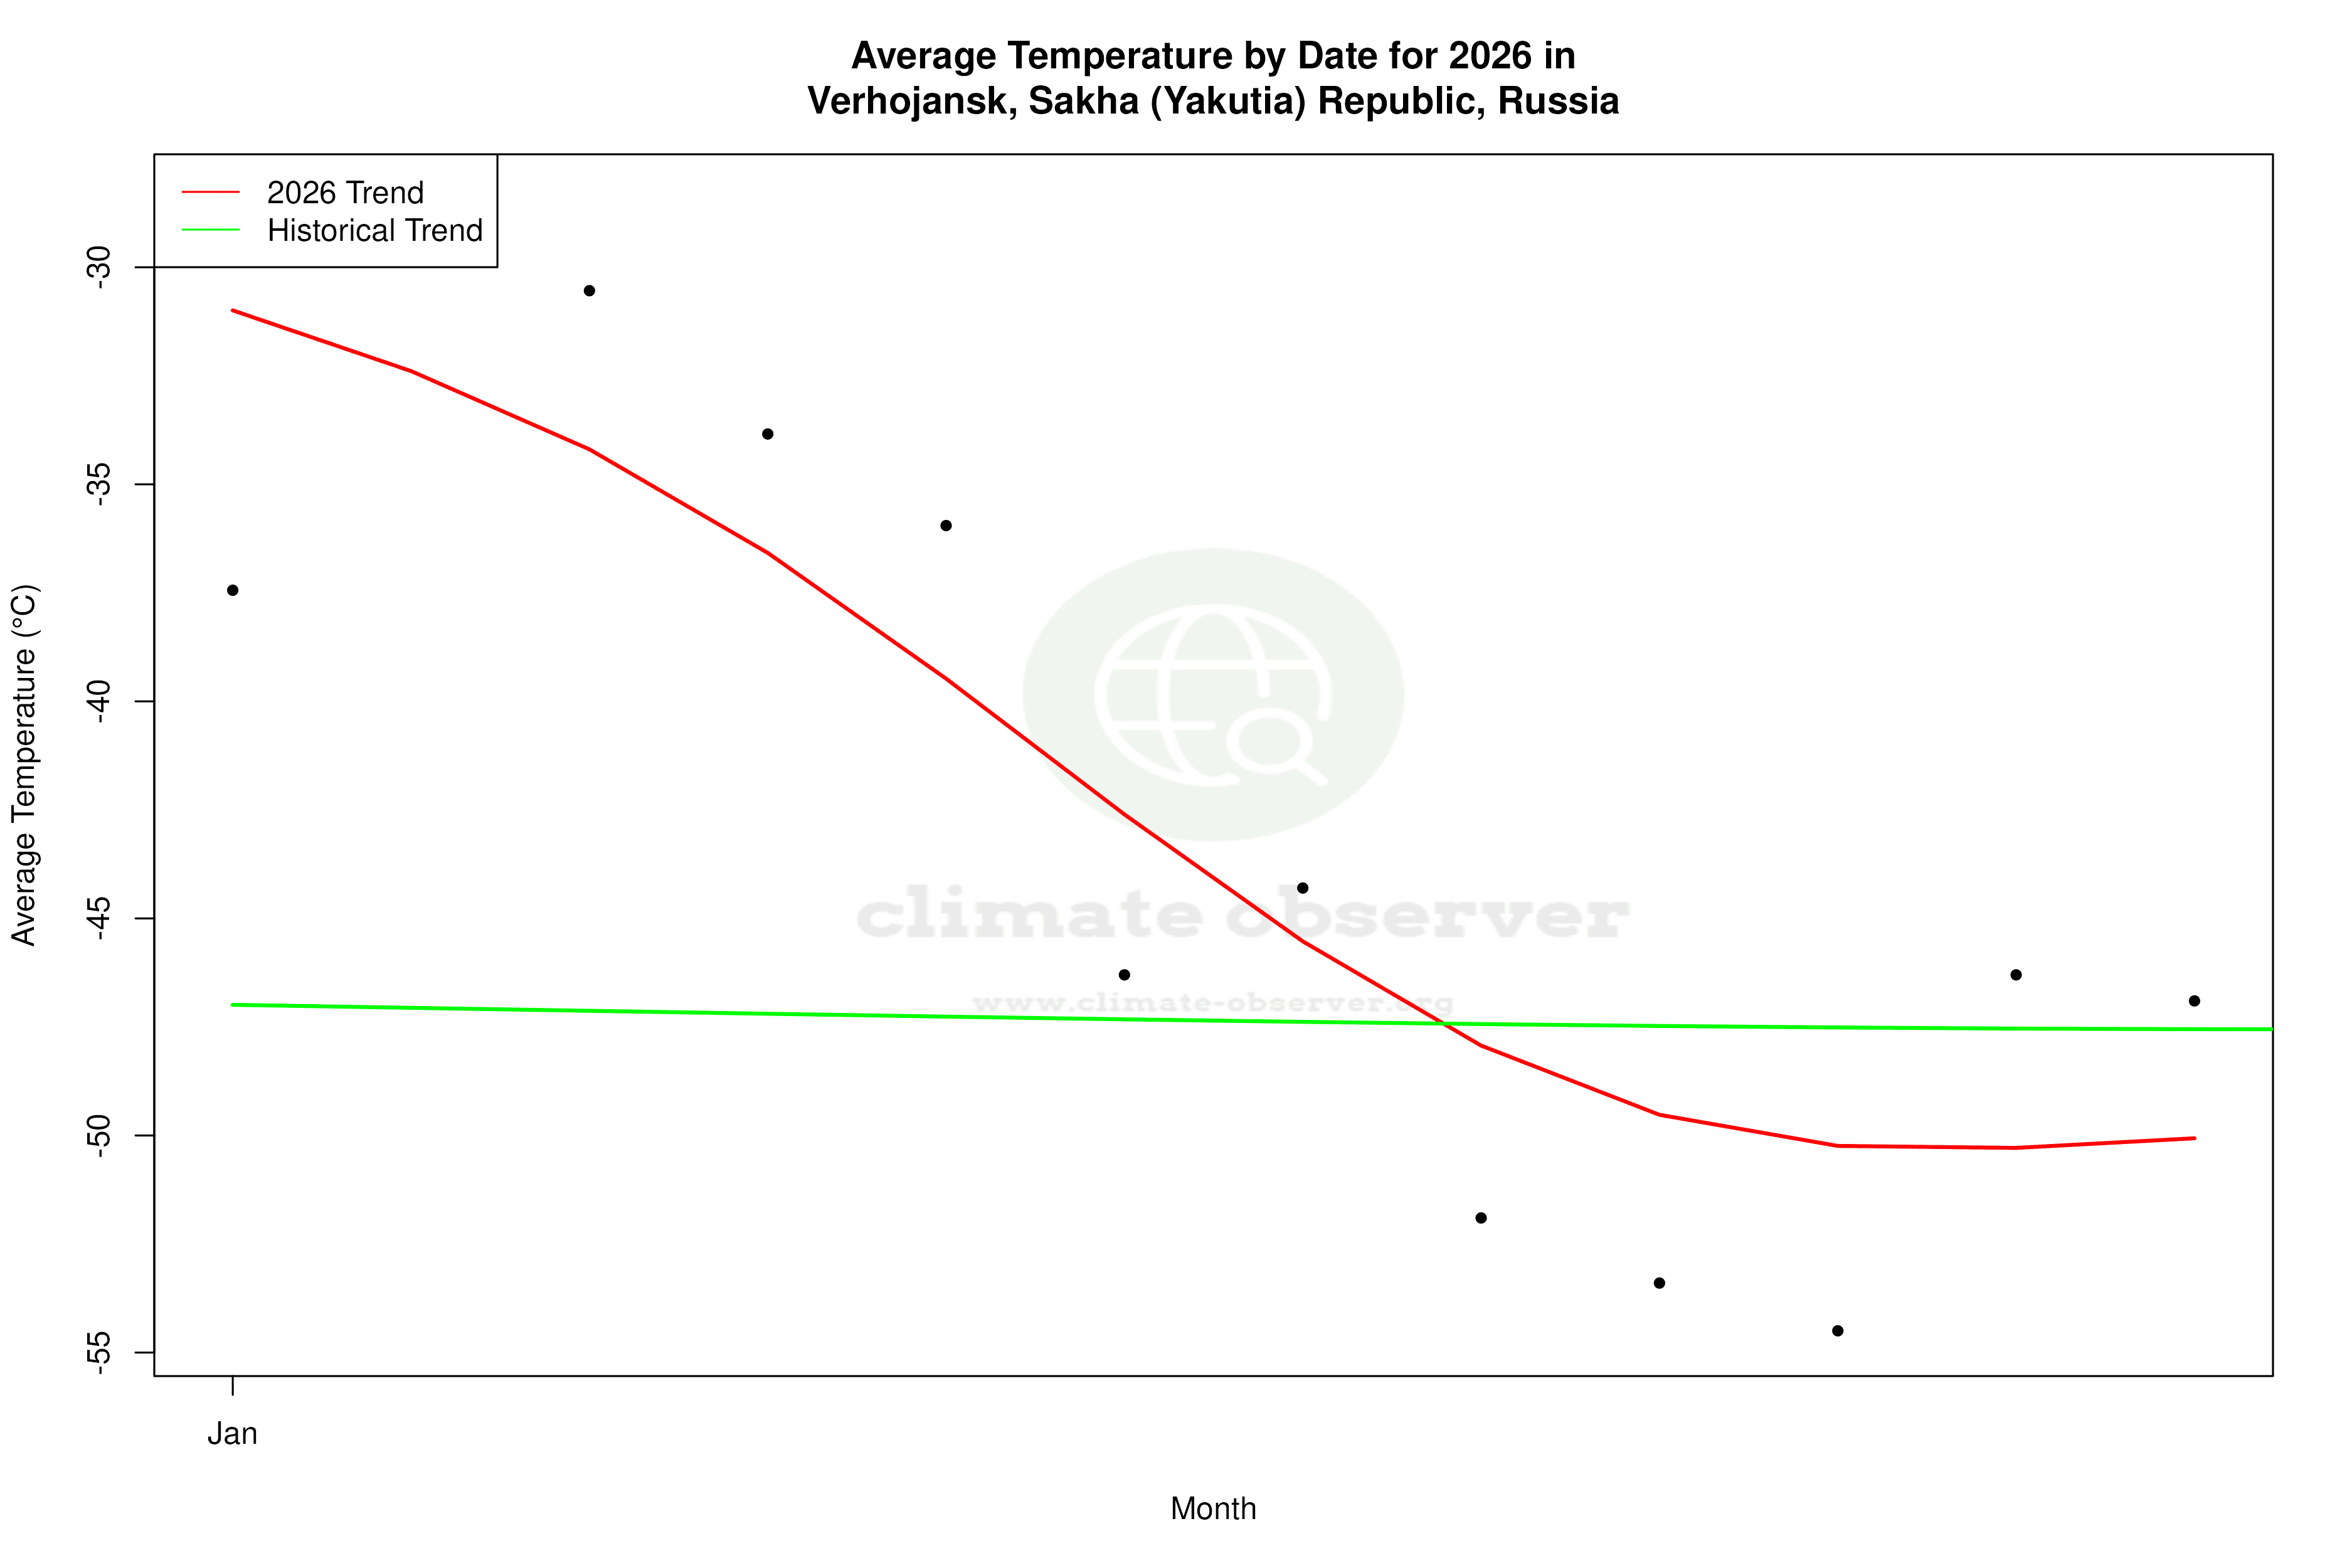


Max Temperature this Year | 1 of 6
Climate 12-Month Moving Averages


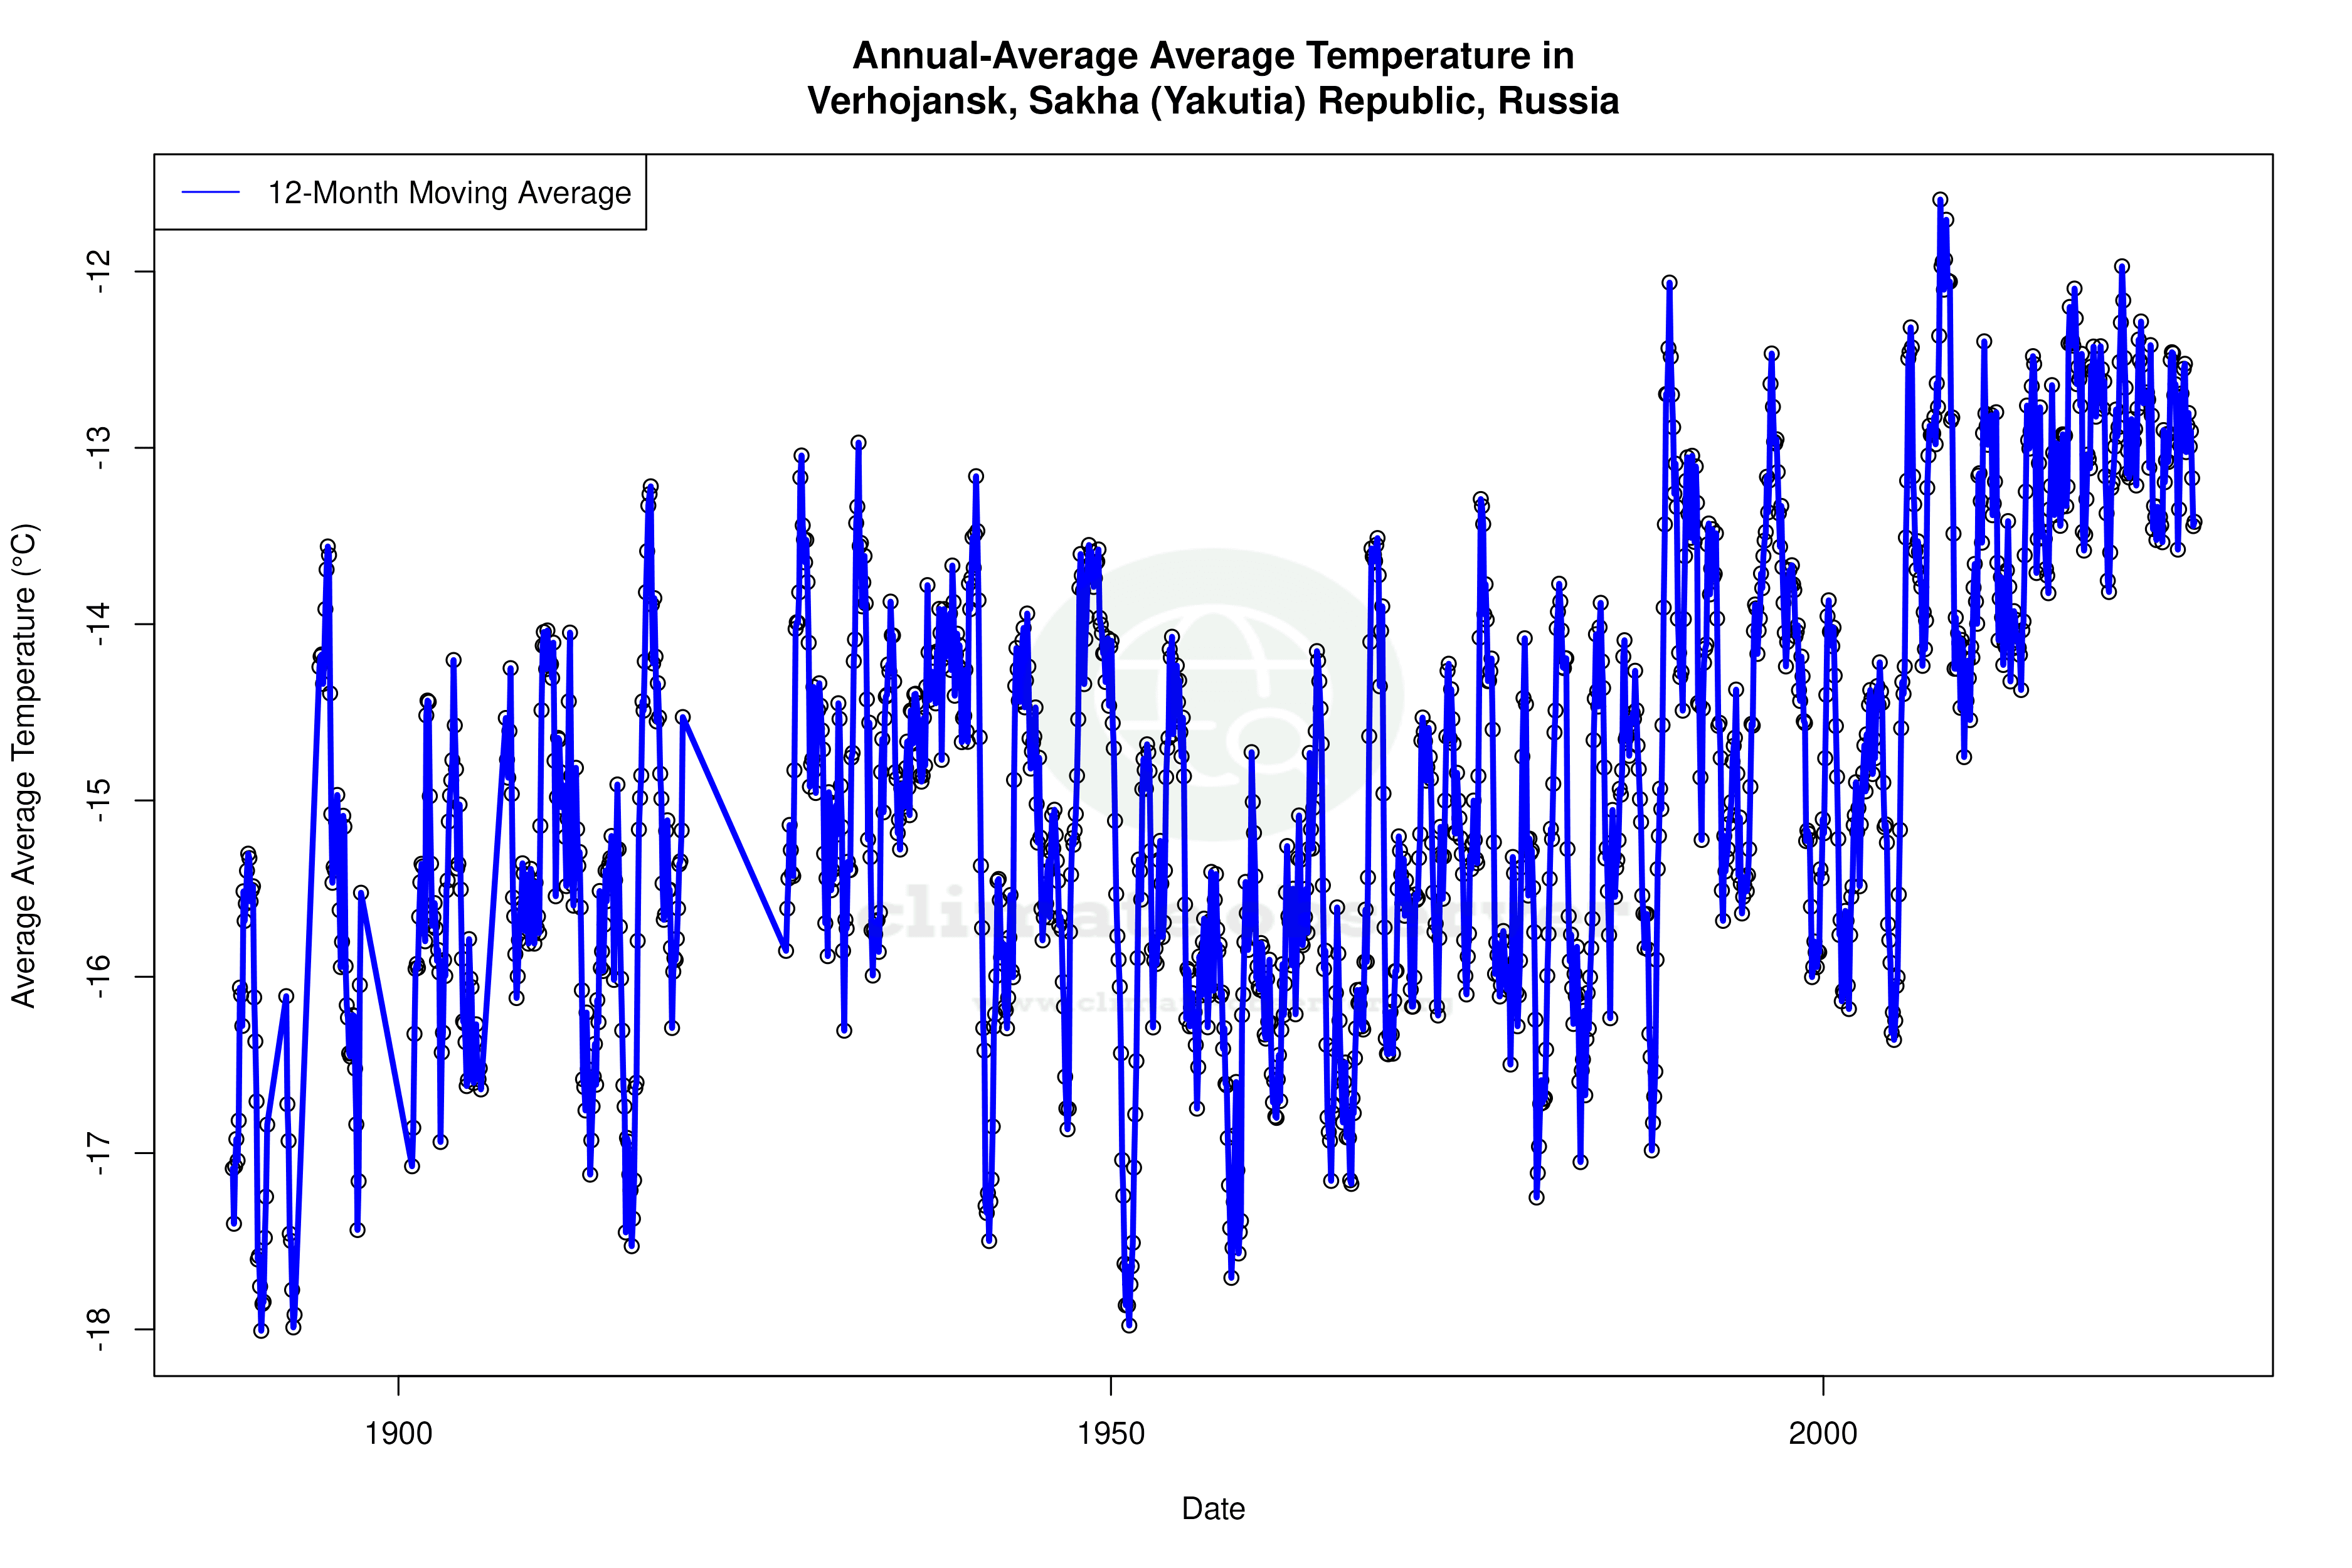


Max Temperature 12-Month MA | 1 of 6
Daily Data Points and Averages Throughout the Year

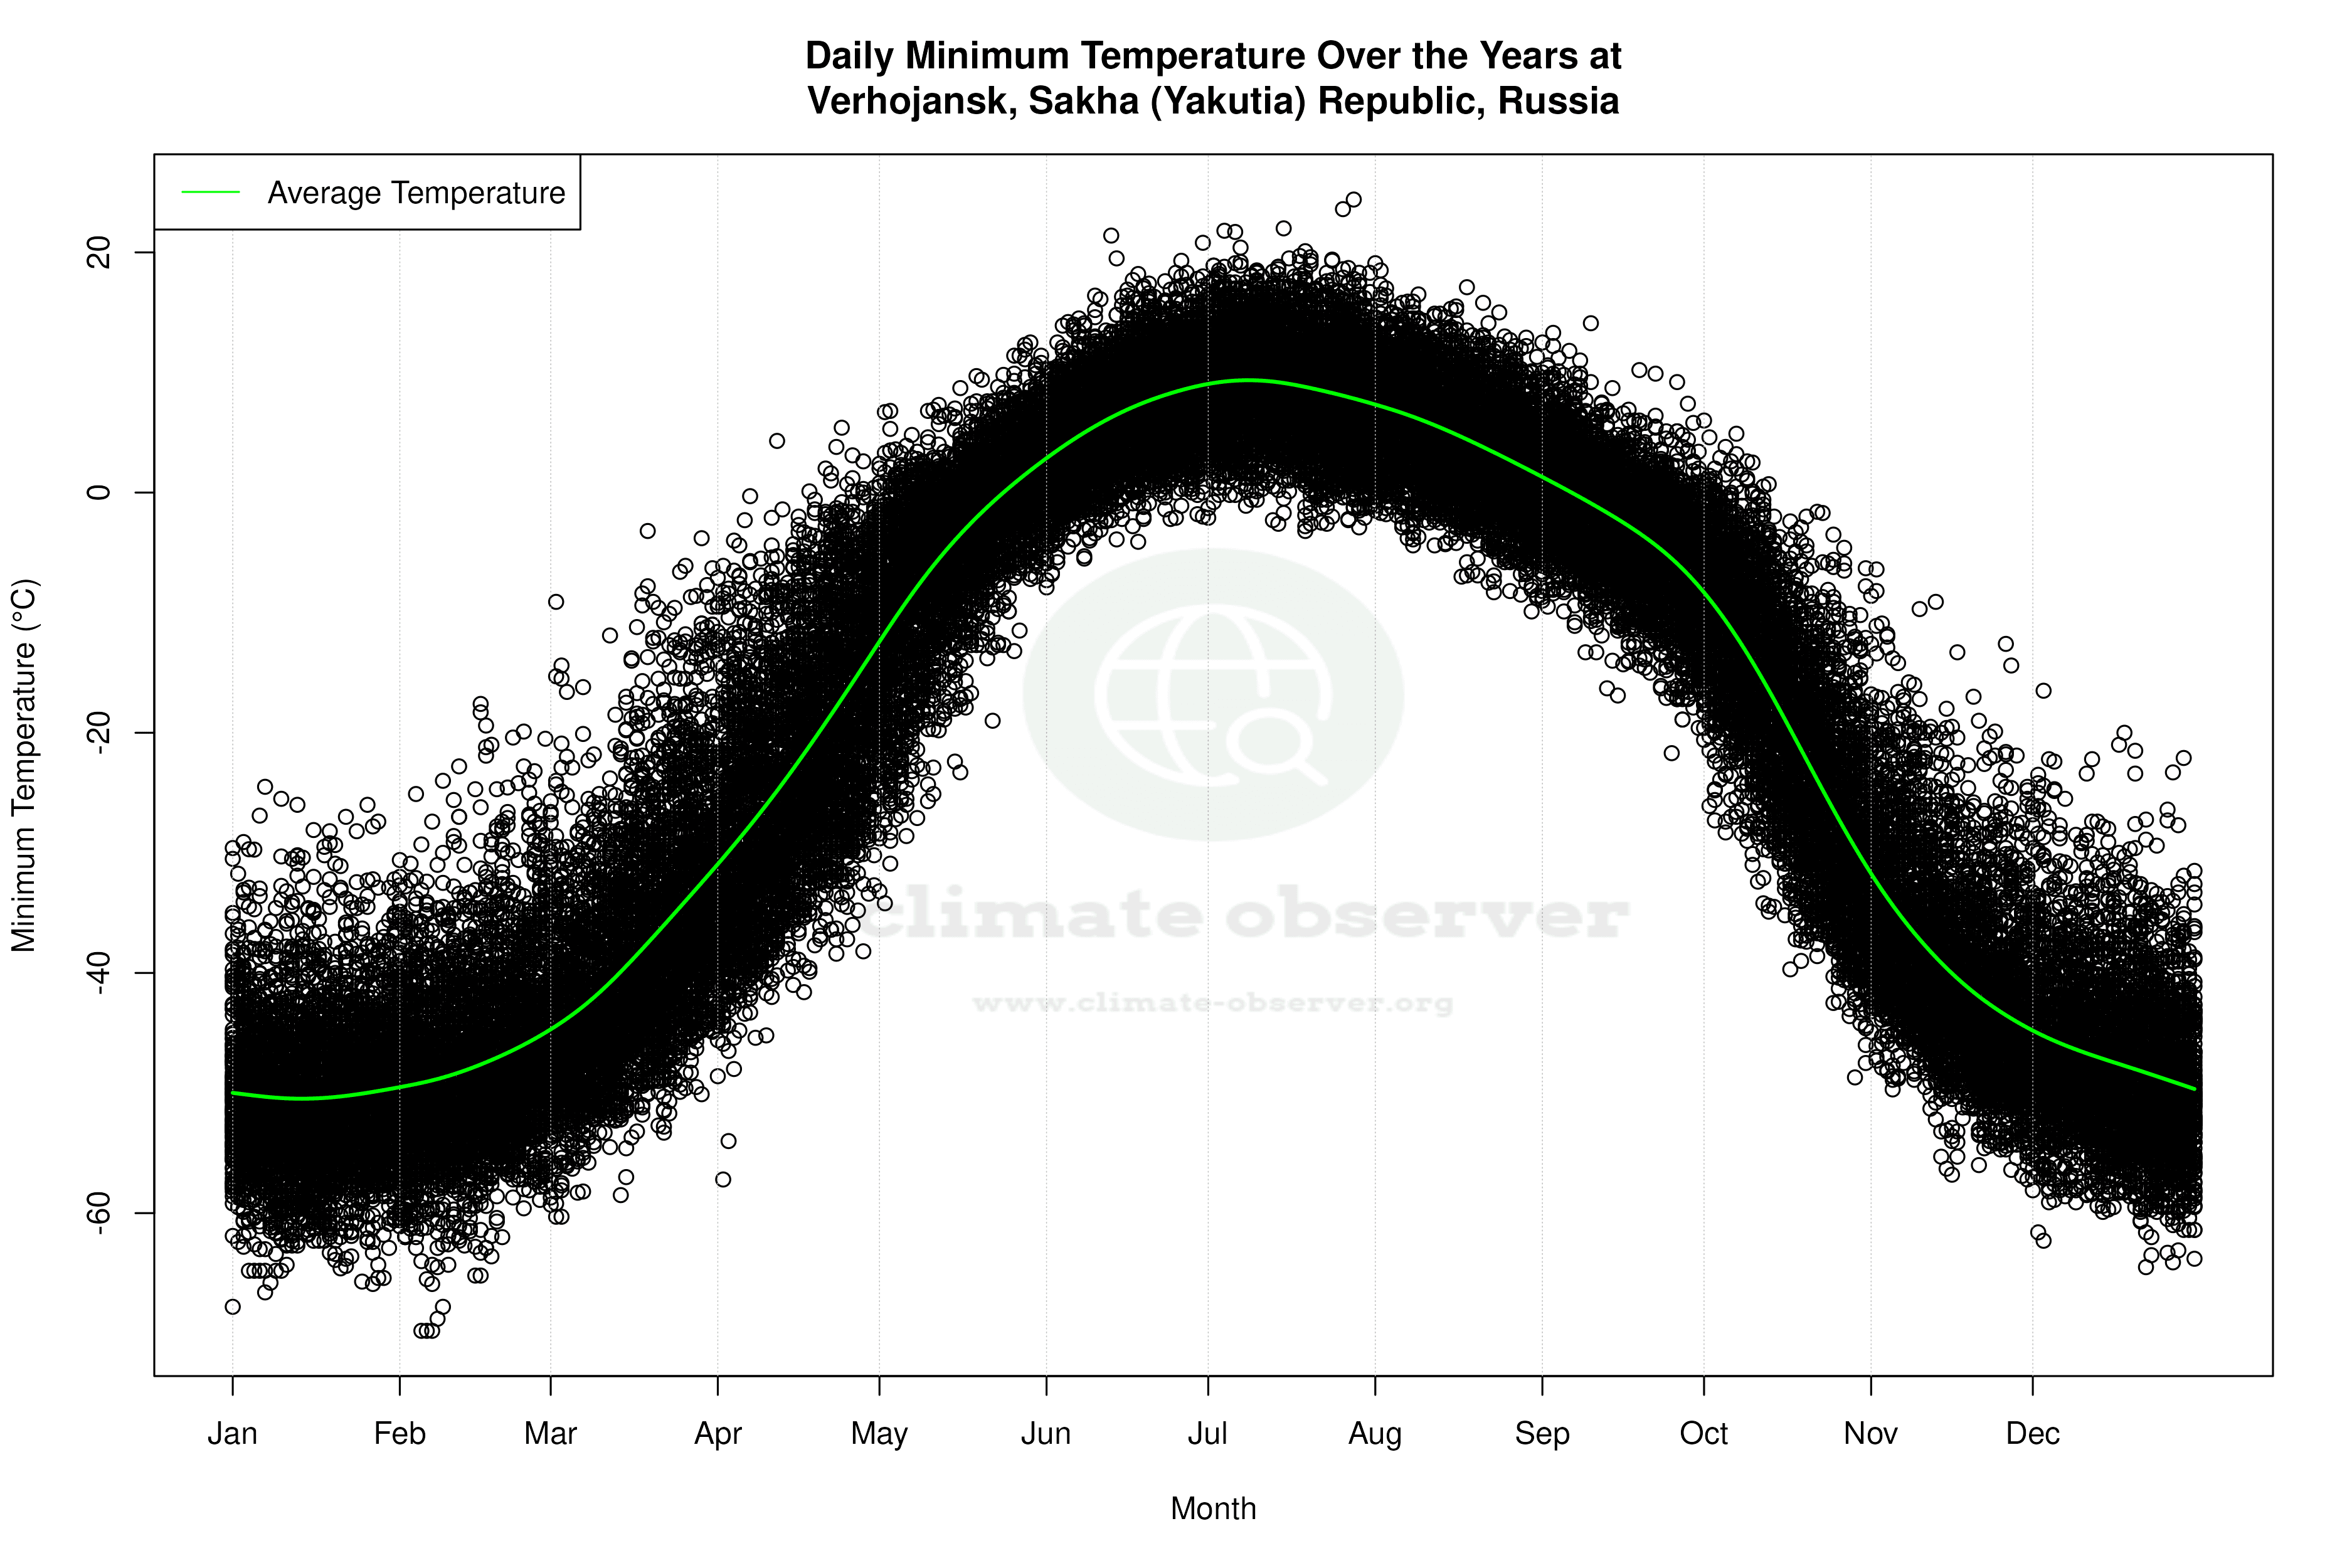
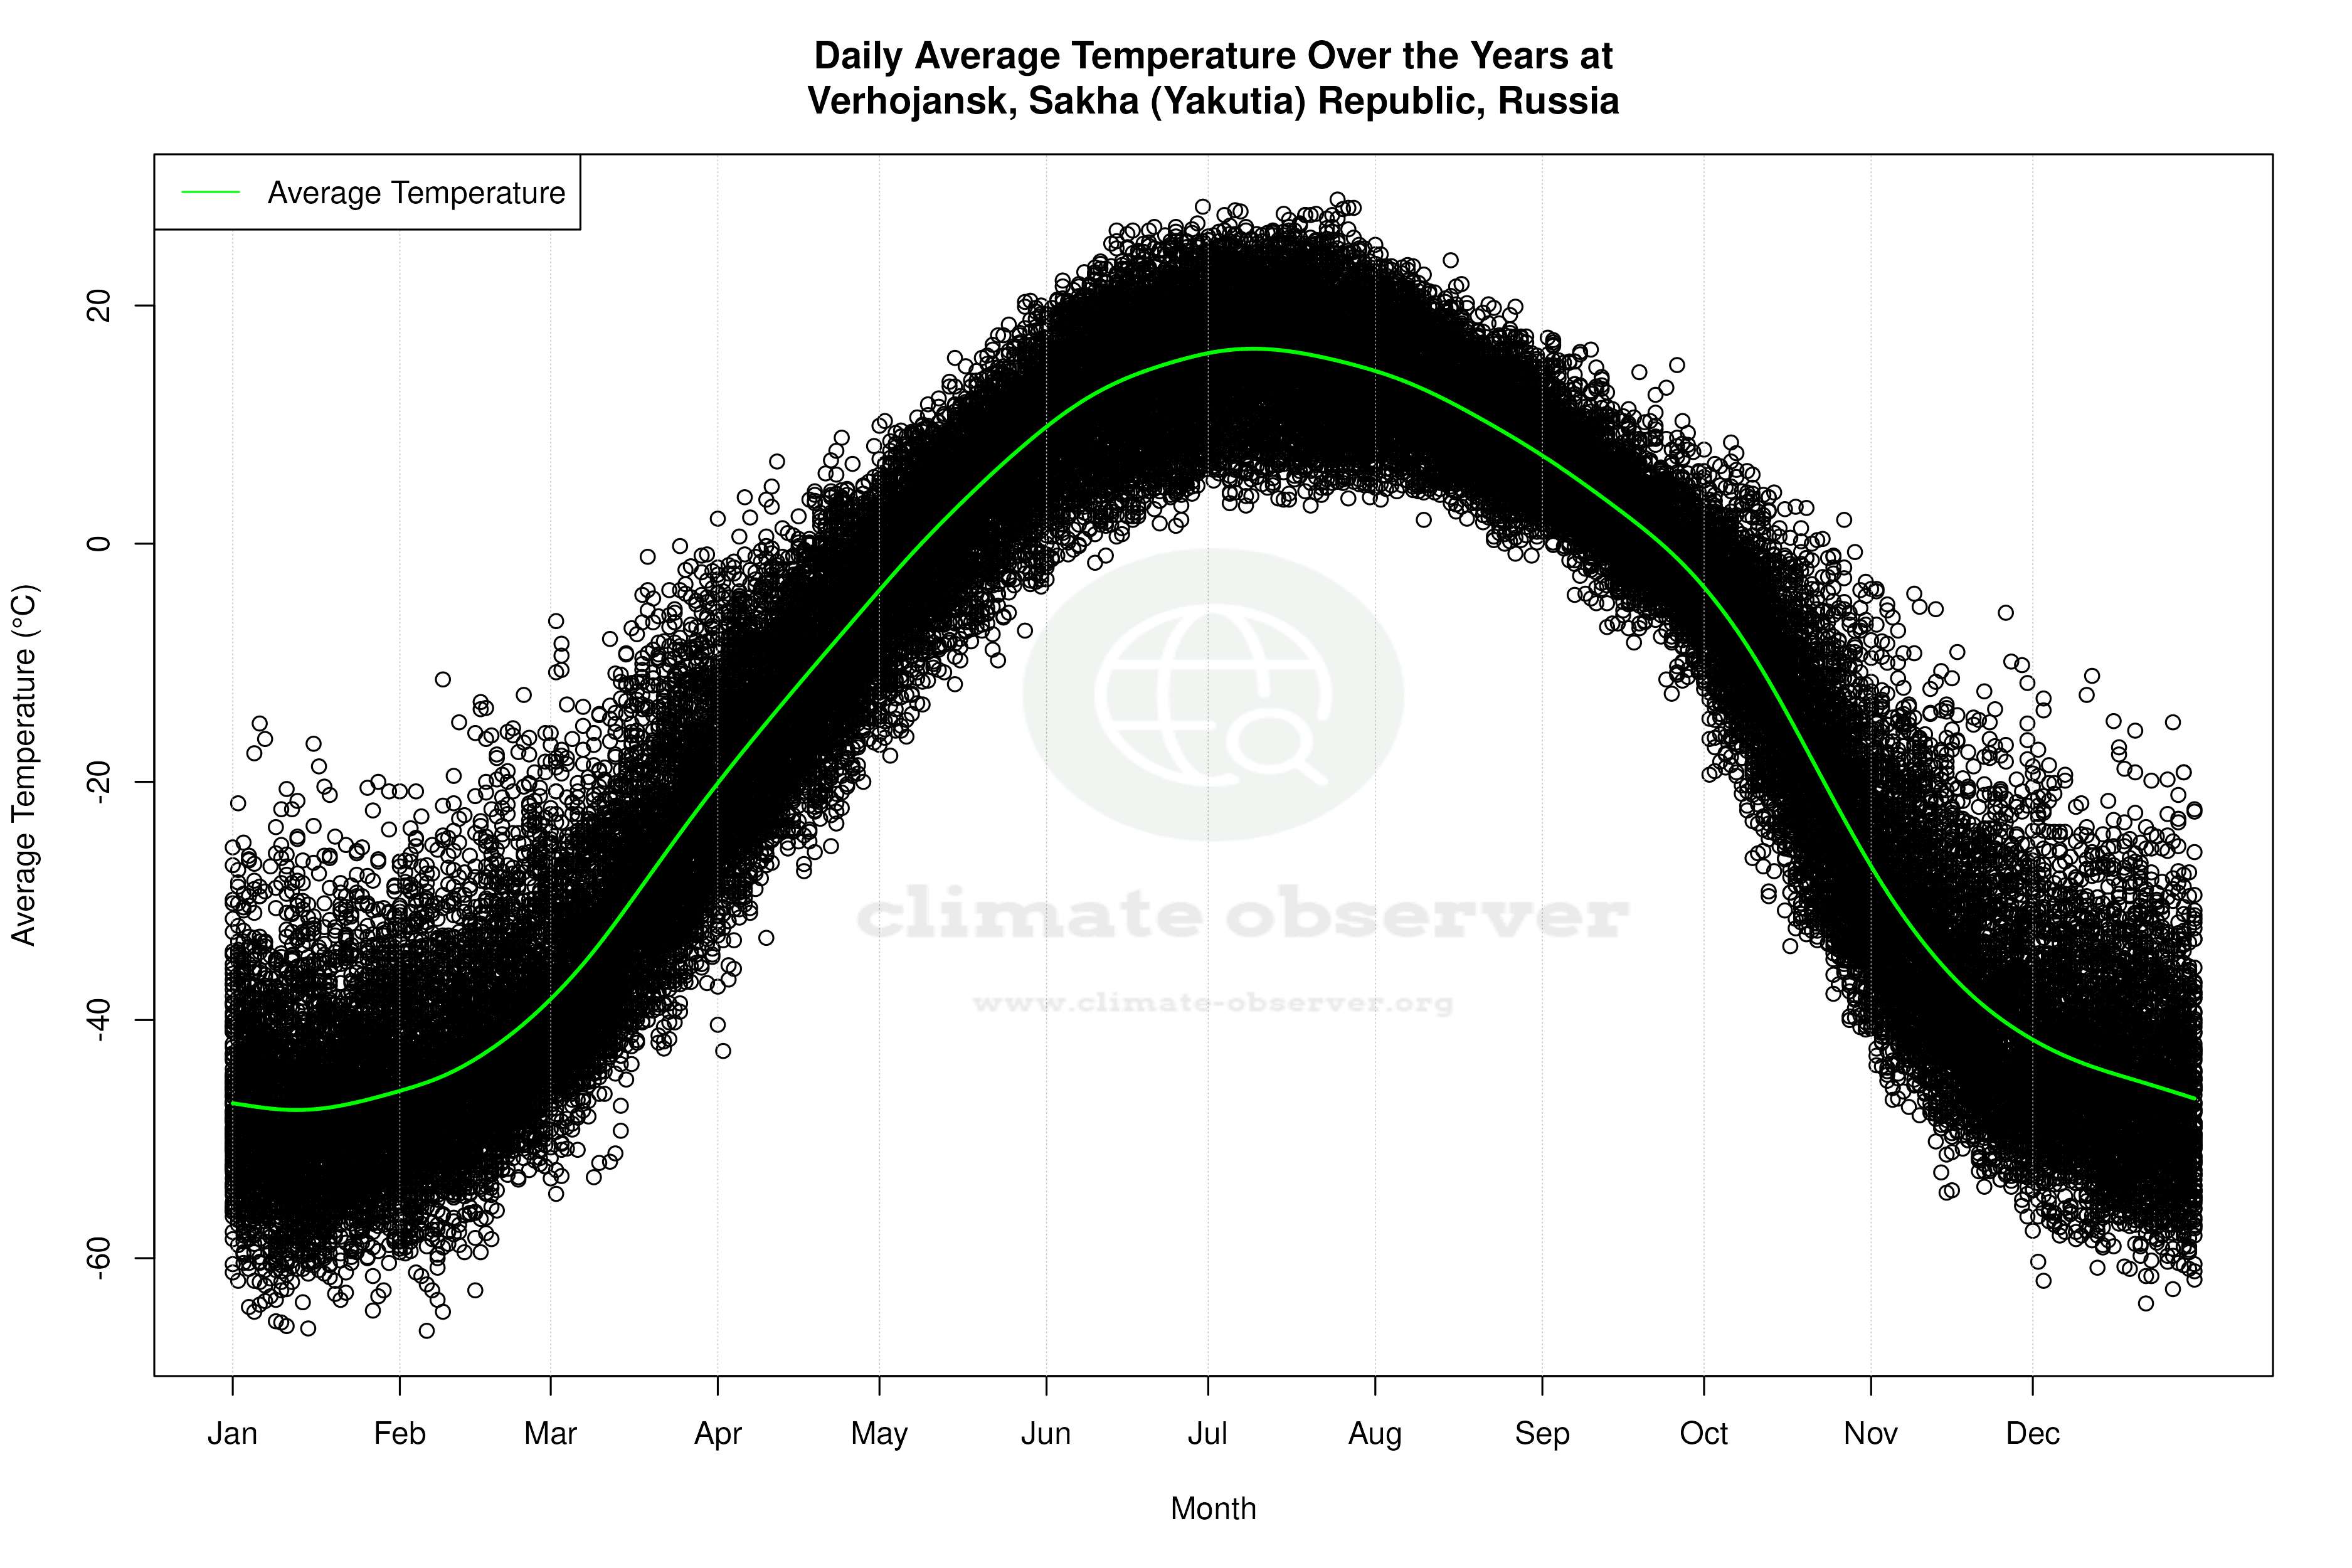


Average Max Temperature Throughout Year | 1 of 5
