Climate for Station: Jakutsk, Sakha (Yakutia) Republic, Russia
Loading live weather...
Climate Analysis & Overview
Yakutsk, a city renowned for its extreme temperatures, is experiencing a nuanced climatic shift. While long-term data suggests a slight warming trend, recent years have seen a cooling in both highs and lows. Precipitation is becoming more evenly distributed, possibly altering the region's typical weather patterns.
The Siberian Climate Paradox
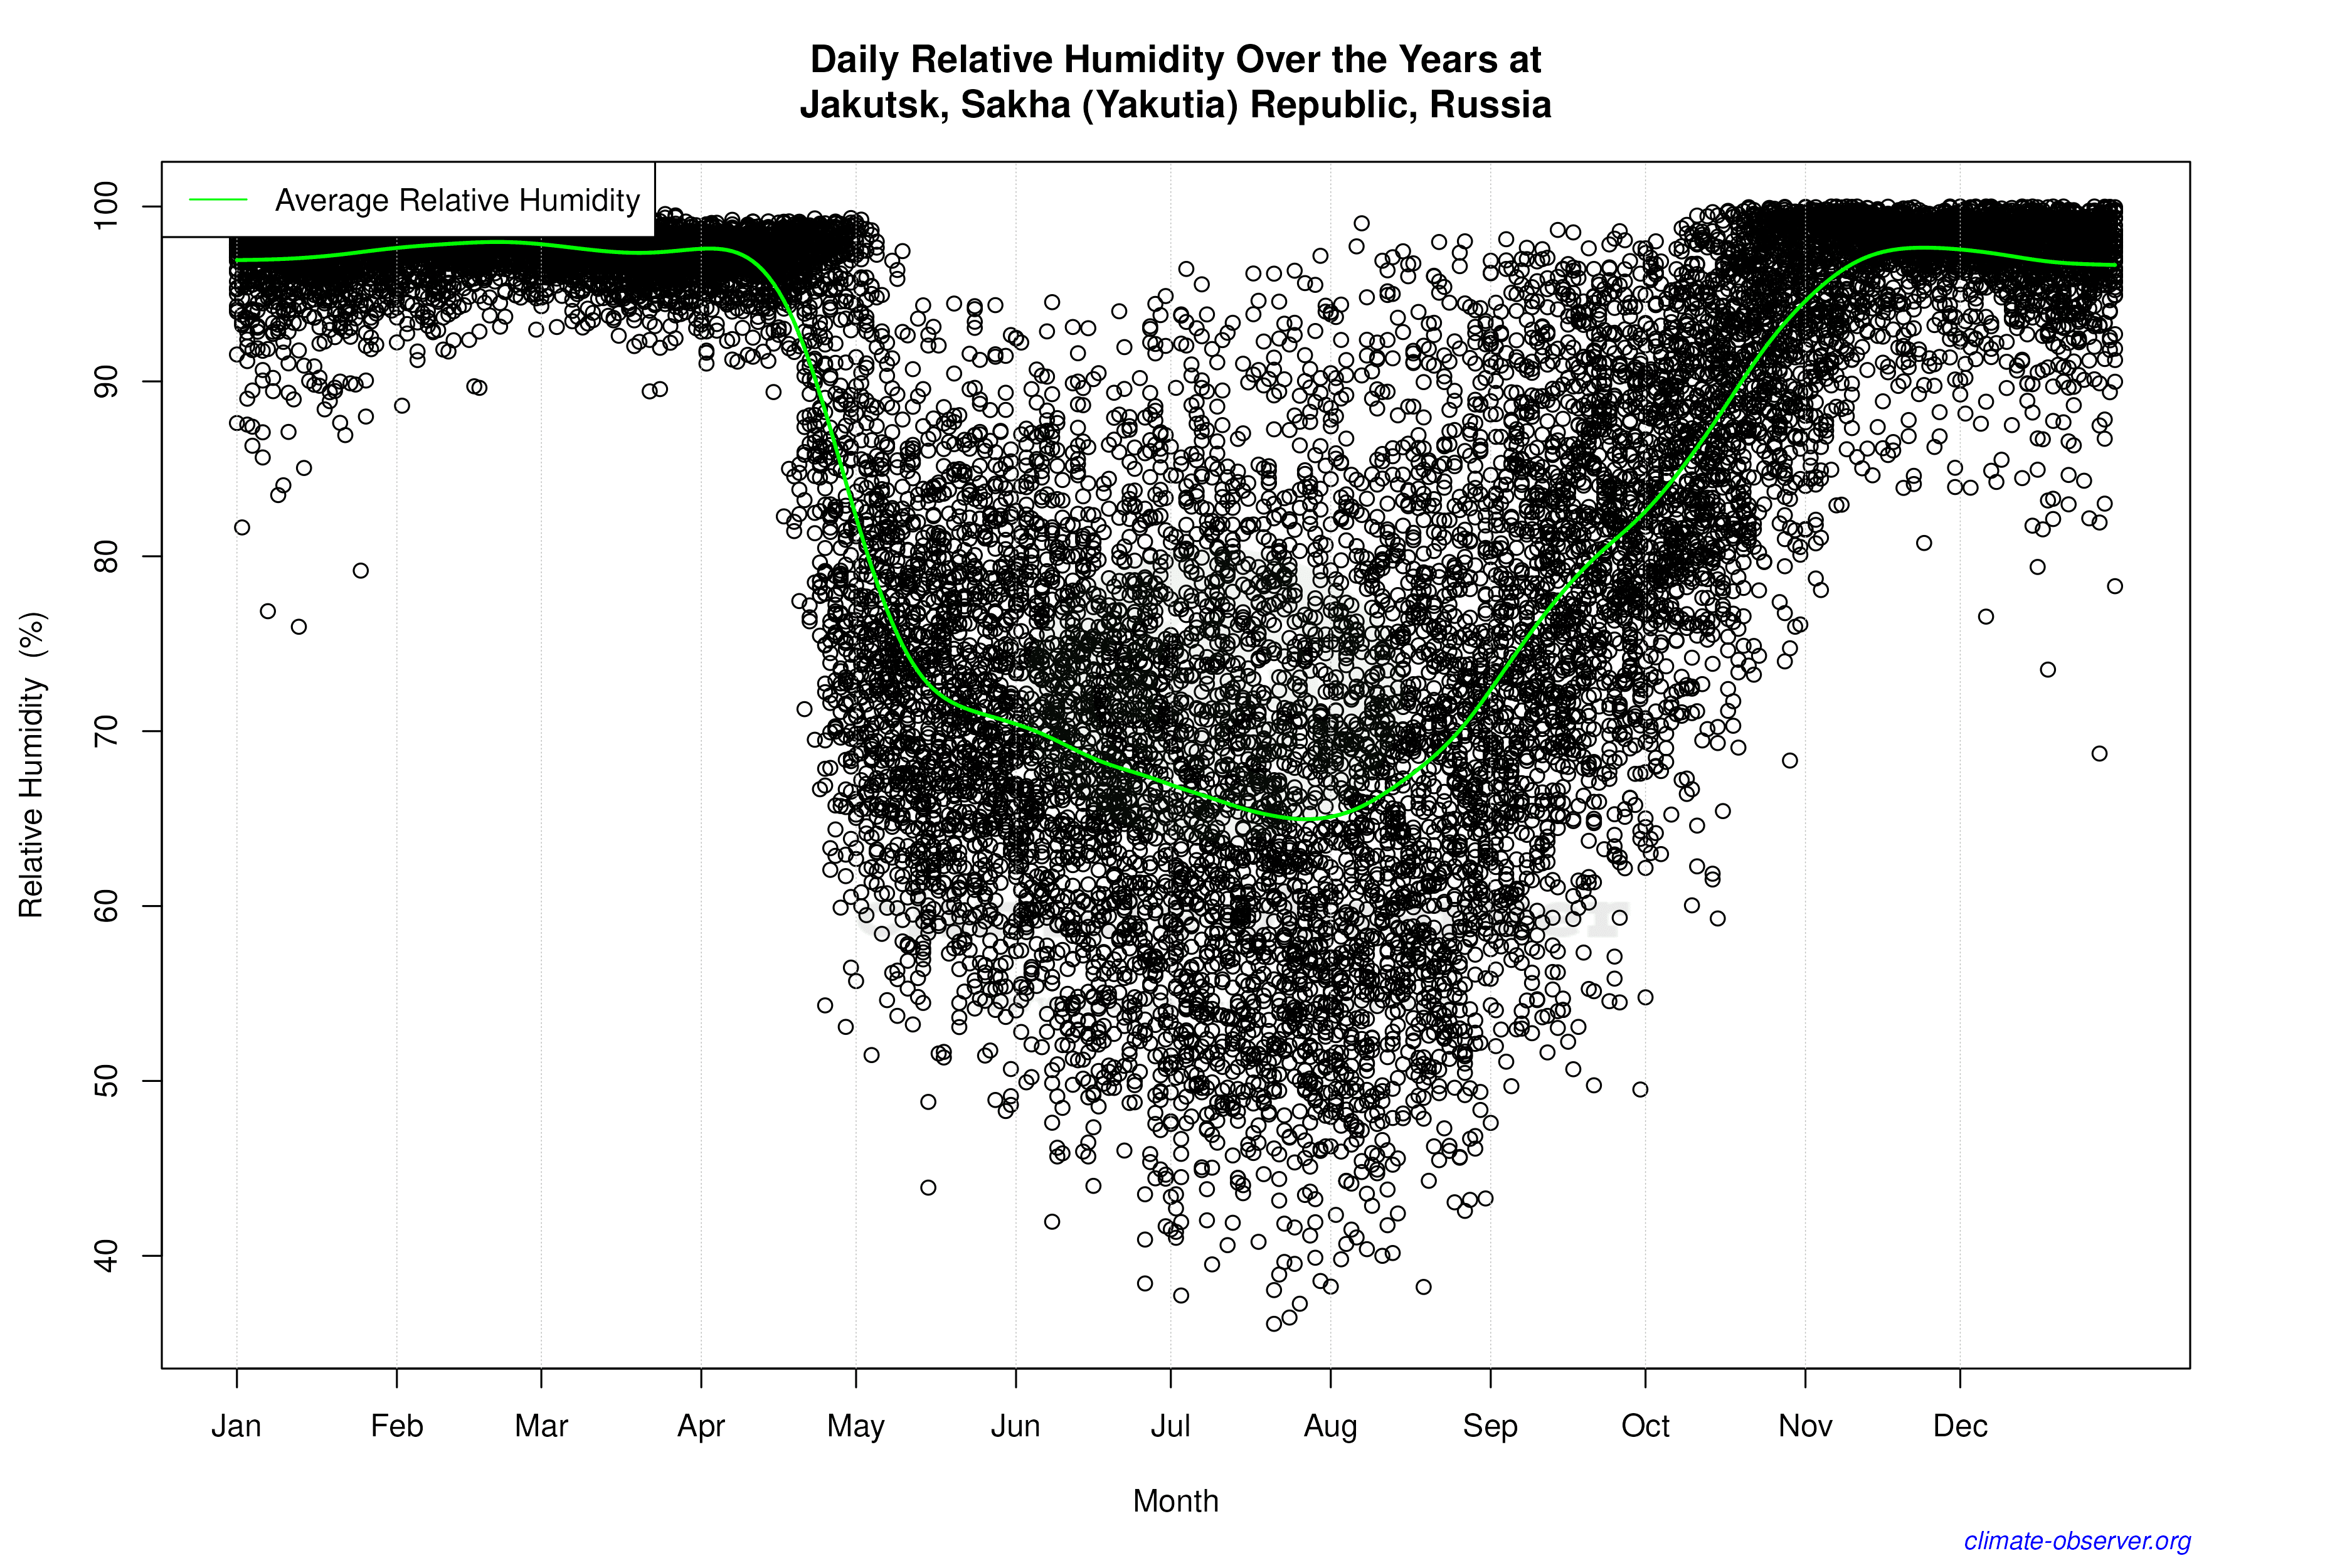
Yakutsk, situated in the heart of Siberia, experiences a subarctic climate, classified under the Köppen system as Dfc. This classification is marked by long, frigid winters and short, mild summers. The city is located near the Lena River, which influences local weather patterns by moderating temperatures slightly and contributing to regional humidity levels. Despite the harsh climate, recent data reveals a paradoxical trend. Over the past decade, there has been a cooling in both high and low temperatures, with highs dropping by 0.46°C (0.83°F) and lows by 0.53°C (0.95°F). This contrasts with the all-time data, which shows a warming trend of 0.26°C (0.47°F) for both highs and lows, indicating a complex interplay of climatic factors.
Extreme Temperature Records
Yakutsk holds the record for some of the most extreme temperatures on Earth. The highest recorded temperature is a scorching 38.4°C (101.1°F), while the lowest plummets to a bone-chilling -64.4°C (-83.9°F). These records highlight the city's vast thermal range, a testament to its subarctic location. Such extremes are not just numbers; they shape the daily lives and infrastructure of the region, demanding adaptations in building design and energy consumption.
Precipitation Patterns: A Shift Towards Evenness
The Precipitation Concentration Index (PCI) for Yakutsk has decreased from a baseline of 14.3 to a current value of 12.1. This suggests that precipitation is now more evenly distributed throughout the year, as opposed to being concentrated in fewer, more intense events. This shift could have significant implications for agriculture and water management in the region, potentially reducing the risk of droughts and floods, which are more common with concentrated precipitation patterns.
Interpreting the Trends
The juxtaposition of cooling trends over the past decade with the long-term warming trend presents a nuanced picture of Yakutsk's climate. While the recent cooling might suggest a temporary deviation, the overall warming trend aligns with global climate patterns observed in Russia and beyond. This complexity underscores the importance of continuous monitoring and analysis, especially in regions with such extreme climates. As Russia aims to meet its climate goals, understanding these localised trends becomes crucial for effective policy-making and adaptation strategies.
Station Statistics
10-Year Trend
High: -0.51 °C/decade
Low: -0.36 °C/decade
Rain: +0.09 mm/decade
25-Year Trend
High: +1.02 °C/decade
Low: +0.85 °C/decade
Rain: +0.02 mm/decade
50-Year Trend
High: +0.58 °C/decade
Low: +0.88 °C/decade
Rain: +0.01 mm/decade
All-Time Trend
High: +0.19 °C/decade
Low: +0.22 °C/decade
Rain: +0.01 mm/decade
Percentage Above-Average Days
Last 12 Months: 54.8%
This Year: 36.3%
Precipitation Concentration Index (PCI) ℹ️
Last 12 Months: 11.4
Historical Average: 14.3
Percentile Rank of Last 12 Months ℹ️
High: 84th percentile
Low: 90th percentile
Rain: 92nd percentile
Change in Variance ℹ️
High: -9.7%
Low: -12.5%
Intraday: -1.7%
Data Coverage
92.5%
First Year of Data
1917
Station Location
Historical Weather Records
| Max High | Avg High | Min High | Max Avg | Avg Avg | Min Avg | Max Low | Avg Low | Min Low | Max Precipitation | Avg Precipitation | Max Snow | Avg Snow | |
|---|---|---|---|---|---|---|---|---|---|---|---|---|---|
| Record | 38.4 °C | — | -58.7 °C | 30.3 °C | — | -61.5 °C | 23.7 °C | — | -64.4 °C | 48.5 mm | — | — | — |
| January | -5.8 °C | -38.2 °C | -57.5 °C | -10.5 °C | -40.9 °C | -61.5 °C | -16.0 °C | -44.6 °C | -63.0 °C | 7.0 mm | 0.2 mm | — | — |
| February | -2.2 °C | -30.4 °C | -58.7 °C | -8.7 °C | -35.1 °C | -60.1 °C | -13.2 °C | -40.2 °C | -64.4 °C | 10.0 mm | 0.2 mm | — | — |
| March | 8.3 °C | -13.2 °C | -38.3 °C | 3.8 °C | -21.4 °C | -46.5 °C | -1.6 °C | -28.8 °C | -54.9 °C | 6.6 mm | 0.2 mm | — | — |
| April | 21.1 °C | 0.8 °C | -20.1 °C | 11.5 °C | -6.1 °C | -29.1 °C | 5.4 °C | -13.3 °C | -41.0 °C | 17.0 mm | 0.3 mm | — | — |
| May | 31.1 °C | 12.6 °C | -6.9 °C | 25.0 °C | 6.8 °C | -11.2 °C | 18.5 °C | 0.1 °C | -18.1 °C | 34.2 mm | 0.5 mm | — | — |
| June | 35.1 °C | 22.2 °C | 3.5 °C | 27.6 °C | 16.2 °C | 1.6 °C | 22.5 °C | 8.7 °C | -5.4 °C | 42.5 mm | 1.0 mm | — | — |
| July | 38.4 °C | 25.4 °C | 9.5 °C | 30.3 °C | 19.4 °C | 6.5 °C | 23.7 °C | 12.1 °C | -1.5 °C | 48.5 mm | 1.3 mm | — | — |
| August | 35.4 °C | 21.6 °C | 6.1 °C | 28.2 °C | 15.3 °C | 1.9 °C | 20.9 °C | 8.8 °C | -7.8 °C | 40.1 mm | 1.2 mm | — | — |
| September | 27.0 °C | 11.8 °C | -2.4 °C | 18.3 °C | 6.1 °C | -6.8 °C | 14.2 °C | 0.8 °C | -14.2 °C | 30.0 mm | 0.8 mm | — | — |
| October | 20.5 °C | -3.3 °C | -30.1 °C | 10.4 °C | -7.7 °C | -35.3 °C | 20.2 °C | -11.9 °C | -40.9 °C | 16.3 mm | 0.5 mm | — | — |
| November | 3.9 °C | -23.7 °C | -50.0 °C | -0.5 °C | -27.5 °C | -52.1 °C | -3.7 °C | -31.9 °C | -54.5 °C | 11.1 mm | 0.4 mm | — | — |
| December | -3.9 °C | -36.2 °C | -55.9 °C | -8.7 °C | -38.8 °C | -57.2 °C | -12.1 °C | -42.4 °C | -59.8 °C | 7.5 mm | 0.3 mm | — | — |
Data Visualisations
Remove WatermarksCurrent Year Climate Trends vs Historical


Max Temperature this Year | 1 of 6
Climate 12-Month Moving Averages


Max Temperature 12-Month MA | 1 of 6
Daily Data Points and Averages Throughout the Year


Average Max Temperature Throughout Year | 1 of 5
