Climate for Station: Enisejsk, Krasnoyarsk Krai, Russia
Loading live weather...
Climate Analysis & Overview
Enisejsk, located in the heart of Siberia, is experiencing a warming trend with significant increases in both high and low temperatures over the past decade. The precipitation is becoming more evenly distributed, which could impact local agriculture and water management strategies.
Siberian Climatic Context
Enisejsk, situated in Siberia's Krasnoyarsk Krai, is classified under the Köppen climate system as having a subarctic climate. This region is characterised by long, extremely cold winters and short, mild summers. The Yenisey River, a major geographical feature, influences local weather patterns by moderating temperatures and affecting precipitation. The all-time temperature trends in Enisejsk show a warming of 0.25°C (0.45°F) for highs and 0.23°C (0.41°F) for lows, indicating a gradual increase in temperature over the years.
Recent Decadal Temperature Trends
In the past decade, Enisejsk has seen a more pronounced warming trend. High temperatures have increased by 0.36°C (0.65°F), while low temperatures have risen by 0.84°C (1.51°F). This sharper increase in lows suggests that nights are warming faster than days, a pattern consistent with global climate observations. These changes could have implications for local ecosystems, potentially altering growing seasons and affecting biodiversity.
Temperature Extremes and Records
Enisejsk has experienced some of the most extreme temperatures recorded in Russia. The highest temperature reached was 35.6°C (96.1°F), while the lowest plummeted to -58.8°C (-73.8°F). These extremes highlight the vast thermal oscillations typical of the Siberian climate, which can pose challenges for infrastructure and human habitation.
Precipitation Patterns and Distribution
The Precipitation Concentration Index (PCI) has decreased from a baseline of 10.88 to a current value of 10.18, indicating a more even distribution of rainfall throughout the year. This marginal change suggests that precipitation events are becoming less concentrated, which could reduce the risk of flooding and improve water availability for agriculture. However, this trend requires careful monitoring to understand its long-term implications for water resource management.
Implications for Regional Climate Goals
Russia's climate goals include reducing greenhouse gas emissions and adapting to climate change impacts. The warming trends observed in Enisejsk align with broader regional patterns, underscoring the importance of mitigation and adaptation strategies. Recent weather events, such as unseasonably warm winters, highlight the urgency of these efforts. The data from Enisejsk can inform policy decisions and help shape sustainable development initiatives in the region.
Station Statistics
10-Year Trend
High: +0.31 °C/decade
Low: +0.80 °C/decade
Rain: +0.29 mm/decade
25-Year Trend
High: +0.54 °C/decade
Low: +0.50 °C/decade
Rain: +0.07 mm/decade
50-Year Trend
High: +0.36 °C/decade
Low: +0.48 °C/decade
Rain: +0.05 mm/decade
All-Time Trend
High: +0.25 °C/decade
Low: +0.23 °C/decade
Rain: +0.02 mm/decade
Percentage Above-Average Days
Last 12 Months: 49.3%
This Year: 65.8%
Precipitation Concentration Index (PCI) ℹ️
Last 12 Months: 10.4
Historical Average: 12.5
Percentile Rank of Last 12 Months ℹ️
High: 98th percentile
Low: 99th percentile
Rain: 87th percentile
Change in Variance ℹ️
High: -3.8%
Low: -15.6%
Intraday: -8.2%
Data Coverage
90.8%
First Year of Data
1884
Station Location
Historical Weather Records
| Max High | Avg High | Min High | Max Avg | Avg Avg | Min Avg | Max Low | Avg Low | Min Low | Max Precipitation | Avg Precipitation | Max Snow | Avg Snow | |
|---|---|---|---|---|---|---|---|---|---|---|---|---|---|
| Record | 35.6 °C | — | -49.1 °C | 30.2 °C | — | -56.6 °C | 21.6 °C | — | -58.8 °C | 74.4 mm | — | — | — |
| January | 3.5 °C | -16.3 °C | -45.2 °C | 0.7 °C | -21.6 °C | -56.6 °C | -1.4 °C | -26.7 °C | -58.8 °C | 13.1 mm | 0.8 mm | — | — |
| February | 7.1 °C | -12.7 °C | -39.5 °C | 1.4 °C | -18.6 °C | -45.8 °C | -0.5 °C | -24.6 °C | -53.3 °C | 11.5 mm | 0.6 mm | — | — |
| March | 16.5 °C | -2.9 °C | -25.6 °C | 8.9 °C | -9.8 °C | -36.5 °C | 5.3 °C | -16.6 °C | -47.1 °C | 13.8 mm | 0.5 mm | — | — |
| April | 27.0 °C | 5.9 °C | -20.0 °C | 17.5 °C | -0.3 °C | -25.8 °C | 10.3 °C | -6.1 °C | -35.6 °C | 21.5 mm | 0.8 mm | — | — |
| May | 33.2 °C | 14.1 °C | -2.6 °C | 23.7 °C | 7.9 °C | -7.8 °C | 18.2 °C | 1.9 °C | -17.1 °C | 33.1 mm | 1.3 mm | — | — |
| June | 35.4 °C | 21.9 °C | 4.8 °C | 28.2 °C | 15.7 °C | 1.2 °C | 20.5 °C | 8.9 °C | -3.9 °C | 40.0 mm | 1.9 mm | — | — |
| July | 35.6 °C | 24.7 °C | 11.6 °C | 30.2 °C | 18.9 °C | 7.7 °C | 21.6 °C | 12.2 °C | 1.2 °C | 64.3 mm | 2.0 mm | — | — |
| August | 33.6 °C | 20.9 °C | 6.2 °C | 26.5 °C | 15.2 °C | 1.7 °C | 20.7 °C | 9.5 °C | -3.1 °C | 74.4 mm | 2.1 mm | — | — |
| September | 29.2 °C | 13.5 °C | -2.7 °C | 21.6 °C | 8.3 °C | -4.4 °C | 16.9 °C | 3.7 °C | -8.9 °C | 40.1 mm | 1.6 mm | — | — |
| October | 23.7 °C | 3.8 °C | -17.9 °C | 16.3 °C | -0.2 °C | -24.9 °C | 12.7 °C | -3.5 °C | -29.7 °C | 27.7 mm | 1.4 mm | — | — |
| November | 12.0 °C | -7.6 °C | -42.0 °C | 7.9 °C | -11.6 °C | -45.2 °C | 4.5 °C | -15.8 °C | -49.0 °C | 19.5 mm | 1.3 mm | — | — |
| December | 6.1 °C | -14.8 °C | -49.1 °C | 2.9 °C | -19.5 °C | -50.6 °C | 1.1 °C | -24.2 °C | -54.5 °C | 15.3 mm | 1.0 mm | — | — |
Data Visualisations
Remove WatermarksCurrent Year Climate Trends vs Historical


Max Temperature this Year | 1 of 6
Climate 12-Month Moving Averages


Max Temperature 12-Month MA | 1 of 6
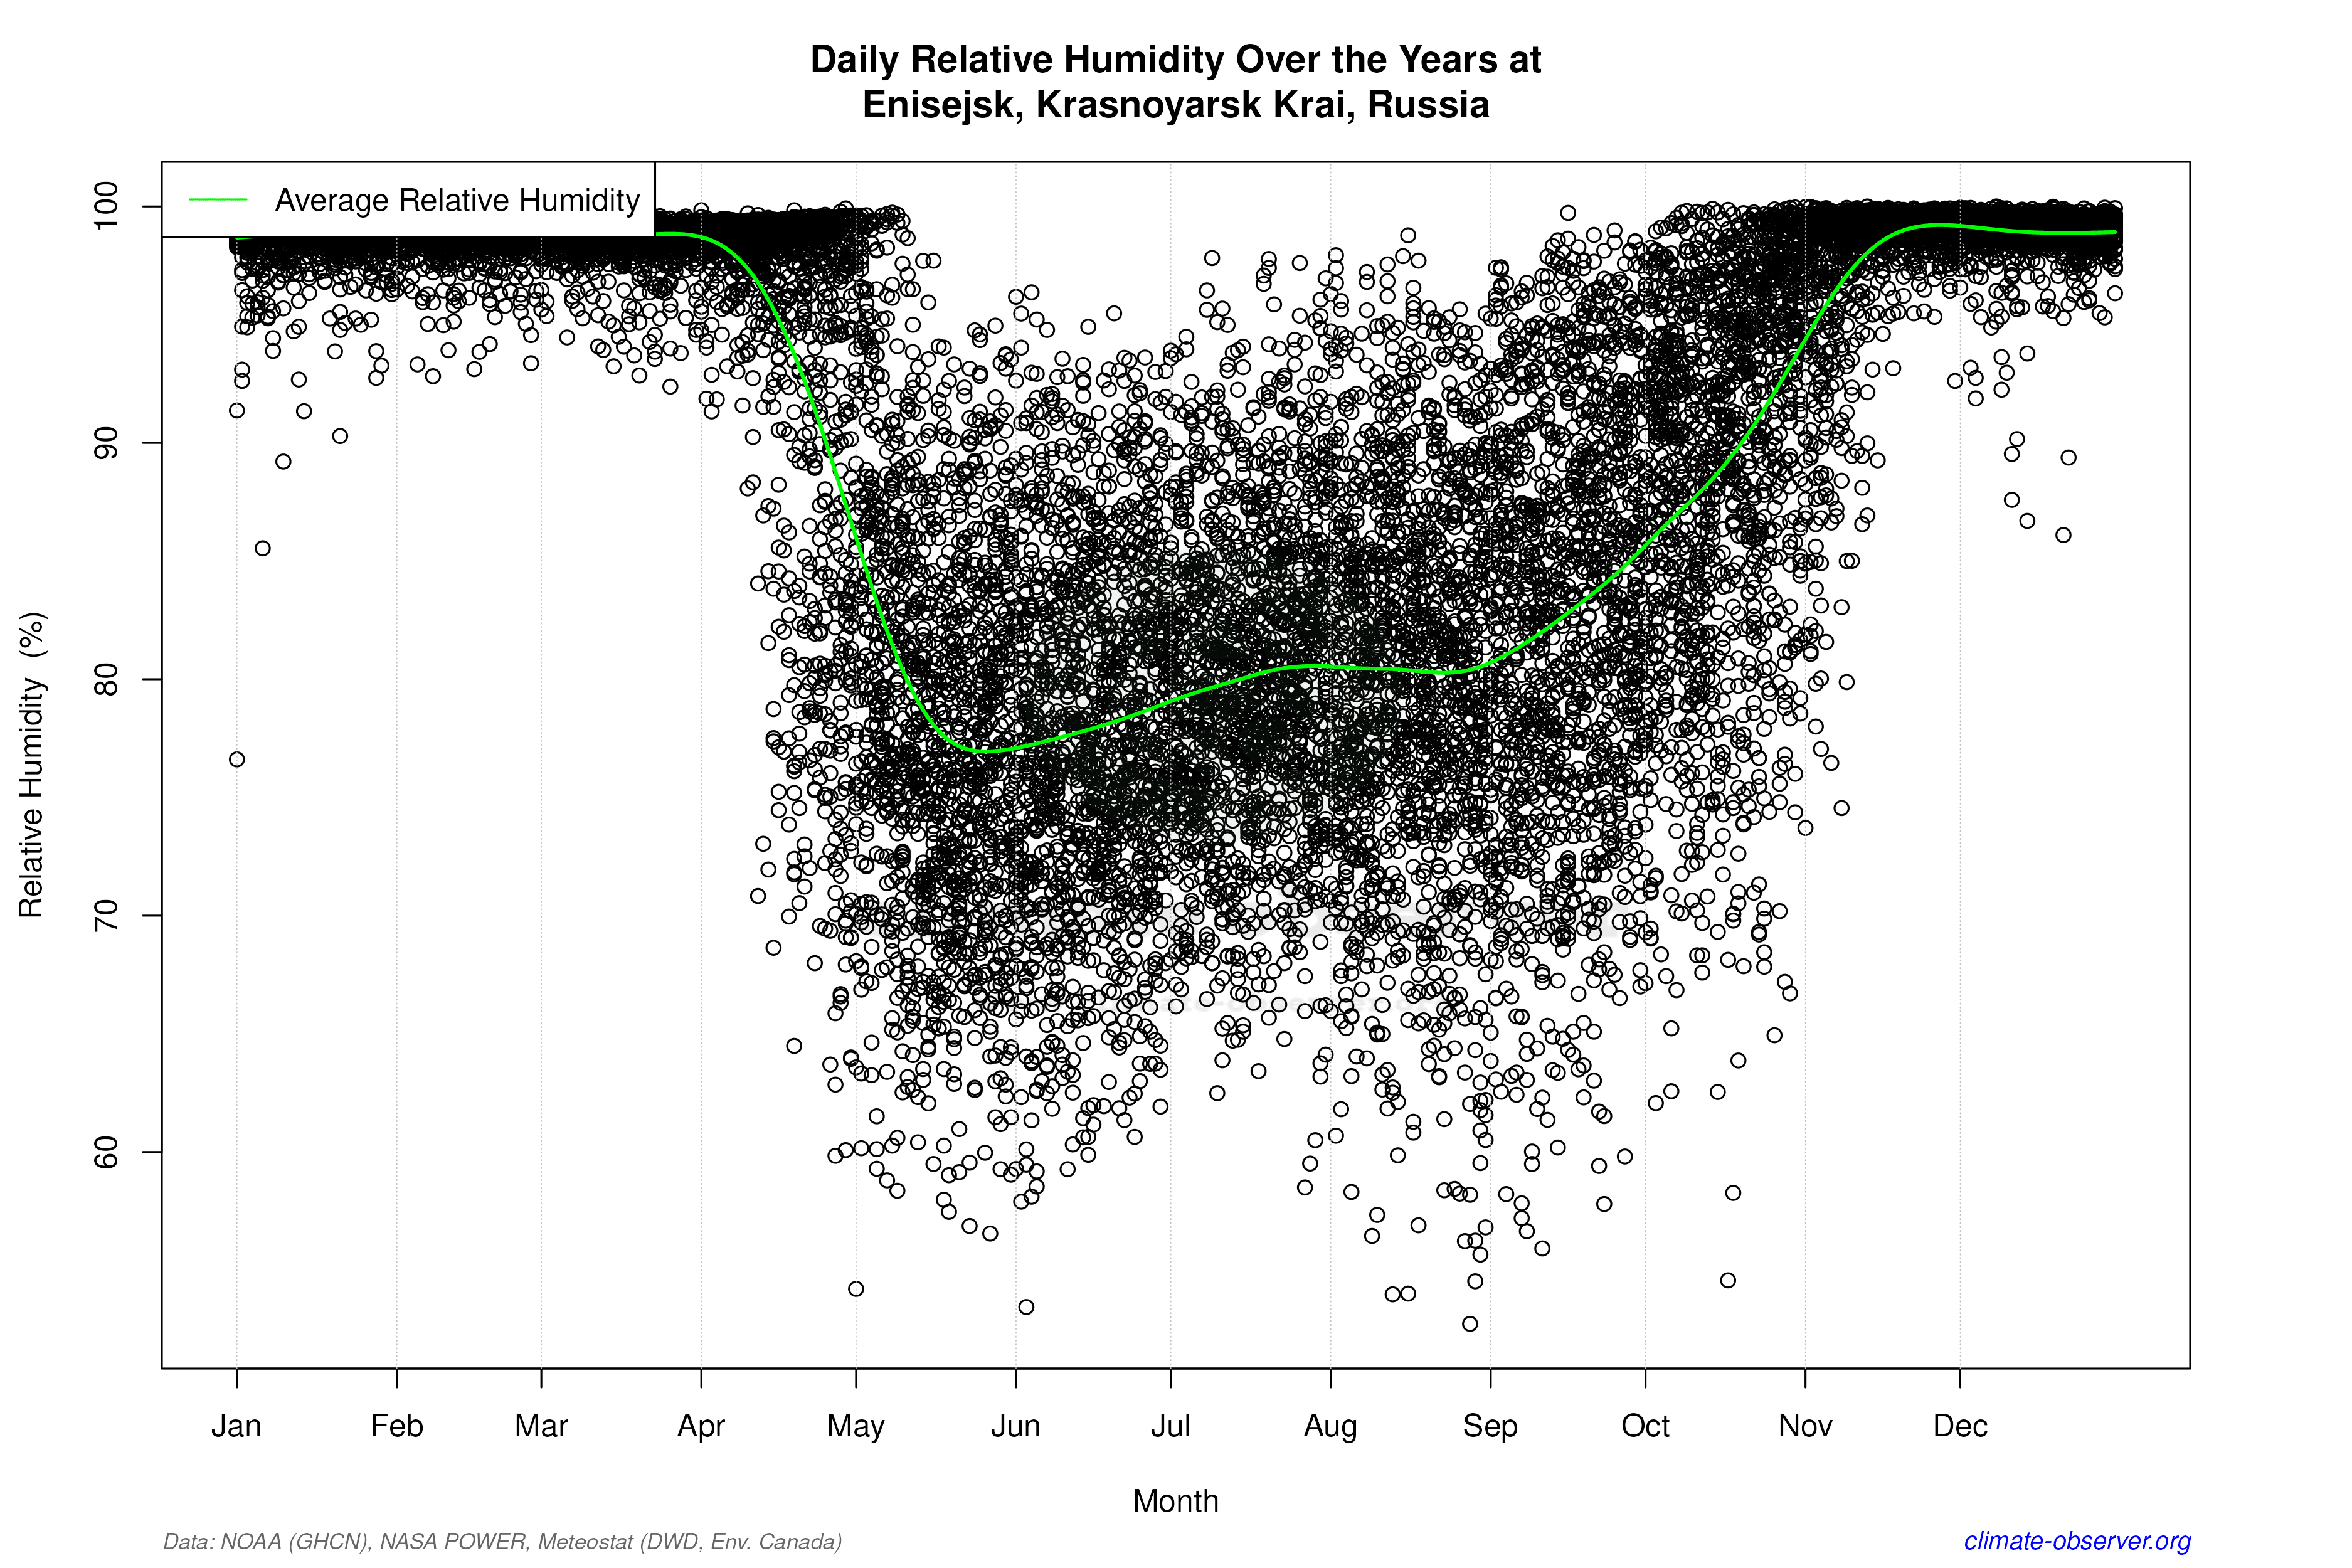
Daily Data Points and Averages Throughout the Year


Average Max Temperature Throughout Year | 1 of 5
