Climate for Station: Bomnak, Amur Oblast, Russia
Loading live weather...
Climate Analysis & Overview
Bomnak, situated in the Amur Oblast of Russia, is experiencing a marked warming trend, particularly notable in nighttime temperatures. The region's precipitation is becoming slightly more evenly distributed, aligning with broader climate goals for sustainable water management.
Geographical Context and Climate Classification
Bomnak, located at 54.7167° N, 128.8667° E, falls under the Köppen climate classification of Dfb, indicating a humid continental climate with warm summers and no dry season. The area's climate is significantly influenced by its proximity to the Zeya River and surrounding mountainous terrain, which can moderate temperature extremes and influence precipitation patterns. The region's geography plays a pivotal role in shaping its climate profile, contributing to both the recorded temperature extremes and the observed precipitation trends.
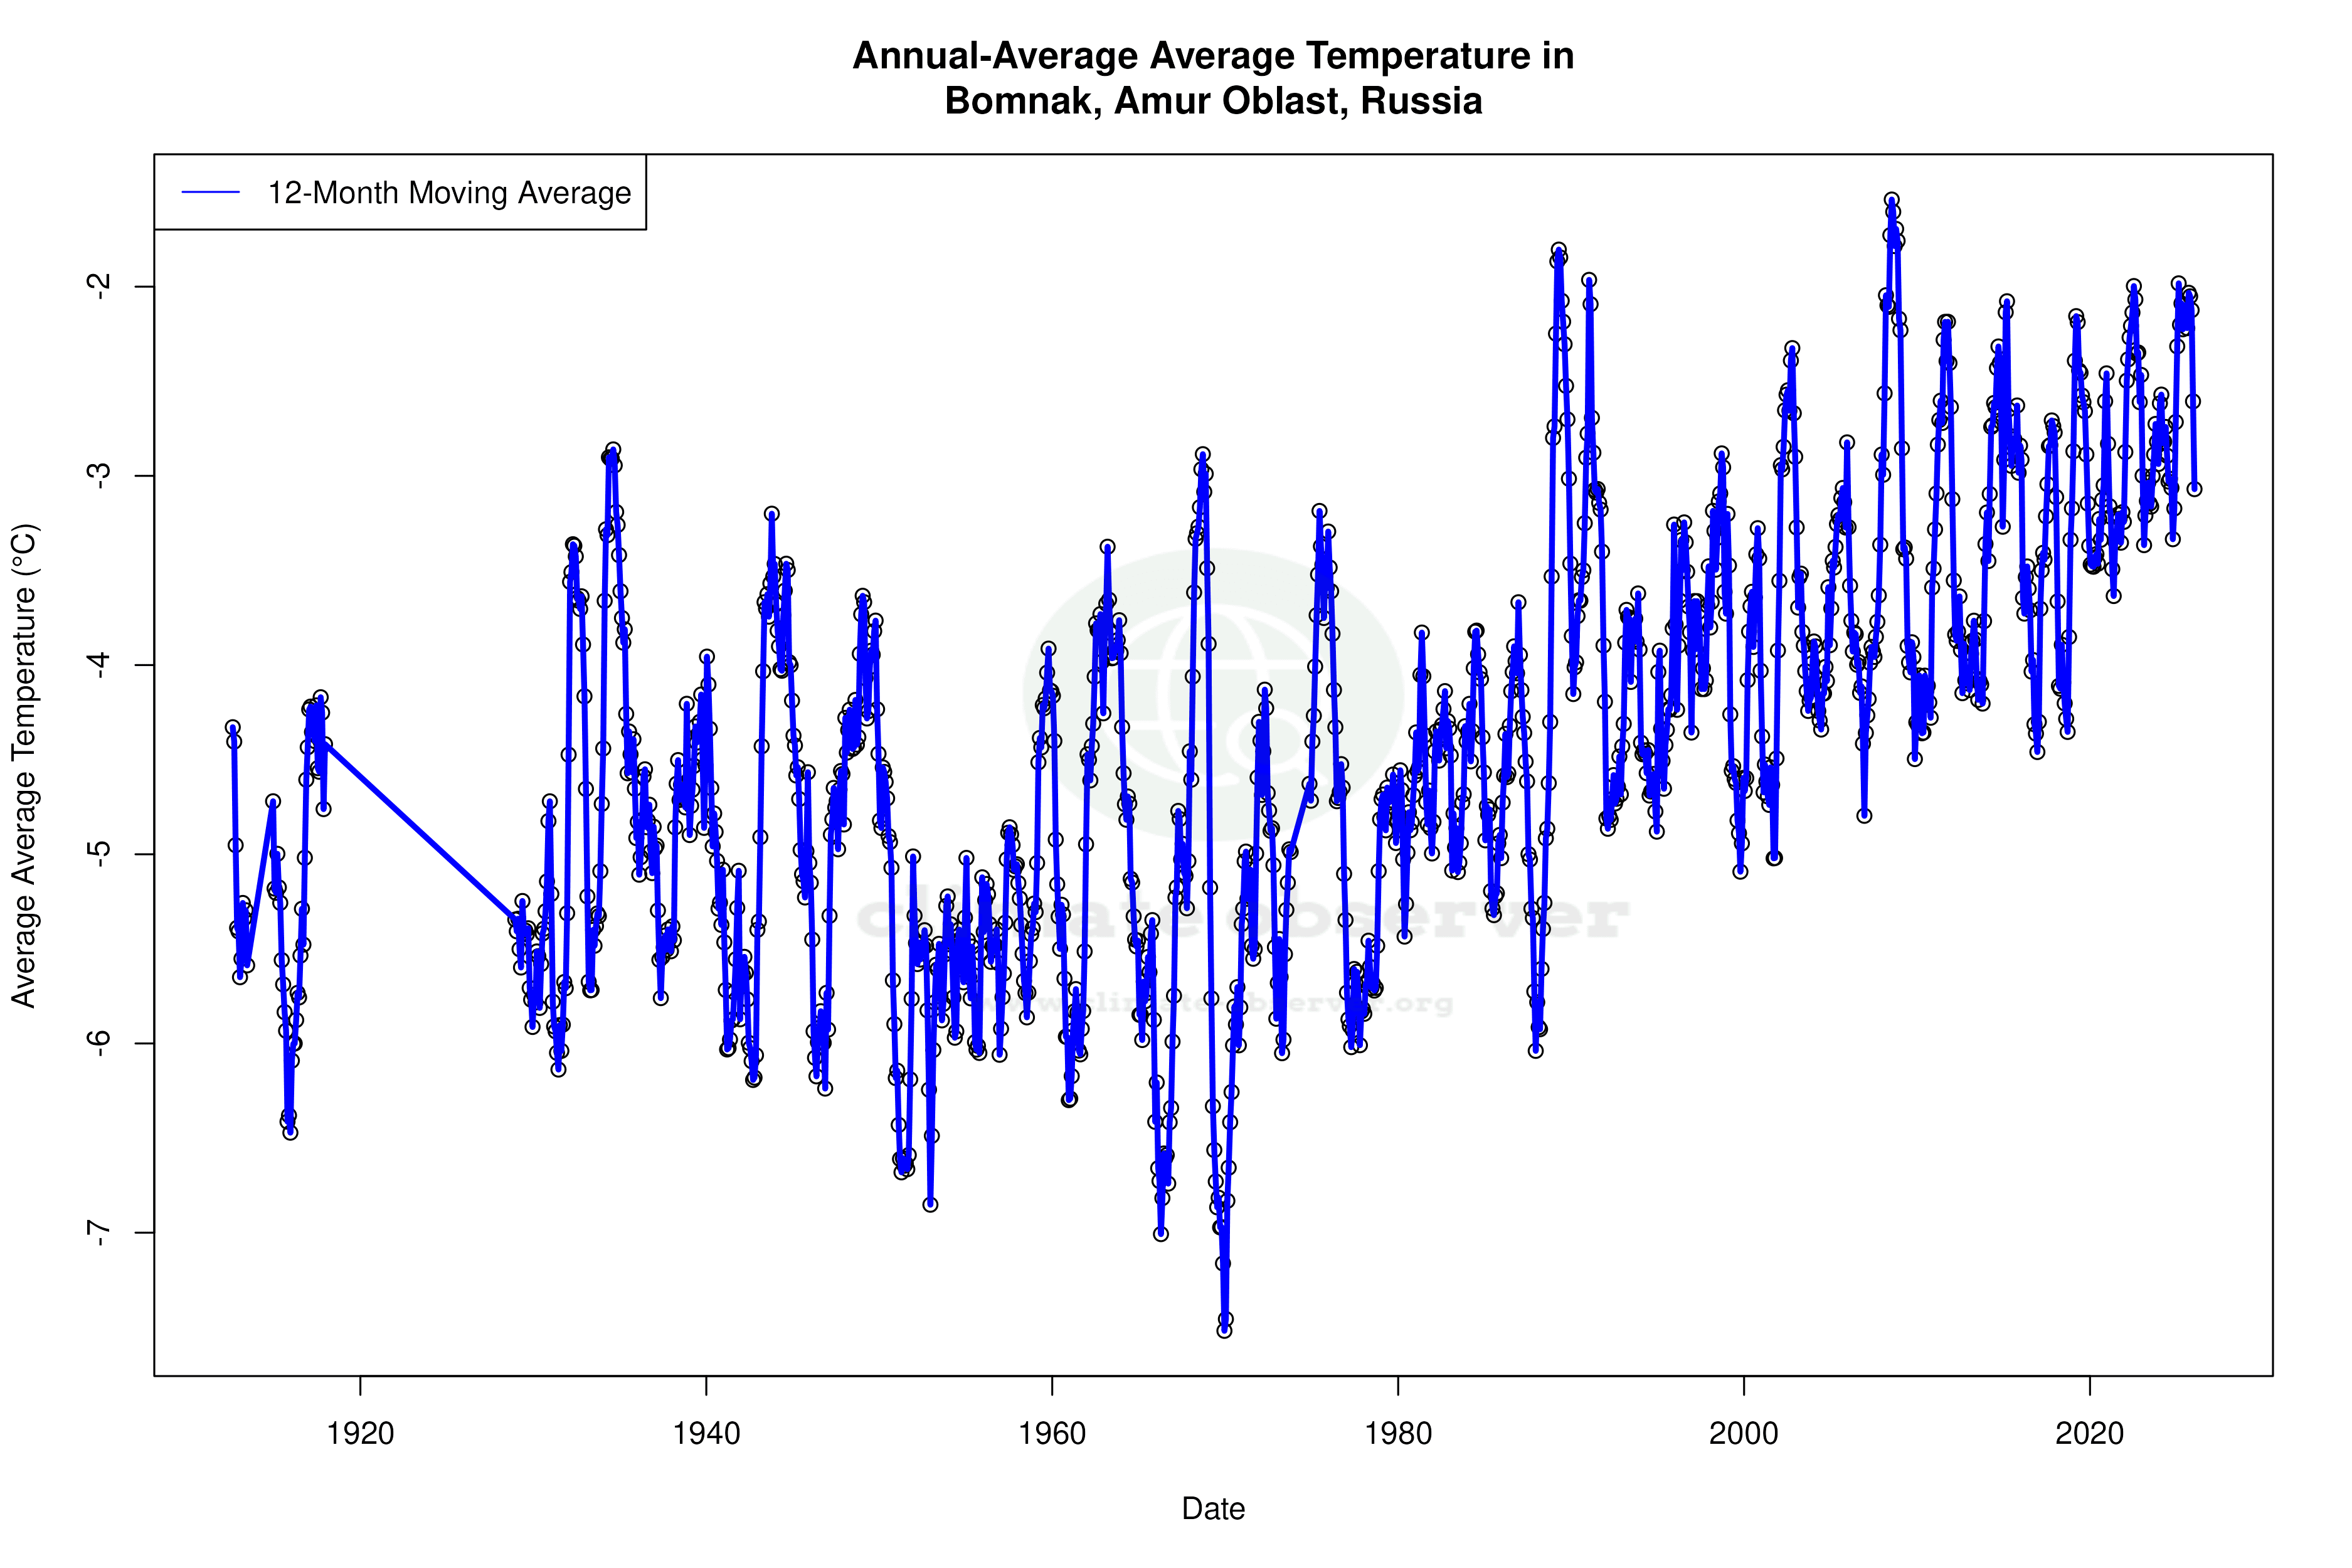
Temperature Trends: A Decade of Change
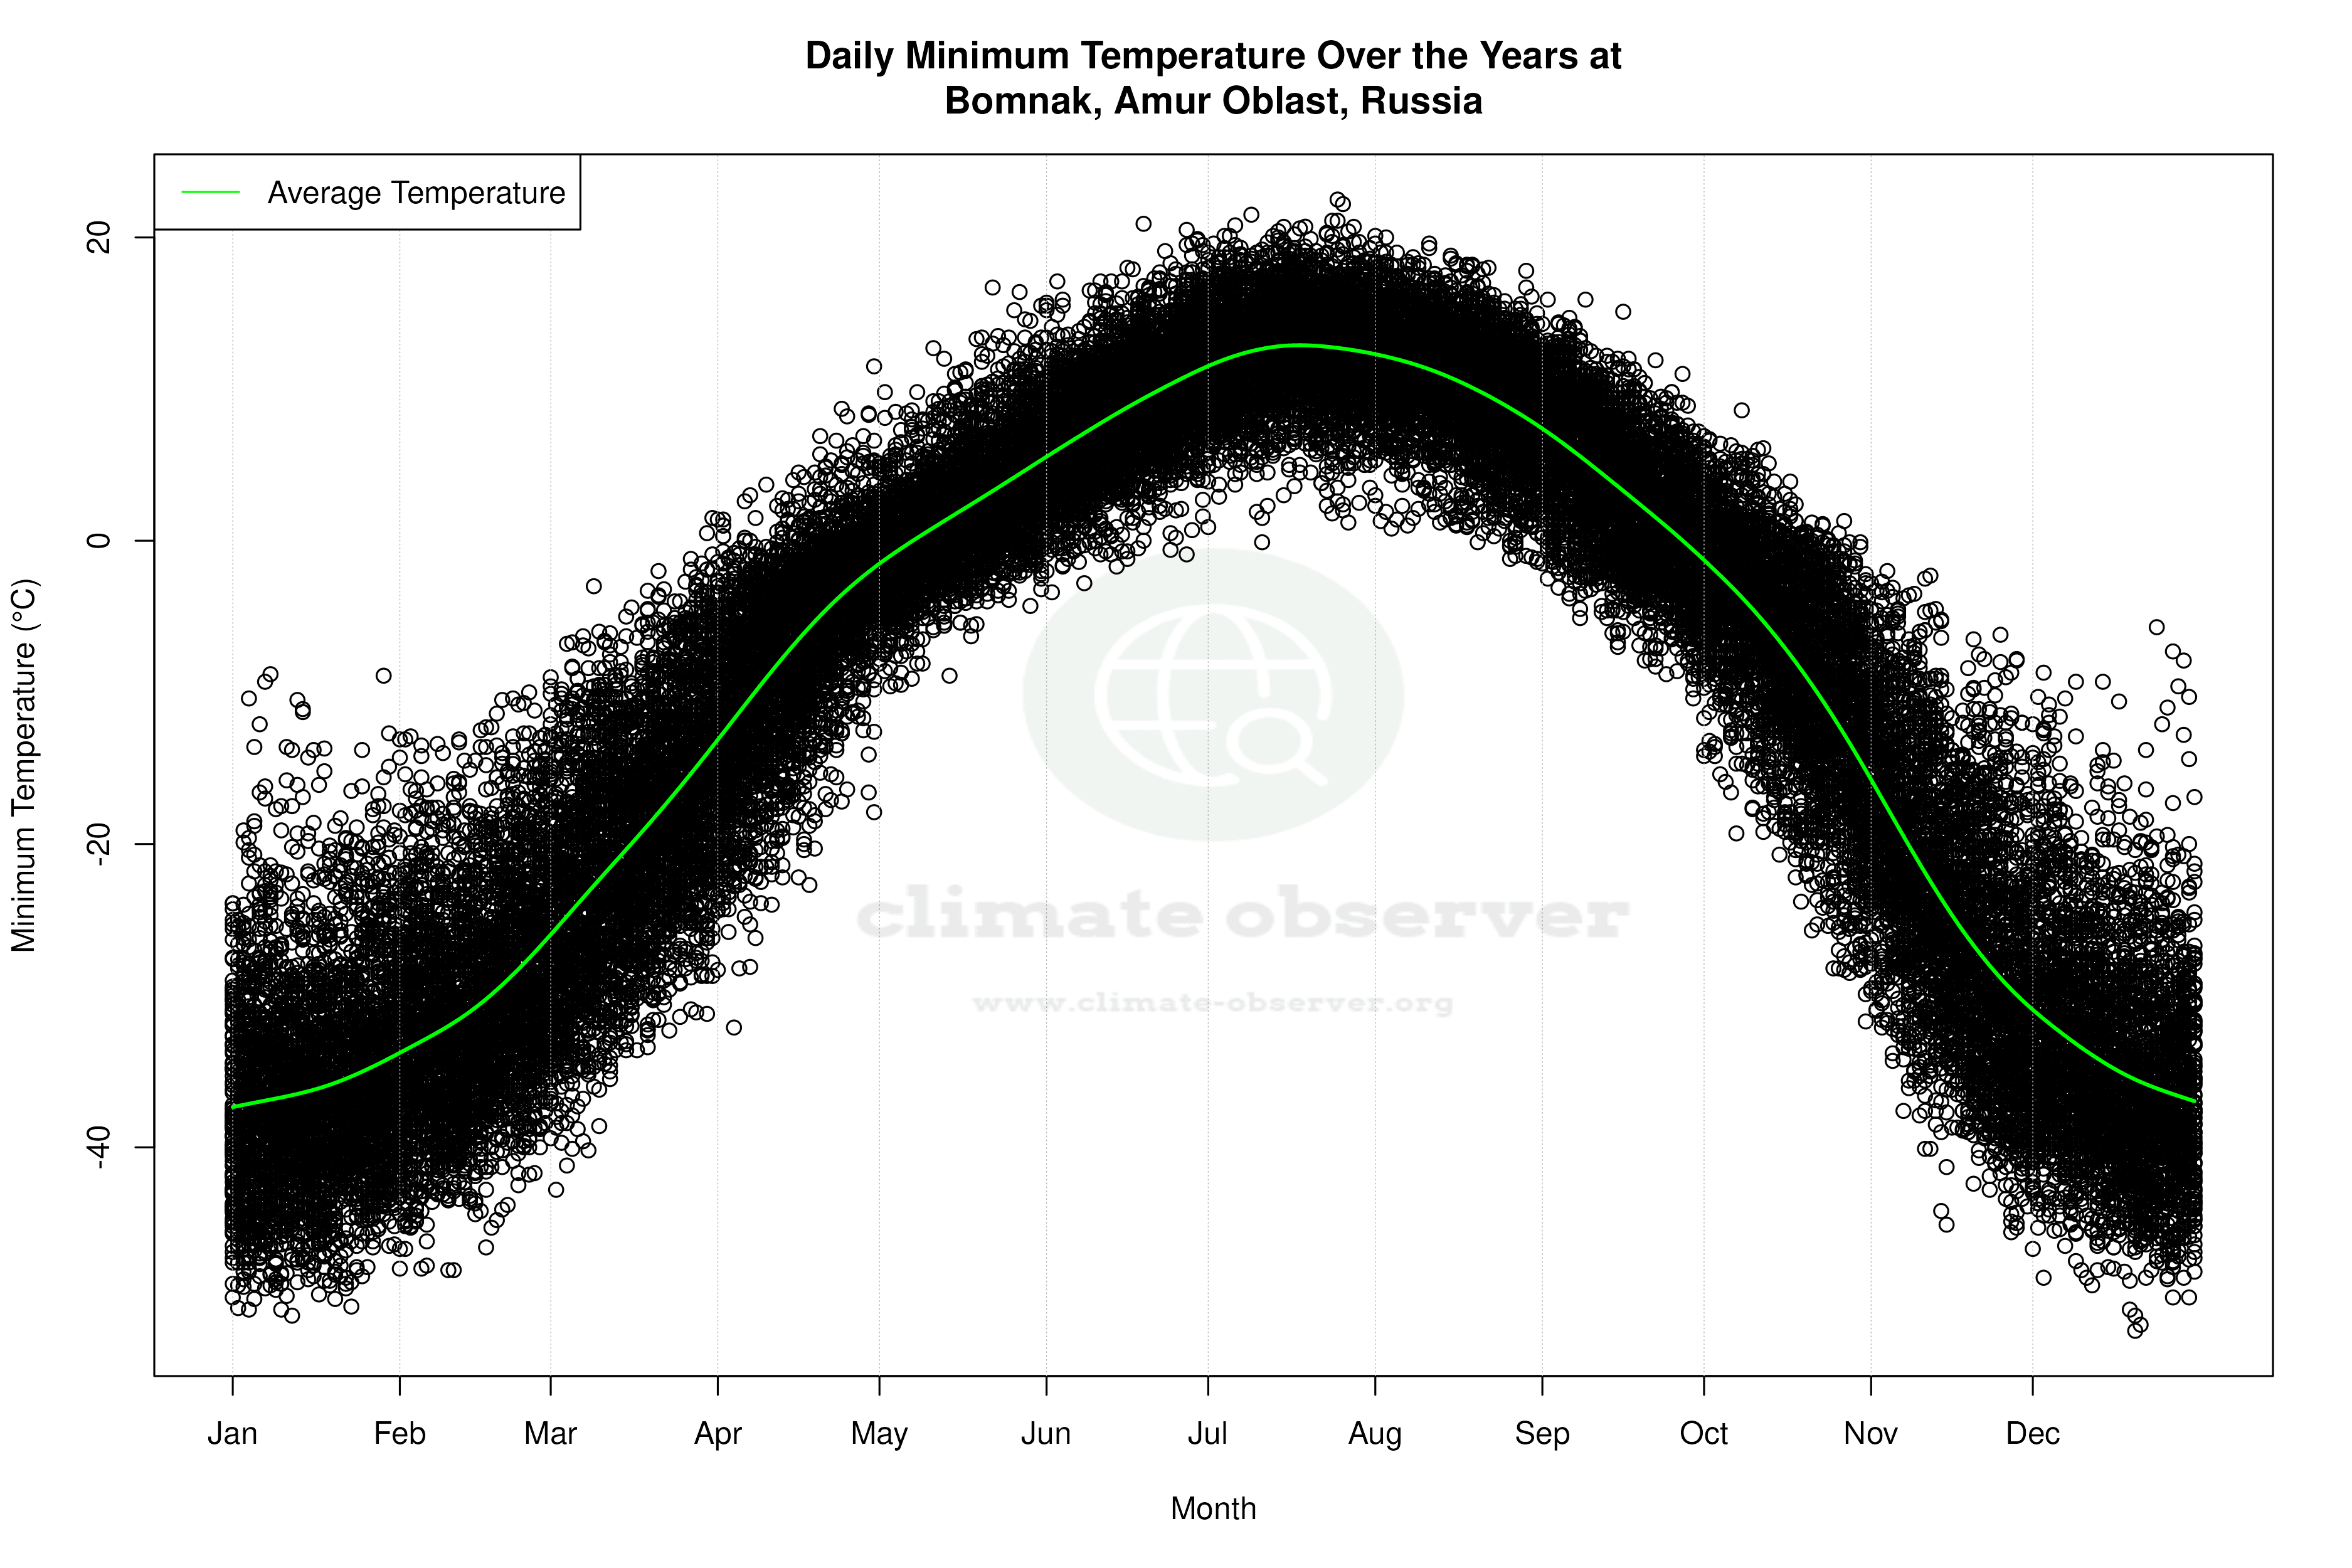
Over the past decade, Bomnak has seen a notable warming trend. High temperatures have increased by 0.91°C (1.64°F), while low temperatures have risen even more significantly by 1.43°C (2.58°F). This suggests that nighttime warming is more pronounced, a pattern consistent with global observations where minimum temperatures are rising faster than maximum temperatures. This trend could have implications for local ecosystems and agriculture, potentially extending growing seasons but also increasing heat stress.
Long-term Thermal Shifts
In the broader context, the all-time temperature trends in Bomnak indicate a more modest warming. Highs have risen by 0.13°C (0.23°F), and lows by 0.35°C (0.63°F). This long-term data suggests a persistent but gradual increase in temperatures, which aligns with global climate change patterns. The record high of 40.1°C (104.2°F) and the record low of -52.1°C (-61.8°F) highlight the region's capacity for extreme temperatures, underscoring the variability that can occur within this climate zone.
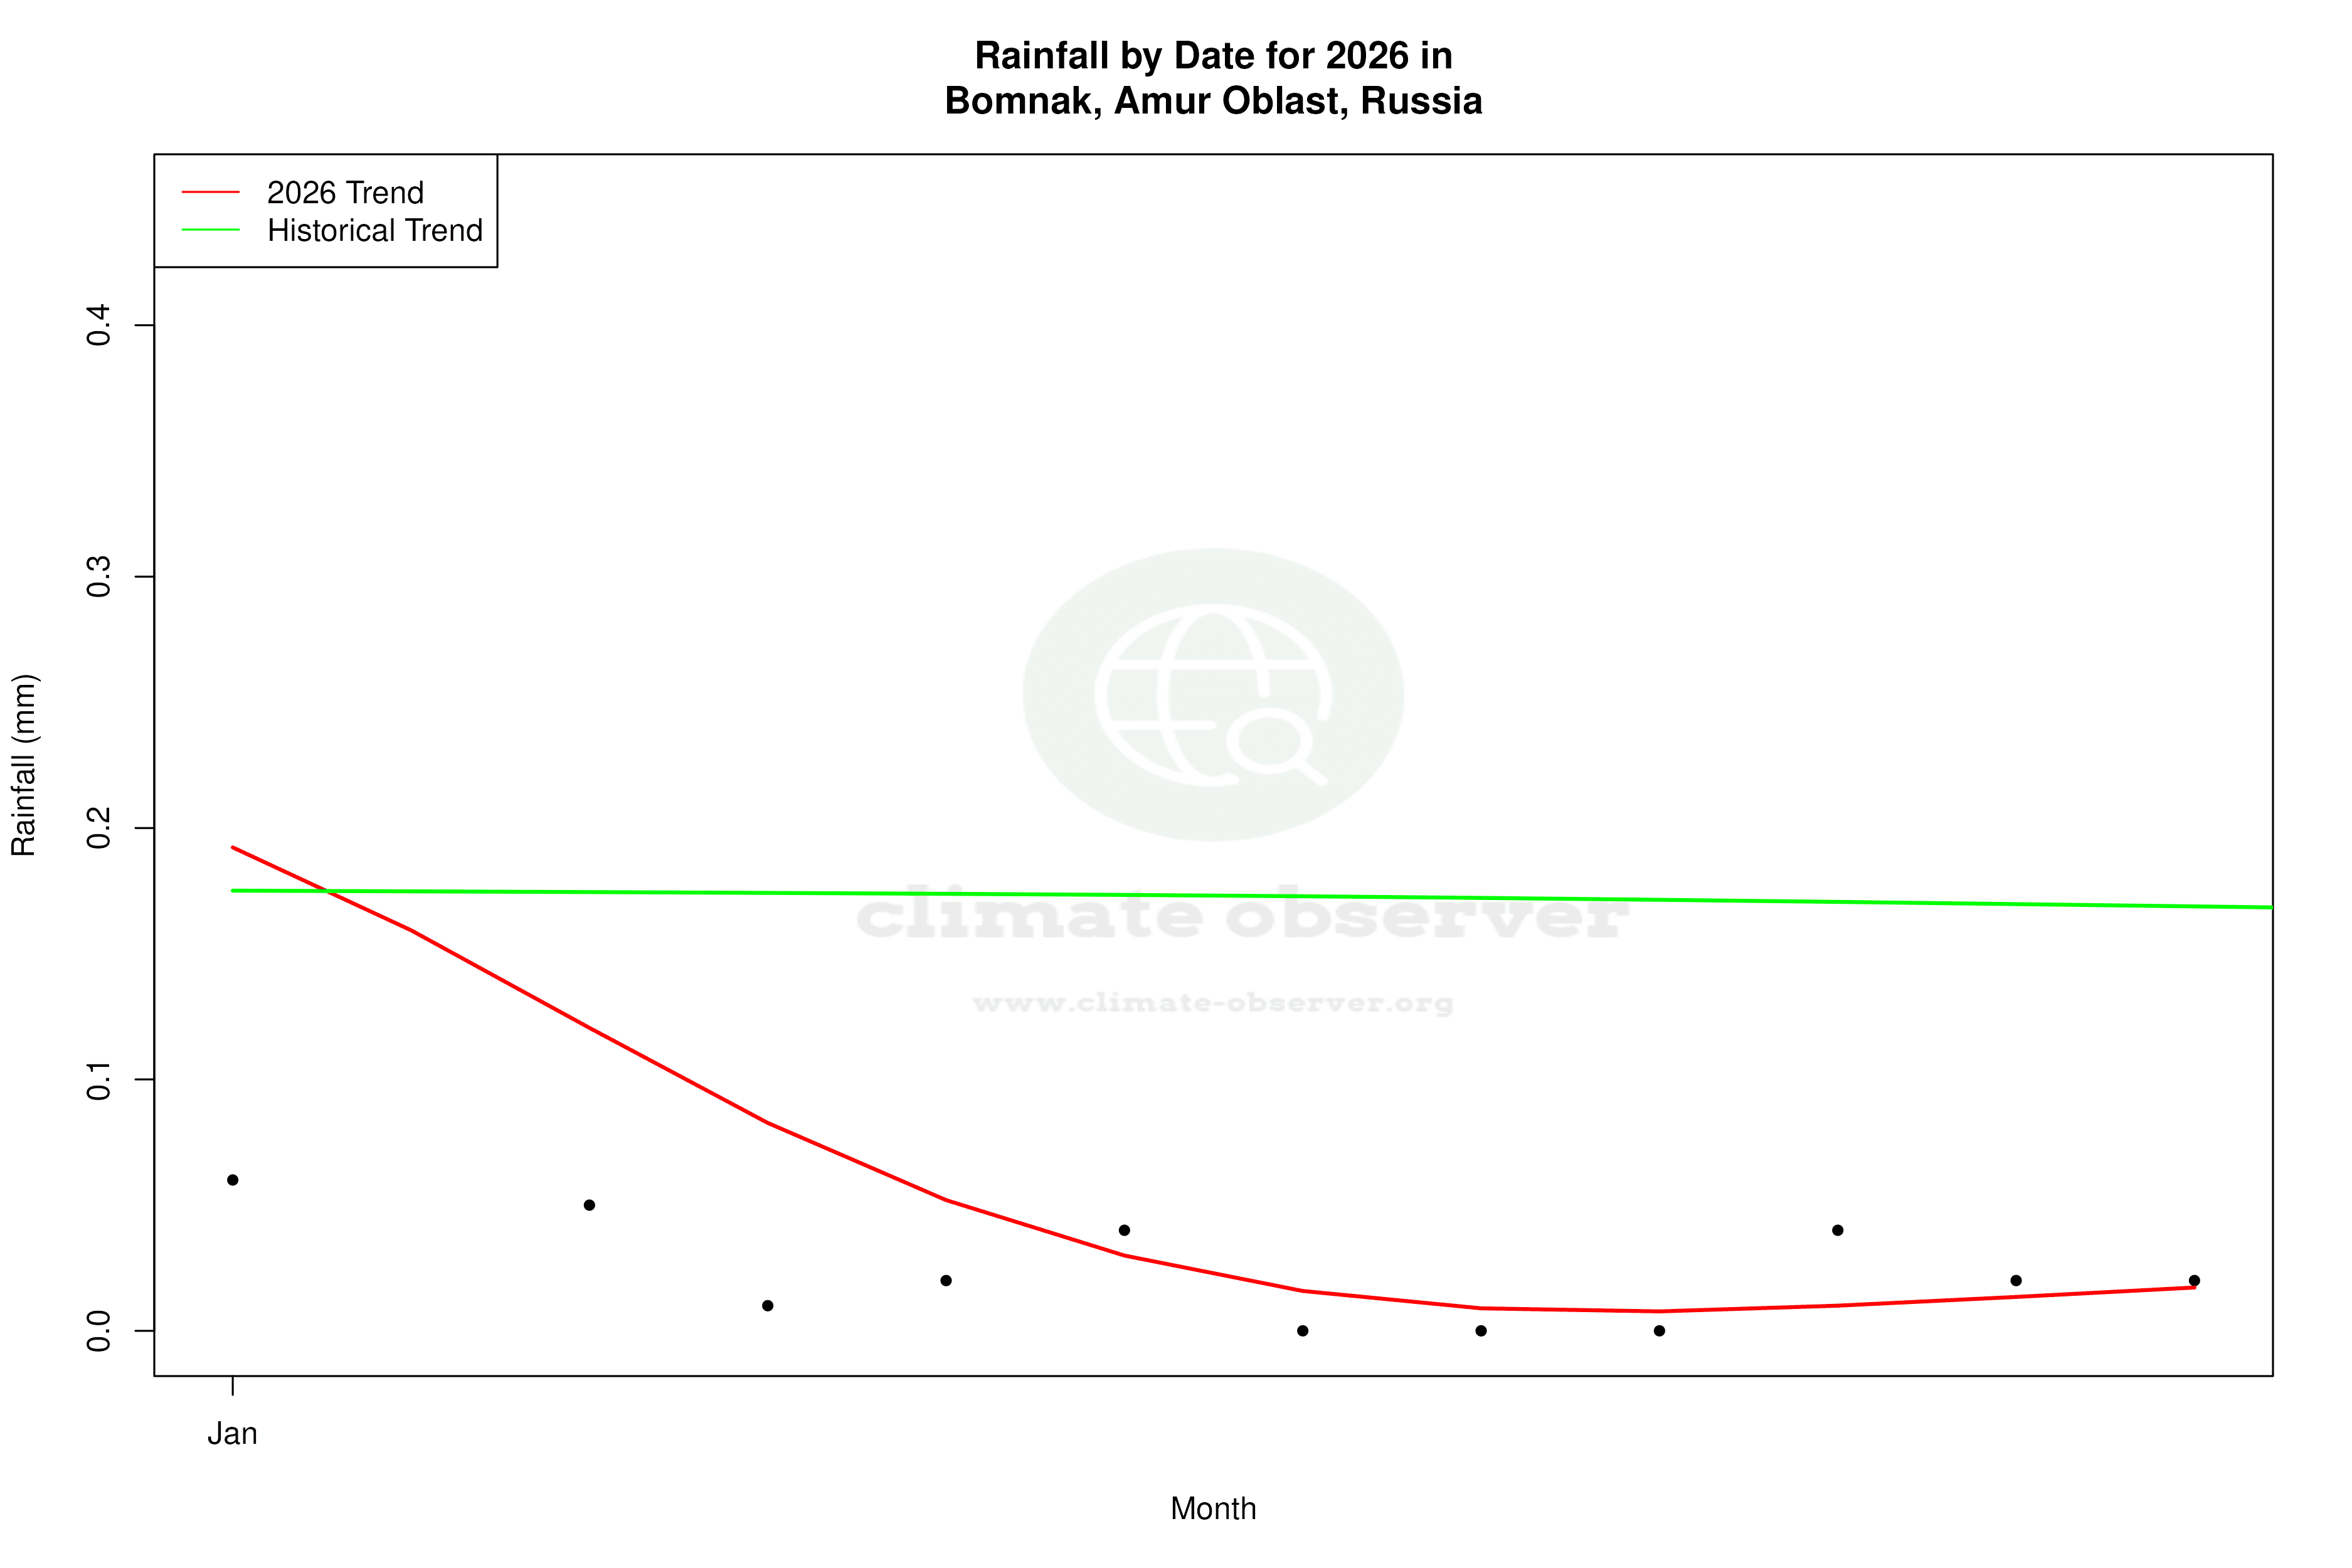
Precipitation Patterns: A Slight Redistribution
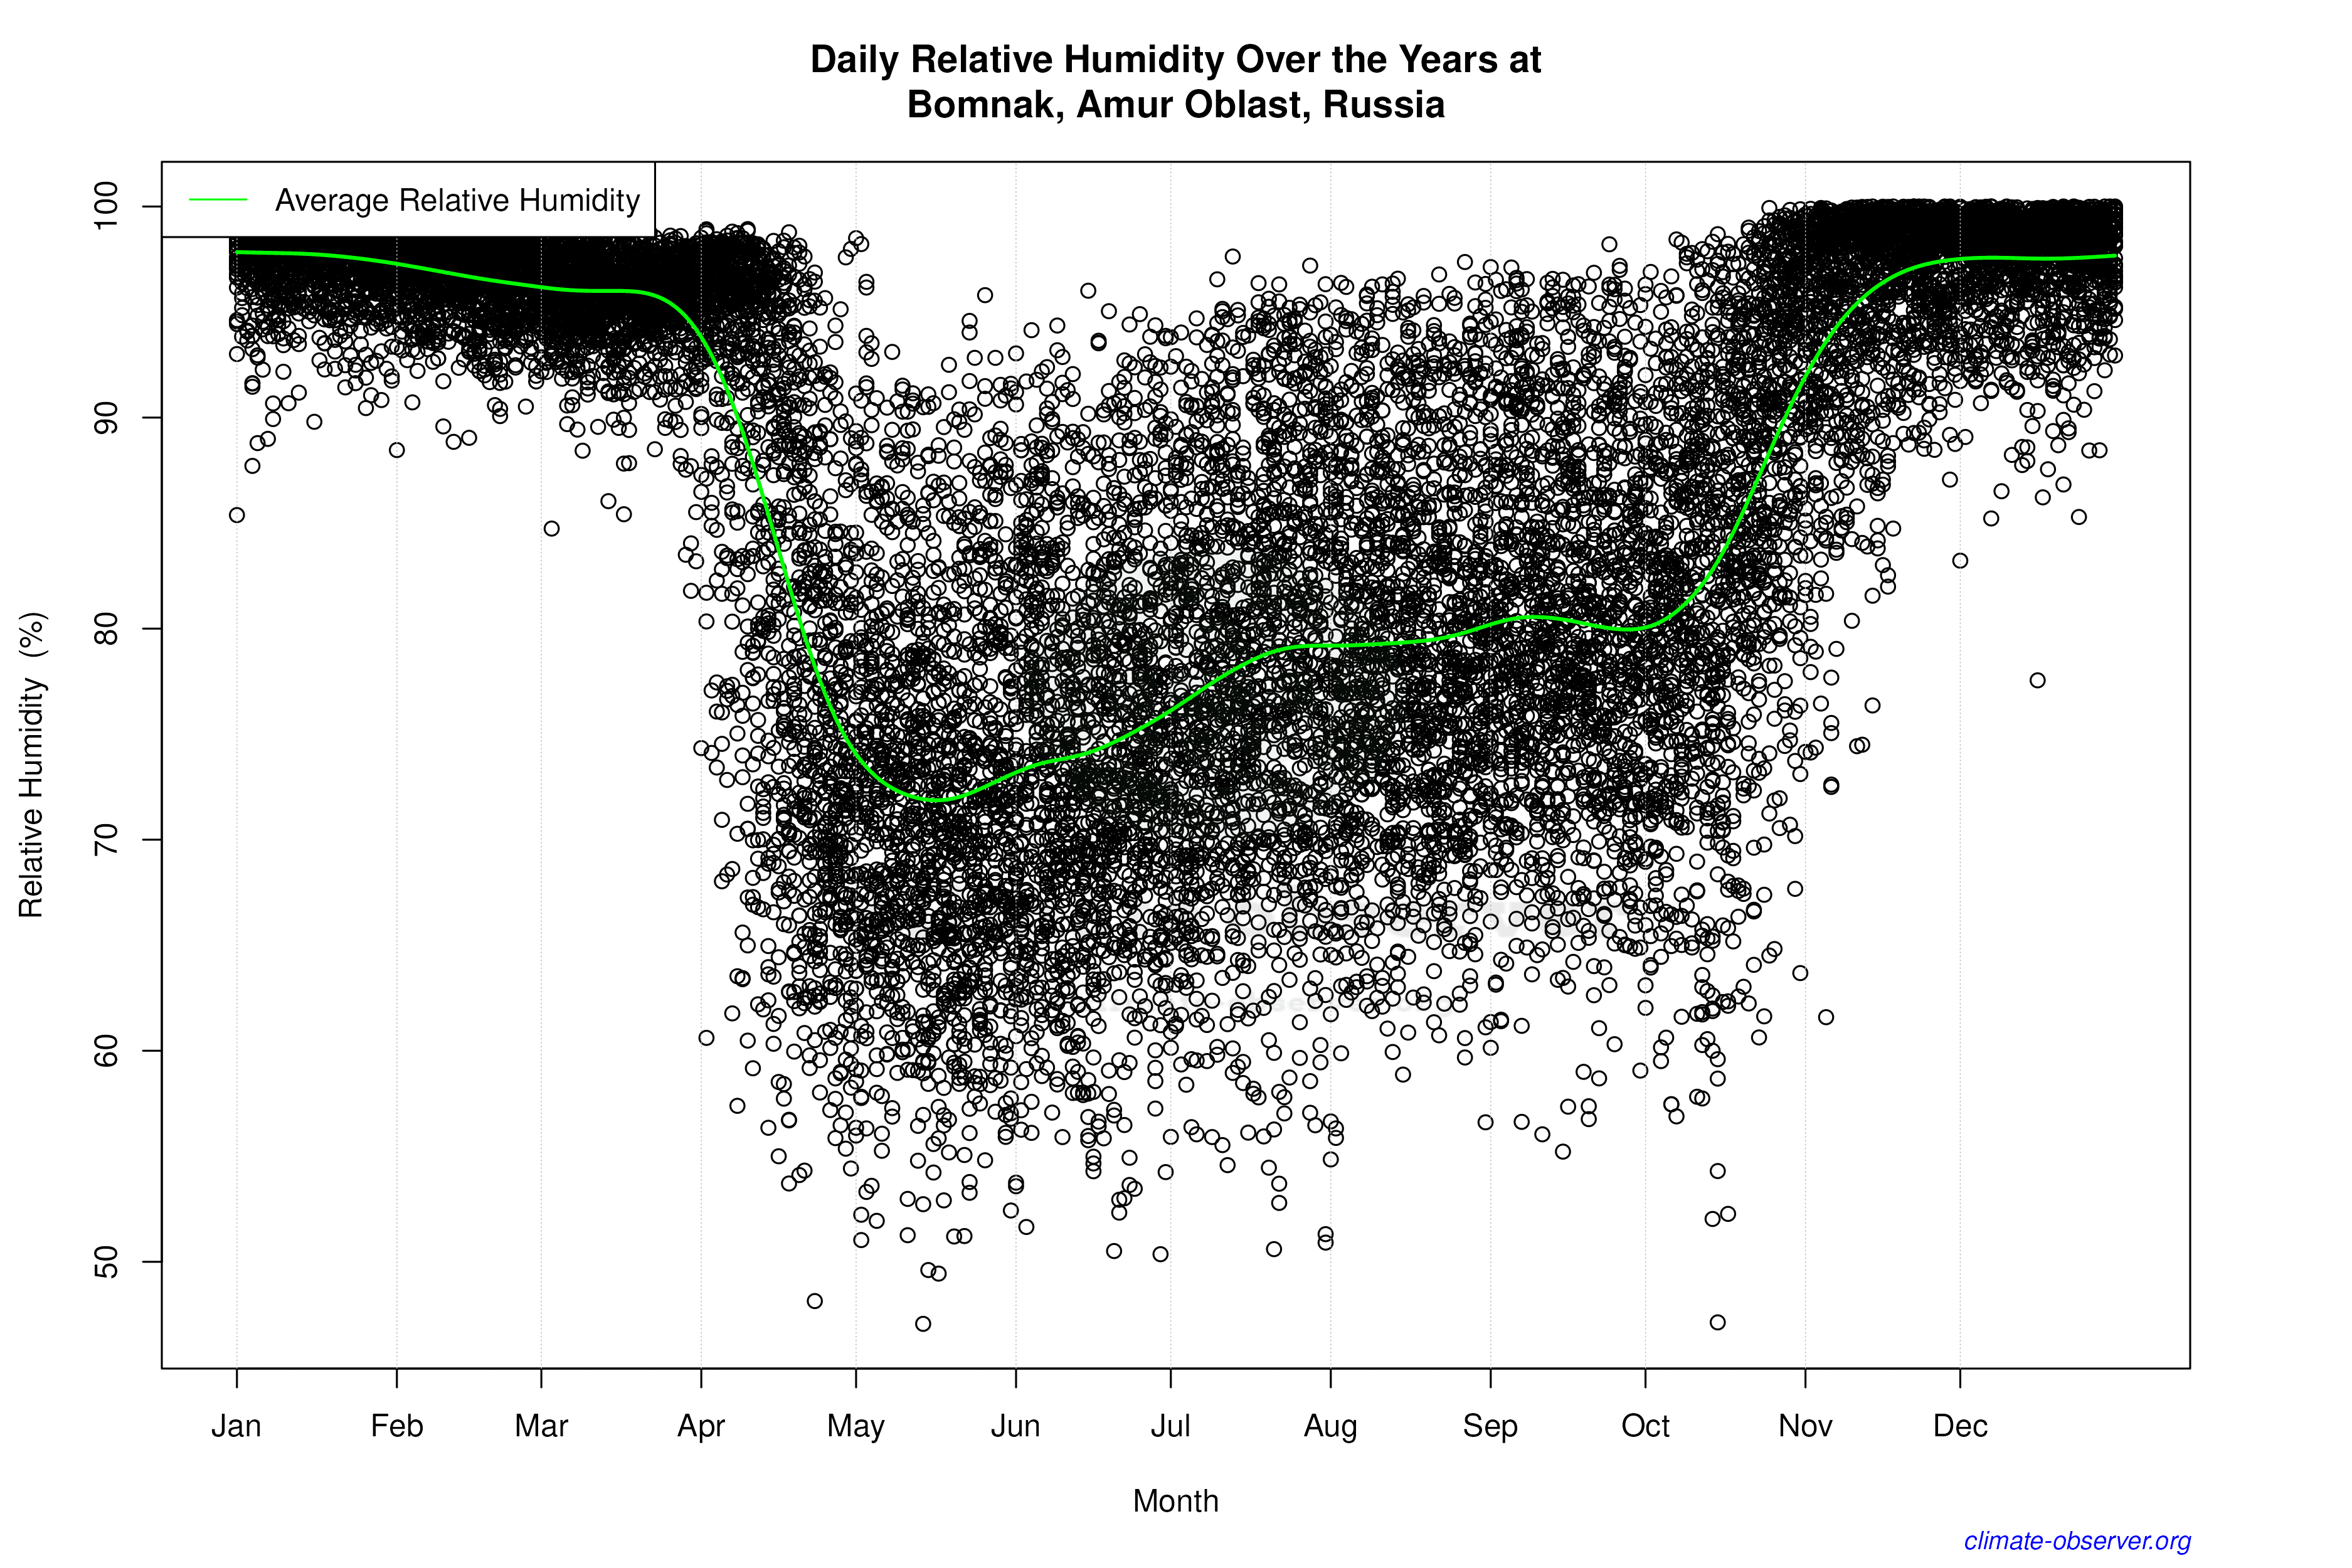
The Precipitation Concentration Index (PCI) for Bomnak has seen a slight decrease from a baseline of 15.54 to 15.24. PCI measures how precipitation is distributed over time, with lower values indicating more even distribution. This marginal change suggests that rainfall is becoming slightly more evenly spread throughout the year, which could be beneficial for water resource management and agricultural planning. Such a trend aligns with regional climate goals that aim to mitigate the impacts of extreme weather events and ensure sustainable water use.
Regional Implications and Climate Goals
The observed trends in Bomnak's climate data are reflective of broader regional climate goals in Russia, which include adapting to climate change and reducing greenhouse gas emissions. The increased evenness in precipitation distribution could aid in achieving these objectives by reducing the risk of droughts and floods. Meanwhile, the warming trends, particularly in nighttime temperatures, may necessitate adaptations in agriculture and infrastructure to cope with the changing climate dynamics.
Station Statistics
10-Year Trend
High: +0.66 °C/decade
Low: +1.61 °C/decade
Rain: +0.45 mm/decade
25-Year Trend
High: +0.12 °C/decade
Low: +0.33 °C/decade
Rain: +0.14 mm/decade
50-Year Trend
High: +0.26 °C/decade
Low: +0.51 °C/decade
Rain: +0.03 mm/decade
All-Time Trend
High: +0.13 °C/decade
Low: +0.35 °C/decade
Rain: +0.02 mm/decade
Percentage Above-Average Days
Last 12 Months: 44.9%
This Year: 32.6%
Precipitation Concentration Index (PCI) ℹ️
Last 12 Months: 12.9
Historical Average: 17.0
Percentile Rank of Last 12 Months ℹ️
High: 71st percentile
Low: 99th percentile
Rain: 93rd percentile
Change in Variance ℹ️
High: -5.9%
Low: -8.9%
Intraday: -14.1%
Data Coverage
90.9%
First Year of Data
1909
Station Location
Historical Weather Records
| Max High | Avg High | Min High | Max Avg | Avg Avg | Min Avg | Max Low | Avg Low | Min Low | Max Precipitation | Avg Precipitation | Max Snow | Avg Snow | |
|---|---|---|---|---|---|---|---|---|---|---|---|---|---|
| Record | 40.1 °C | — | -42.9 °C | 29.1 °C | — | -47.1 °C | 22.5 °C | — | -52.1 °C | 101.2 mm | — | — | — |
| January | -4.1 °C | -25.3 °C | -42.0 °C | -5.9 °C | -30.7 °C | -45.8 °C | -8.8 °C | -36.0 °C | -51.1 °C | 6.1 mm | 0.2 mm | — | — |
| February | 1.6 °C | -17.1 °C | -33.6 °C | -6.3 °C | -23.8 °C | -40.0 °C | -10.0 °C | -30.6 °C | -48.1 °C | 13.6 mm | 0.2 mm | — | — |
| March | 9.6 °C | -5.8 °C | -24.2 °C | 3.9 °C | -12.6 °C | -31.8 °C | 1.5 °C | -19.8 °C | -42.8 °C | 22.3 mm | 0.3 mm | — | — |
| April | 24.2 °C | 4.6 °C | -11.6 °C | 15.1 °C | -0.9 °C | -19.0 °C | 11.5 °C | -6.9 °C | -32.1 °C | 29.4 mm | 1.0 mm | — | — |
| May | 31.9 °C | 14.7 °C | -0.7 °C | 23.0 °C | 8.3 °C | -3.0 °C | 16.7 °C | 1.9 °C | -9.6 °C | 45.2 mm | 1.7 mm | — | — |
| June | 35.8 °C | 22.1 °C | 6.0 °C | 27.7 °C | 15.3 °C | 3.6 °C | 20.9 °C | 8.6 °C | -3.4 °C | 56.9 mm | 2.6 mm | — | — |
| July | 40.1 °C | 24.6 °C | 10.2 °C | 29.1 °C | 18.2 °C | 6.0 °C | 22.5 °C | 12.6 °C | -0.1 °C | 93.0 mm | 4.0 mm | — | — |
| August | 34.0 °C | 21.8 °C | 8.1 °C | 24.9 °C | 15.7 °C | 5.3 °C | 20.1 °C | 10.4 °C | -1.4 °C | 101.2 mm | 3.8 mm | — | — |
| September | 27.8 °C | 14.8 °C | -1.4 °C | 20.0 °C | 8.6 °C | -4.5 °C | 15.9 °C | 3.4 °C | -10.4 °C | 57.4 mm | 2.5 mm | — | — |
| October | 20.8 °C | 3.1 °C | -19.1 °C | 13.2 °C | -2.5 °C | -23.1 °C | 8.6 °C | -7.4 °C | -31.7 °C | 32.4 mm | 1.1 mm | — | — |
| November | 6.1 °C | -13.8 °C | -34.9 °C | -0.3 °C | -19.0 °C | -40.3 °C | -2.0 °C | -24.1 °C | -45.6 °C | 18.6 mm | 0.7 mm | — | — |
| December | -1.1 °C | -24.8 °C | -42.9 °C | -4.2 °C | -29.6 °C | -47.1 °C | -5.7 °C | -34.3 °C | -52.1 °C | 11.7 mm | 0.3 mm | — | — |
Data Visualisations
Remove WatermarksCurrent Year Climate Trends vs Historical


Max Temperature this Year | 1 of 6
Climate 12-Month Moving Averages


Max Temperature 12-Month MA | 1 of 6
Daily Data Points and Averages Throughout the Year


Average Max Temperature Throughout Year | 1 of 5
