Climate for Station: Petropavlovsk-Kamchatskij, Kamchatka Krai, Russia
Loading live weather...
Climate Analysis & Overview
Petropavlovsk-Kamchatskij is experiencing a nuanced climate shift, with a warming trend in lows and a cooling trend in highs over the past decade. The overall warming of both highs and lows over the longer term, coupled with a slight decrease in precipitation concentration, suggests a subtle yet meaningful transformation in the region's climate dynamics.
Köppen Climate Context and Geographic Influence
Petropavlovsk-Kamchatskij, situated in the Kamchatka Peninsula, falls under the subarctic climate category (Dfc) in the Köppen classification. This climate type is characterized by long, cold winters and short, mild summers. The city's proximity to the Pacific Ocean and its mountainous terrain significantly influences its weather patterns, often resulting in substantial snowfall and a maritime climate effect that moderates temperature extremes. The local geography plays a pivotal role in shaping the observed climate trends.
Decadal Temperature Trends: A Mixed Bag
The past decade has seen a divergence in temperature trends in Petropavlovsk-Kamchatskij. The high temperatures have shown a slight cooling of 0.04°C (0.07°F), while the low temperatures have experienced a warming of 0.59°C (1.06°F). This contrast highlights a complex thermal dynamic where nighttime temperatures are rising, potentially affecting local ecosystems and human activities. Despite this recent cooling in highs, the all-time trend indicates a warming of 0.31°C (0.56°F) for highs and 0.26°C (0.47°F) for lows, suggesting an overall increase in temperatures over the longer term.
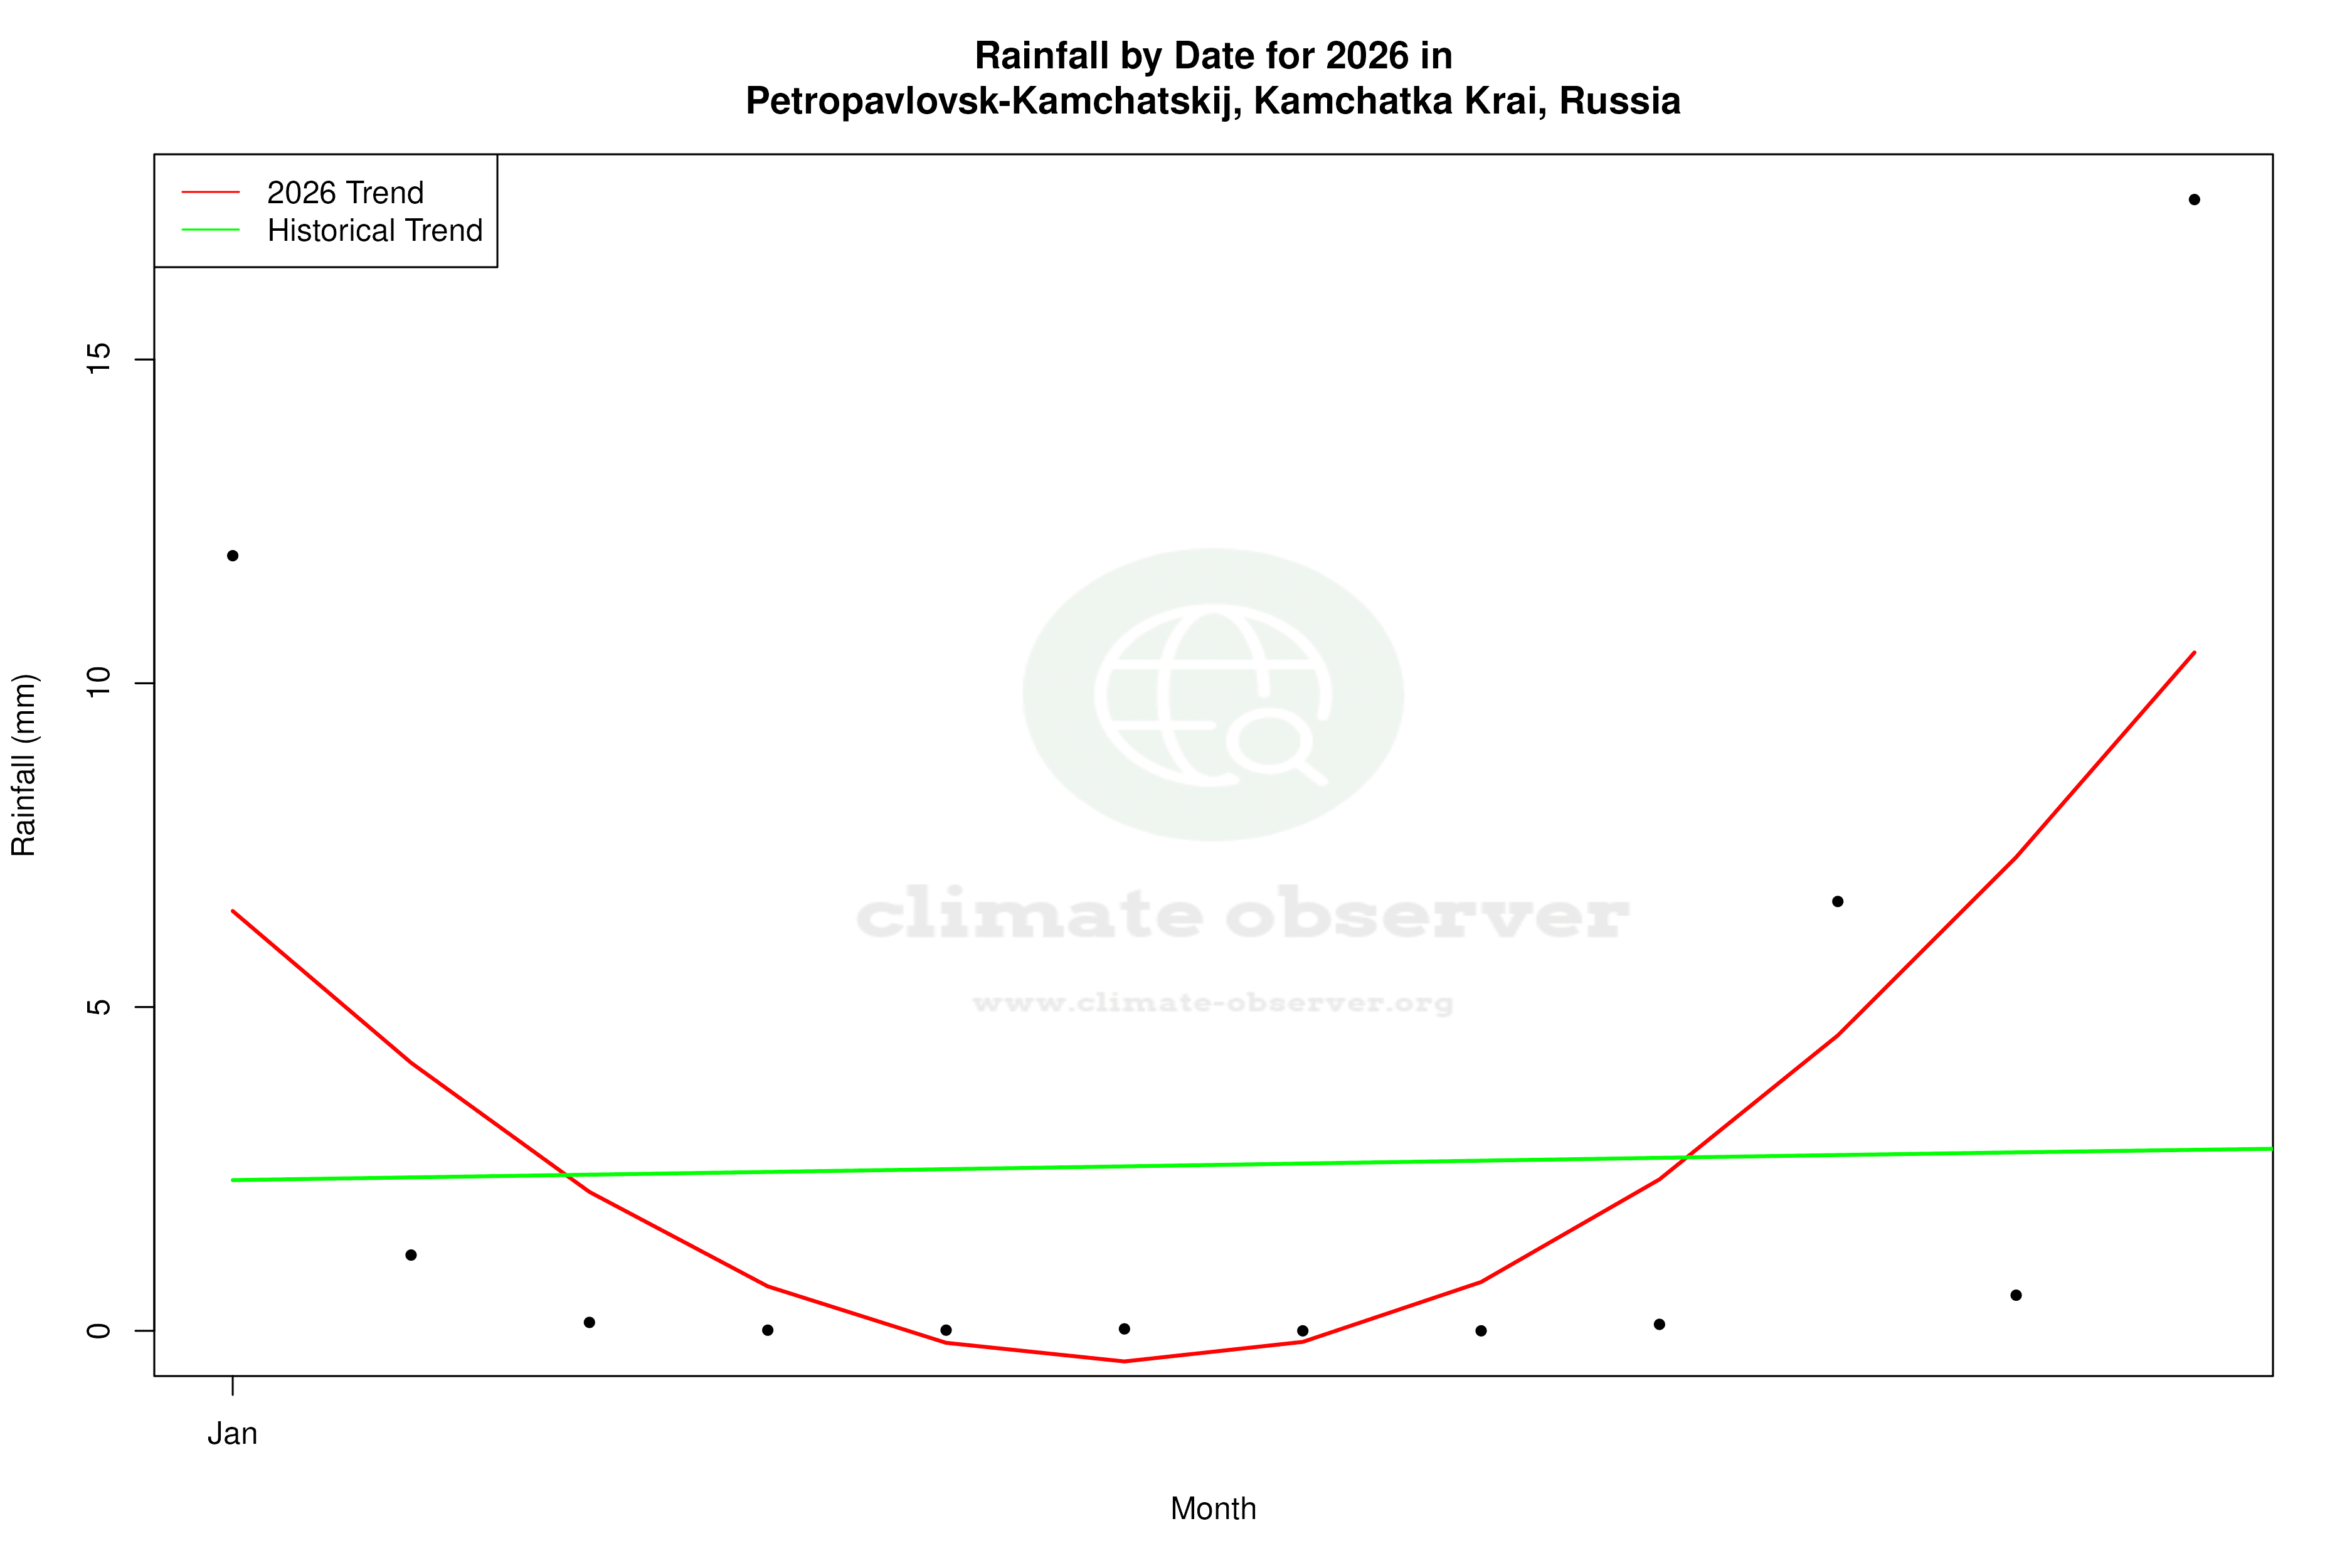
Precipitation Patterns: A Slight Shift
The Precipitation Concentration Index (PCI) for Petropavlovsk-Kamchatskij has experienced a marginal decrease from a baseline of 11.97 to a current value of 11.58. The PCI measures how precipitation is distributed over time, with higher values indicating more concentrated rainfall in fewer events. This slight decrease suggests a trend towards more evenly distributed precipitation events, which could influence water resource management and agricultural planning in the region.
Temperature Extremes: Record Observations
The region has recorded extreme temperatures, with a maximum of 30.0°C (86.0°F) and a minimum of -31.7°C (-25.1°F). These records underscore the variability and potential for extreme weather events, which are critical considerations for infrastructure resilience and emergency preparedness.
Regional Climate Goals and Implications
Russia's broader climate goals, which include reducing greenhouse gas emissions and adapting to climate change impacts, provide a relevant backdrop to these findings. The observed warming trends, particularly in nighttime lows, align with global patterns of climate change and highlight the importance of regional adaptation strategies. The slight decrease in precipitation concentration may offer some respite in terms of flood risk, yet it also necessitates careful monitoring to ensure water resources remain sustainable for the local population and ecosystems.
Station Statistics
10-Year Trend
High: +0.02 °C/decade
Low: +0.67 °C/decade
Rain: -0.10 mm/decade
25-Year Trend
High: +0.61 °C/decade
Low: +0.40 °C/decade
Rain: +0.07 mm/decade
50-Year Trend
High: +0.35 °C/decade
Low: +0.22 °C/decade
Rain: -0.04 mm/decade
All-Time Trend
High: +0.32 °C/decade
Low: +0.26 °C/decade
Rain: +0.11 mm/decade
Percentage Above-Average Days
Last 12 Months: 49.6%
This Year: 28.9%
Precipitation Concentration Index (PCI) ℹ️
Last 12 Months: 10.7
Historical Average: 13.4
Percentile Rank of Last 12 Months ℹ️
High: 83rd percentile
Low: 87th percentile
Rain: 72nd percentile
Change in Variance ℹ️
High: +4.2%
Low: -4.7%
Intraday: +47.5%
Data Coverage
78.6%
First Year of Data
1896
Station Location
Historical Weather Records
| Max High | Avg High | Min High | Max Avg | Avg Avg | Min Avg | Max Low | Avg Low | Min Low | Max Precipitation | Avg Precipitation | Max Snow | Avg Snow | |
|---|---|---|---|---|---|---|---|---|---|---|---|---|---|
| Record | 30.0 °C | — | -21.7 °C | 23.0 °C | — | -20.7 °C | 19.5 °C | — | -31.7 °C | 149.4 mm | — | — | — |
| January | 6.1 °C | -5.1 °C | -21.7 °C | 2.7 °C | -7.4 °C | -20.0 °C | 2.1 °C | -10.6 °C | -28.6 °C | 140.9 mm | 2.9 mm | — | — |
| February | 6.2 °C | -4.5 °C | -18.0 °C | 3.4 °C | -7.1 °C | -20.7 °C | 2.0 °C | -10.3 °C | -31.7 °C | 61.2 mm | 2.3 mm | — | — |
| March | 16.3 °C | -1.7 °C | -14.7 °C | 3.6 °C | -4.3 °C | -17.9 °C | 10.4 °C | -7.5 °C | -24.8 °C | 83.3 mm | 2.5 mm | — | — |
| April | 15.1 °C | 2.3 °C | -6.4 °C | 9.2 °C | -0.2 °C | -11.0 °C | 6.5 °C | -3.0 °C | -14.8 °C | 85.2 mm | 2.3 mm | — | — |
| May | 22.7 °C | 7.0 °C | -1.2 °C | 16.5 °C | 4.2 °C | -5.8 °C | 9.1 °C | 1.1 °C | -7.8 °C | 80.0 mm | 1.9 mm | — | — |
| June | 28.0 °C | 12.1 °C | 1.0 °C | 20.7 °C | 9.6 °C | 2.4 °C | 16.8 °C | 5.4 °C | -5.5 °C | 53.2 mm | 1.9 mm | — | — |
| July | 30.0 °C | 15.8 °C | 4.5 °C | 22.7 °C | 13.2 °C | 5.8 °C | 18.4 °C | 9.2 °C | 0.0 °C | 64.0 mm | 2.4 mm | — | — |
| August | 27.7 °C | 16.6 °C | 8.0 °C | 23.0 °C | 13.7 °C | 8.3 °C | 19.5 °C | 10.3 °C | 0.0 °C | 89.0 mm | 2.9 mm | — | — |
| September | 24.4 °C | 13.7 °C | 6.2 °C | 19.7 °C | 10.3 °C | 3.5 °C | 15.6 °C | 7.0 °C | -3.2 °C | 86.3 mm | 3.2 mm | — | — |
| October | 19.4 °C | 7.8 °C | -3.5 °C | 12.8 °C | 4.8 °C | -2.4 °C | 11.2 °C | 2.1 °C | -8.6 °C | 149.4 mm | 3.9 mm | — | — |
| November | 12.6 °C | 0.9 °C | -9.0 °C | 7.5 °C | -1.4 °C | -12.3 °C | 7.7 °C | -4.0 °C | -16.5 °C | 135.2 mm | 3.4 mm | — | — |
| December | 11.1 °C | -3.4 °C | -18.0 °C | 4.2 °C | -5.9 °C | -18.1 °C | 4.0 °C | -8.3 °C | -26.0 °C | 110.8 mm | 3.1 mm | — | — |
Data Visualisations
Remove WatermarksCurrent Year Climate Trends vs Historical


Max Temperature this Year | 1 of 6
Climate 12-Month Moving Averages


Max Temperature 12-Month MA | 1 of 6
Daily Data Points and Averages Throughout the Year


Average Max Temperature Throughout Year | 1 of 5
