Climate for Station: Astrakan, Astrakhan Oblast, Russia
Loading live weather...
Climate Analysis & Overview
Astrakan's climate is experiencing a warming trend, particularly in nighttime temperatures, with a notable increase in the past decade. Precipitation patterns have become more evenly distributed, indicating a shift in rainfall dynamics. These changes are crucial in the context of Russia's climate goals, which aim to mitigate the impacts of climate change.
Warming Nights and Rising Days
Astrakan, located in the semi-arid steppe region of southern Russia, is classified under the Köppen climate system as a cold desert climate (BWk). The region is characterised by hot summers and cold winters, influenced by its proximity to the Caspian Sea and the Volga River. Over the past decade, Astrakan has experienced a significant warming trend, particularly in nighttime temperatures. The 10-year trend shows an increase in lows by 1.04°C (1.87°F), while highs have risen by 0.59°C (1.06°F). This suggests that nights are warming faster than days, a pattern consistent with global climate change observations.
Long-term Climate Shifts
When examining the all-time trends, Astrakan's climate continues to show a warming pattern, albeit at a slower pace. High temperatures have increased by 0.22°C (0.40°F), and lows by 0.13°C (0.23°F). This gradual warming over the years highlights the persistent nature of climate change in the region. The increase in temperatures, although modest, is significant for a region that already experiences extreme temperature variations, with record highs reaching 41.0°C (105.8°F) and lows plunging to -33.6°C (-28.5°F).
Precipitation Patterns: A Shift Towards Even Distribution
The Precipitation Concentration Index (PCI) provides insight into the distribution of rainfall over time. Astrakan's PCI has decreased from a baseline of 13.9 to a current value of 12.8, indicating a more even distribution of precipitation events. This marginal change suggests that rainfall is becoming less concentrated in intense events and more spread out over time. Such a shift could have implications for agriculture and water management in the region, aligning with Russia's broader climate adaptation strategies.
Regional Implications and Climate Goals
The observed climate trends in Astrakan are set against the backdrop of Russia's regional climate goals, which focus on reducing greenhouse gas emissions and adapting to climate change impacts. The warming trends, particularly in nighttime temperatures, could affect energy consumption patterns, as warmer nights may reduce heating needs in winter. Moreover, the more evenly distributed precipitation could benefit water resource management, a critical aspect of regional climate resilience efforts.
These climate dynamics underscore the importance of monitoring and adapting to ongoing changes, ensuring that Astrakan and similar regions can sustainably manage their natural resources and meet national climate objectives.
Station Statistics
10-Year Trend
High: +0.67 °C/decade
Low: +1.21 °C/decade
Rain: +0.24 mm/decade
25-Year Trend
High: +0.45 °C/decade
Low: +0.62 °C/decade
Rain: +0.03 mm/decade
50-Year Trend
High: +0.54 °C/decade
Low: +0.45 °C/decade
Rain: +0.01 mm/decade
All-Time Trend
High: +0.24 °C/decade
Low: +0.14 °C/decade
Rain: +0.01 mm/decade
Percentage Above-Average Days
Last 12 Months: 57.5%
This Year: 65.2%
Precipitation Concentration Index (PCI) ℹ️
Last 12 Months: 11.2
Historical Average: 13.5
Percentile Rank of Last 12 Months ℹ️
High: 90th percentile
Low: 98th percentile
Rain: 96th percentile
Change in Variance ℹ️
High: -6.8%
Low: -16.0%
Intraday: -0.0%
Data Coverage
94.7%
First Year of Data
1881
Station Location
Historical Weather Records
| Max High | Avg High | Min High | Max Avg | Avg Avg | Min Avg | Max Low | Avg Low | Min Low | Max Precipitation | Avg Precipitation | Max Snow | Avg Snow | |
|---|---|---|---|---|---|---|---|---|---|---|---|---|---|
| Record | 41.0 °C | — | -24.1 °C | 33.7 °C | — | -28.0 °C | 27.9 °C | — | -33.6 °C | 73.0 mm | — | — | — |
| January | 20.6 °C | -1.8 °C | -24.1 °C | 8.4 °C | -5.6 °C | -27.8 °C | 6.9 °C | -8.7 °C | -31.8 °C | 20.4 mm | 0.4 mm | — | — |
| February | 17.1 °C | -0.5 °C | -20.6 °C | 9.7 °C | -4.8 °C | -27.6 °C | 5.6 °C | -8.4 °C | -33.6 °C | 17.4 mm | 0.4 mm | — | — |
| March | 24.0 °C | 6.5 °C | -13.9 °C | 16.9 °C | 1.2 °C | -19.8 °C | 11.3 °C | -2.9 °C | -25.2 °C | 44.9 mm | 0.5 mm | — | — |
| April | 32.0 °C | 16.7 °C | -0.4 °C | 23.7 °C | 10.5 °C | -4.6 °C | 17.7 °C | 5.1 °C | -8.9 °C | 46.4 mm | 0.6 mm | — | — |
| May | 36.8 °C | 24.2 °C | 8.8 °C | 28.7 °C | 18.3 °C | 5.3 °C | 23.6 °C | 12.5 °C | -1.1 °C | 73.0 mm | 0.7 mm | — | — |
| June | 40.6 °C | 28.9 °C | 14.0 °C | 32.8 °C | 23.3 °C | 9.4 °C | 26.0 °C | 17.8 °C | 5.4 °C | 59.3 mm | 0.7 mm | — | — |
| July | 41.0 °C | 31.5 °C | 19.2 °C | 33.7 °C | 25.7 °C | 15.9 °C | 27.6 °C | 19.9 °C | 10.1 °C | 62.0 mm | 0.5 mm | — | — |
| August | 40.8 °C | 30.2 °C | 16.7 °C | 33.6 °C | 24.0 °C | 12.3 °C | 27.9 °C | 18.1 °C | 6.1 °C | 63.5 mm | 0.4 mm | — | — |
| September | 38.0 °C | 23.7 °C | 7.2 °C | 29.9 °C | 17.5 °C | 3.4 °C | 22.7 °C | 12.1 °C | -2.0 °C | 60.3 mm | 0.6 mm | — | — |
| October | 29.9 °C | 15.4 °C | -3.0 °C | 21.6 °C | 9.9 °C | -6.3 °C | 17.7 °C | 5.3 °C | -10.5 °C | 40.8 mm | 0.5 mm | — | — |
| November | 21.6 °C | 6.9 °C | -19.8 °C | 15.0 °C | 2.9 °C | -17.9 °C | 13.8 °C | -0.5 °C | -25.8 °C | 21.6 mm | 0.5 mm | — | — |
| December | 16.4 °C | 0.6 °C | -22.0 °C | 9.9 °C | -2.5 °C | -28.0 °C | 7.9 °C | -5.4 °C | -29.9 °C | 24.0 mm | 0.5 mm | — | — |
Data Visualisations
Remove WatermarksCurrent Year Climate Trends vs Historical


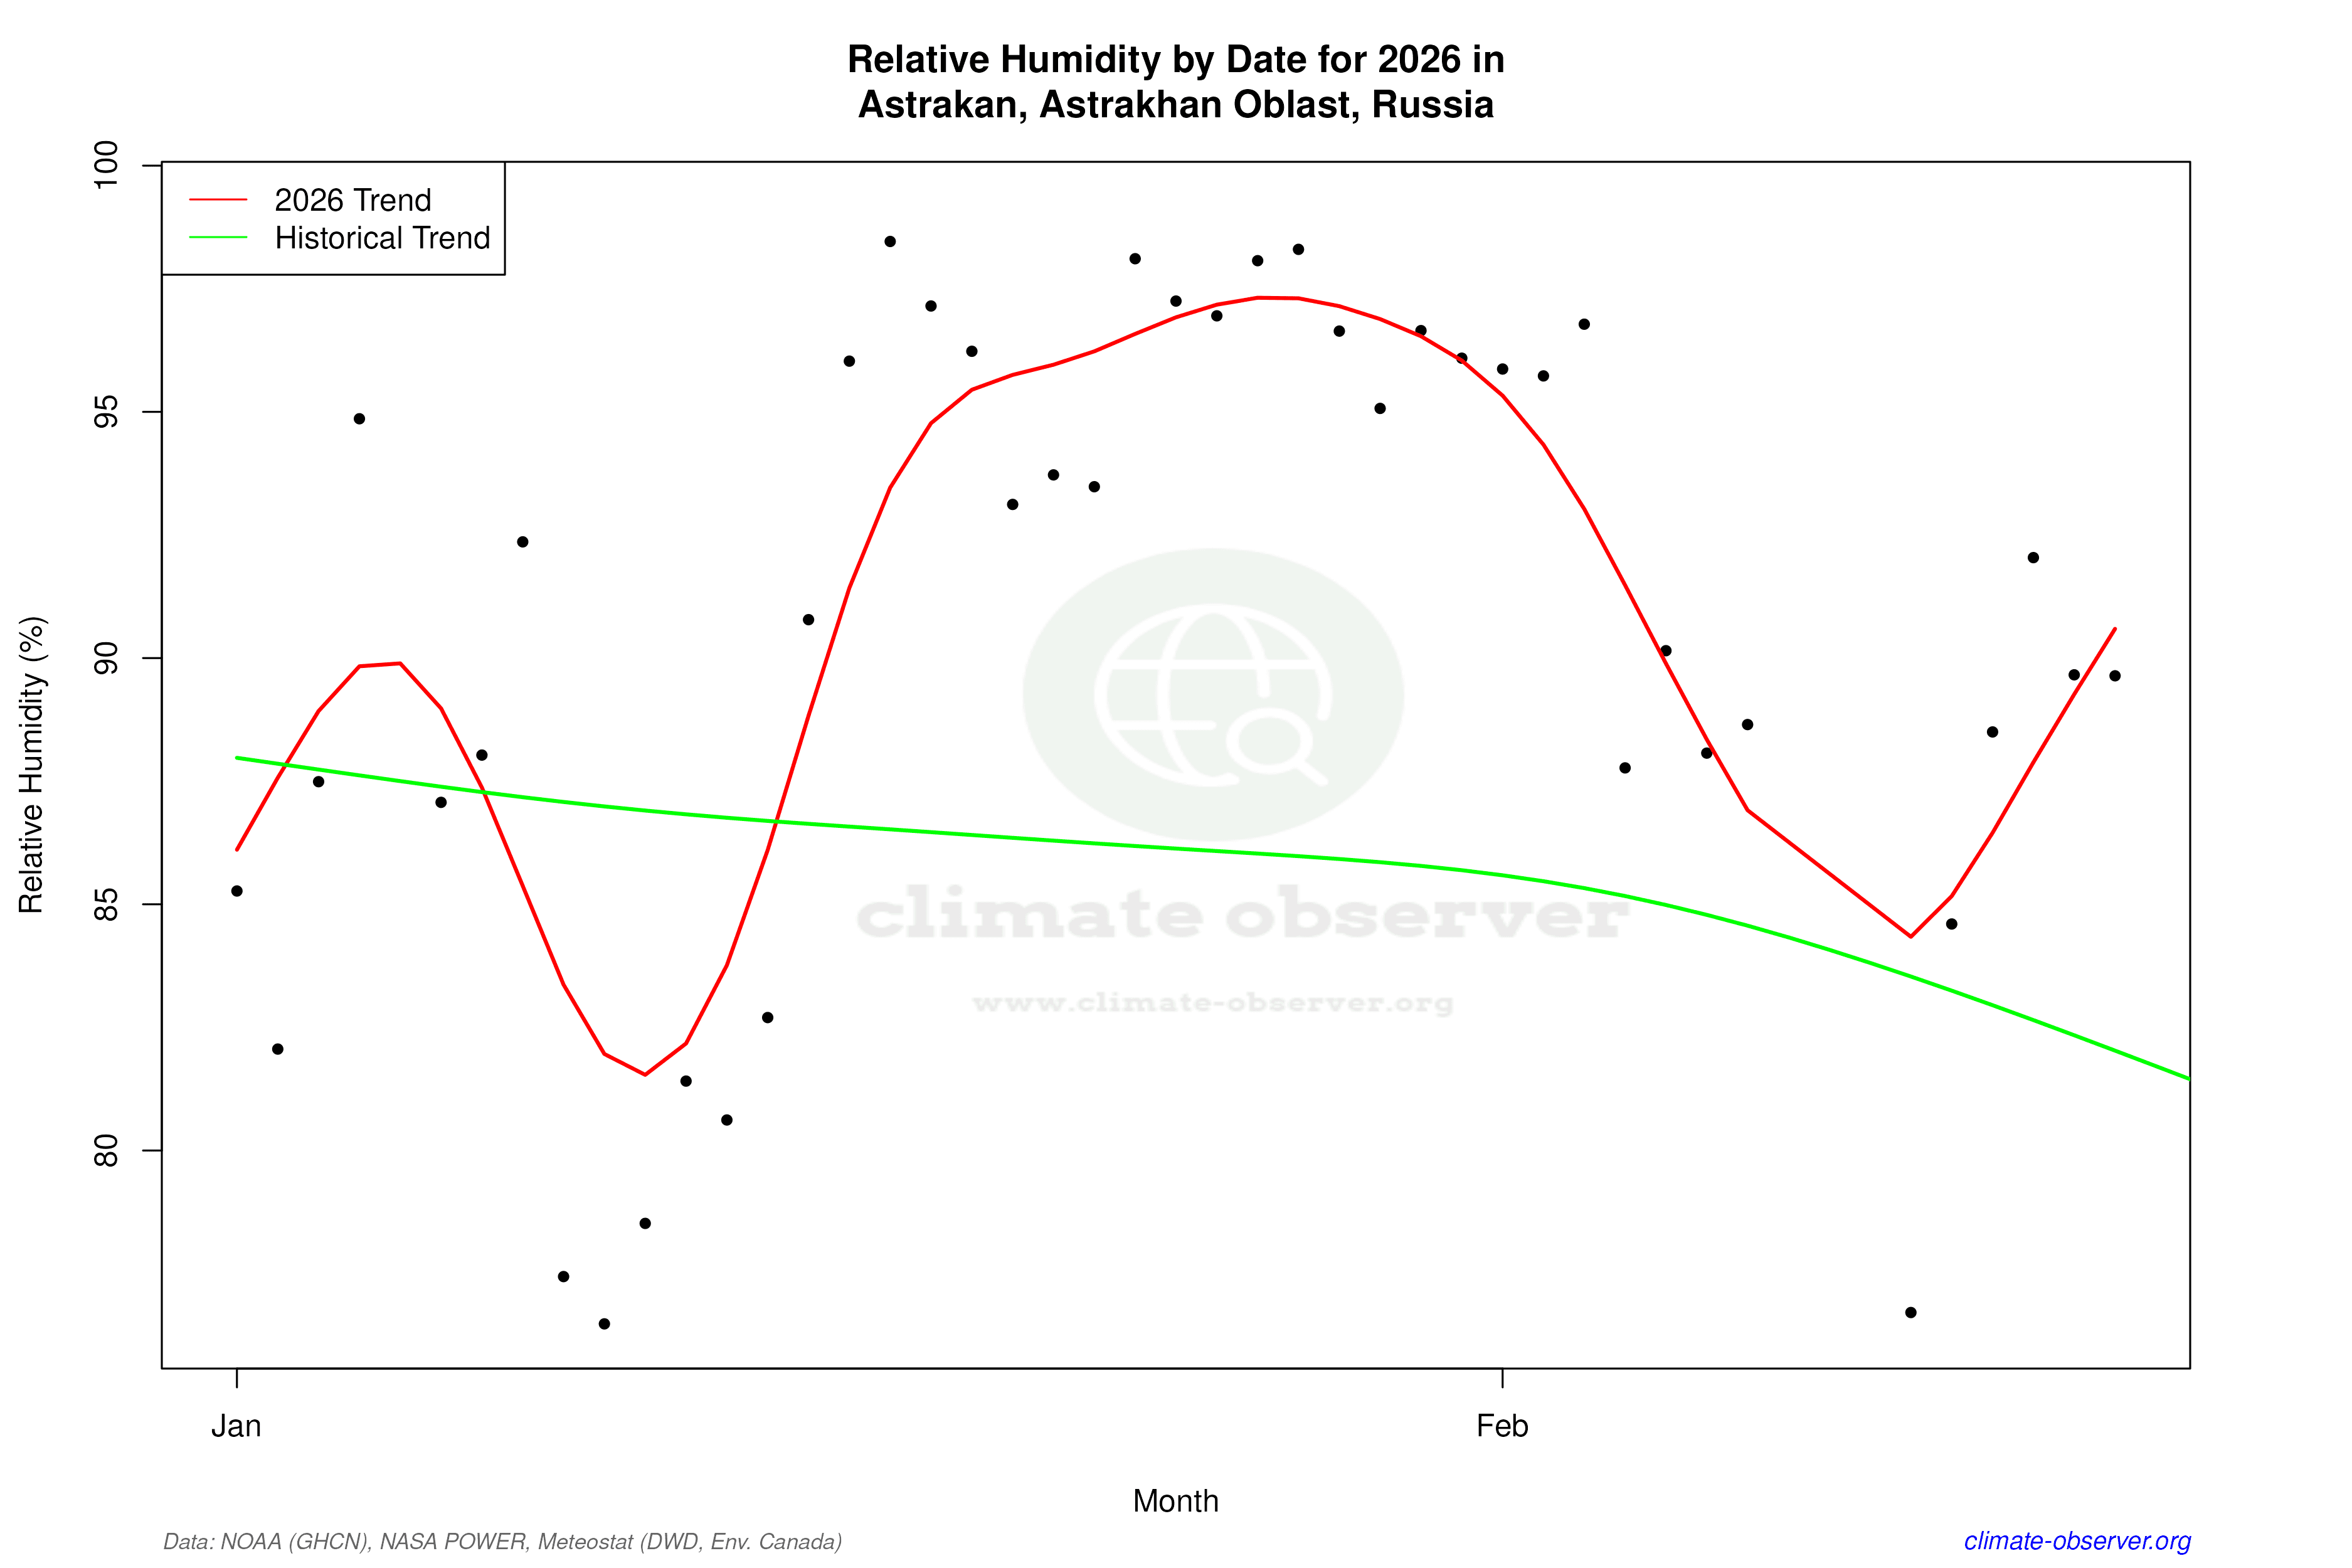

Max Temperature this Year | 1 of 6
Climate 12-Month Moving Averages


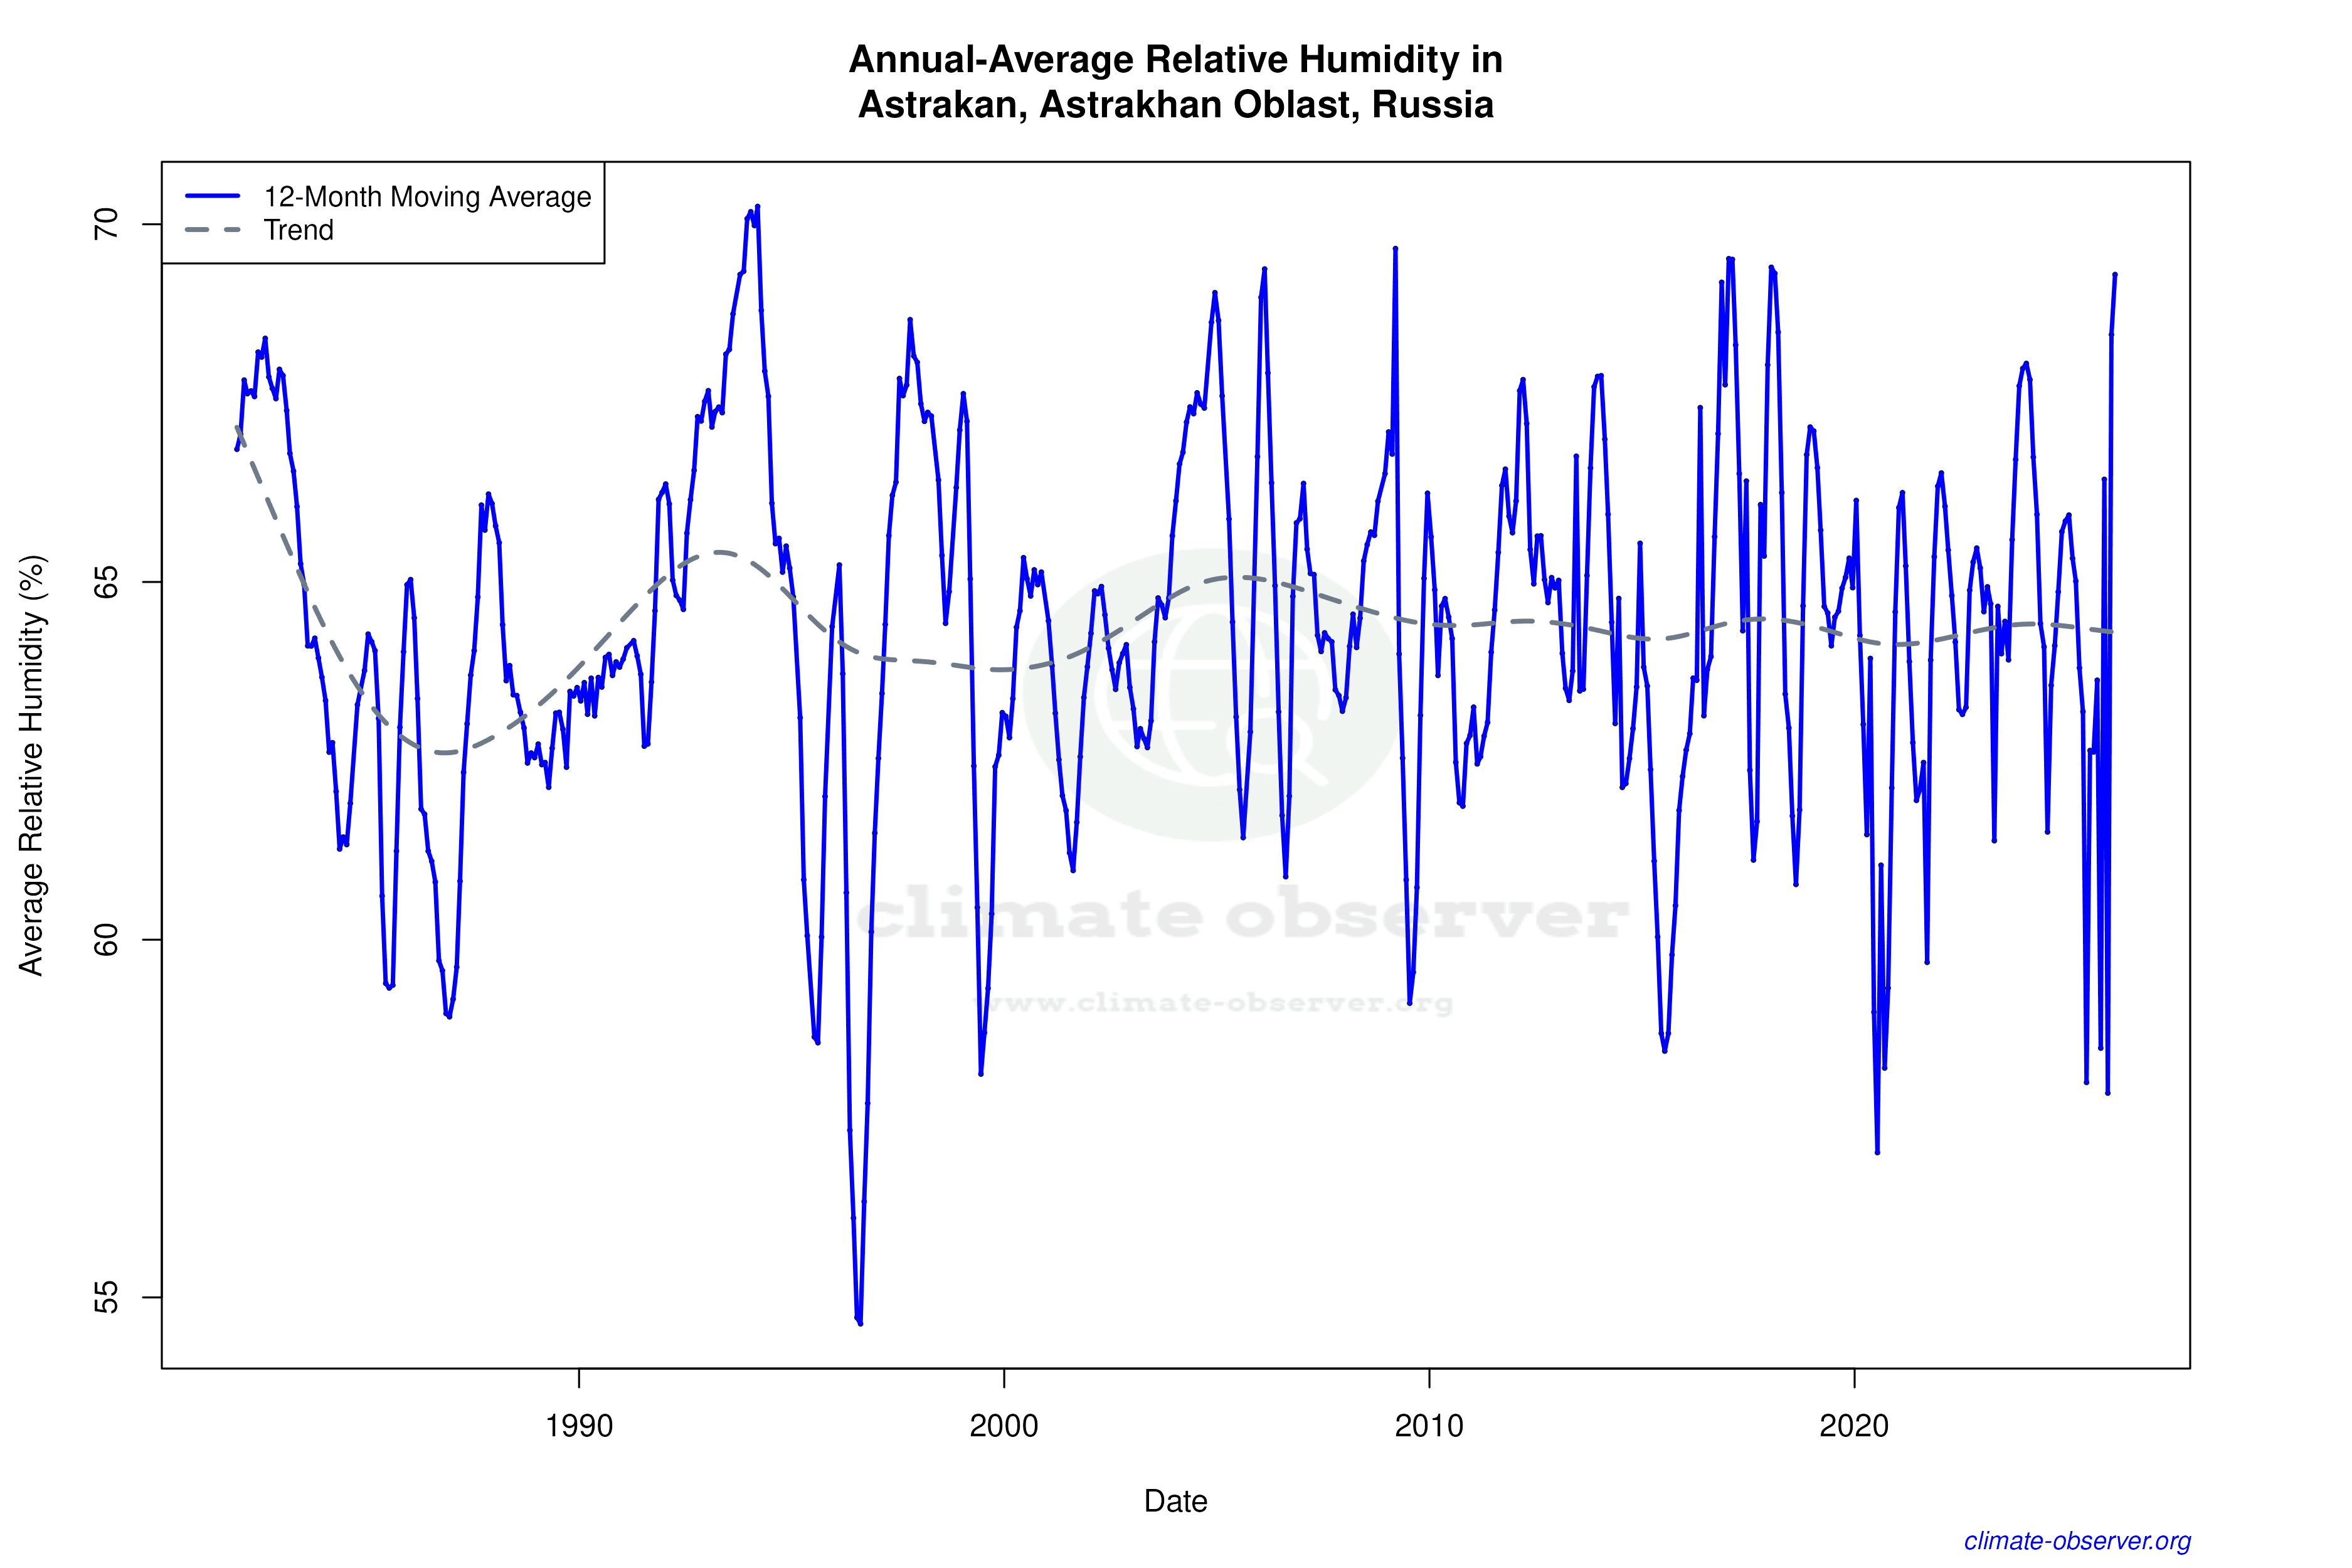

Max Temperature 12-Month MA | 1 of 6
Daily Data Points and Averages Throughout the Year


Average Max Temperature Throughout Year | 1 of 5
